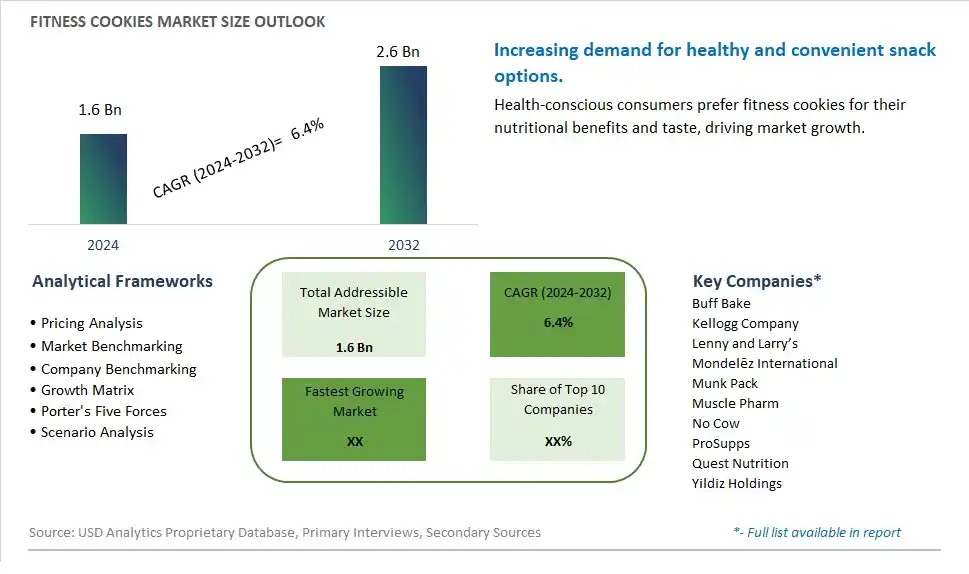
Global Fitness Cookies Market Size is valued at $1.6 Billion in 2024 and is forecast to register a growth rate (CAGR) of 6.4% to reach $2.6 Billion by 2032.
The global Fitness Cookies Market Comprehensive Study analyzes and forecasts the market size across 6 regions and 24 countries for diverse segments -By Type (Oat Meal Cookies, Protein Cookies, Fiber Cookies, Others), By Application (Online, Offline)
An Introduction to Fitness Cookies Market
In 2024, the Fitness Cookies market is witnessing robust growth, driven by the increasing demand for convenient and nutritious snacks among health-conscious consumers. Fitness cookies, enriched with protein, fiber, and functional ingredients, are popular among athletes, fitness enthusiasts, and busy professionals. The market benefits from advancements in food formulation technologies, the growing trend of functional and clean label foods, and the expansion of the health and wellness sector. Additionally, the rising awareness of the benefits of high-protein and low-sugar snacks for energy and muscle recovery is contributing to market growth.
Fitness Cookies Competitive Landscape
The market report analyses the leading companies in the industry including Buff Bake, Kellogg Company, Lenny and Larry’s, MondelÄ“z International, Munk Pack, Muscle Pharm, No Cow, ProSupps, Quest Nutrition, Yildiz Holdings, and Others.
Fitness Cookies Market Dynamics
Fitness Cookies Market Trend: Increasing Demand for High-Protein and Functional Snacks
The fitness cookies market is experiencing a significant trend towards increasing demand for high-protein and functional snacks. Consumers are becoming more health-conscious and are seeking convenient snack options that support their fitness goals and provide nutritional benefits. Fitness cookies, enriched with protein, fiber, and other functional ingredients, are gaining popularity as they offer a convenient way to boost energy, support muscle recovery, and enhance overall health. This trend is driven by the rise of the health and wellness movement, with consumers prioritizing clean eating and balanced nutrition. The market is witnessing a proliferation of innovative fitness cookie products that cater to various dietary preferences and health needs, including gluten-free, vegan, and low-sugar options.
Fitness Cookies Market Driver: Rising Health and Fitness Awareness
The rising health and fitness awareness among consumers is a major driver for the fitness cookies market. With an increasing focus on maintaining a healthy lifestyle, more people are incorporating regular exercise and balanced diets into their routines. This shift towards health and wellness is fueling the demand for snacks that align with fitness goals and provide functional benefits. Fitness cookies, formulated with high-quality proteins, superfoods, and minimal artificial ingredients, are becoming a preferred choice for health-conscious individuals seeking to complement their active lifestyles. The proliferation of fitness trends, social media influence, and the popularity of health and wellness influencers are further driving this demand.
Fitness Cookies Market Opportunity: Innovation in Flavor and Nutrient Combinations
There is a significant opportunity for growth in the fitness cookies market through innovation in flavor and nutrient combinations. Companies can capitalize on this opportunity by developing fitness cookies that offer unique and appealing flavors, such as exotic fruits, dark chocolate, and nut butters, combined with functional ingredients like probiotics, adaptogens, and plant-based proteins. By creating diverse product lines that cater to different taste preferences and dietary needs, manufacturers can attract a broader consumer base. Additionally, marketing these innovative products with clear health benefits and transparent ingredient sourcing can enhance brand loyalty and drive market expansion in the competitive fitness snacks segment.
Fitness Cookies Market Share Analysis: Protein Cookies segment generated the highest revenue share in the industry
Protein Cookies are the largest segment in the Fitness Cookies Market by Type. This segment's dominance is driven by the growing consumer demand for high-protein snacks that support active lifestyles and fitness goals. Protein cookies provide a convenient and tasty way to increase daily protein intake, which is essential for muscle repair, growth, and overall body maintenance. They are particularly popular among fitness enthusiasts, athletes, and health-conscious individuals who prioritize protein-rich diets. The versatility of protein cookies, available in various flavors and formulations, caters to a wide range of dietary preferences, including gluten-free, vegan, and low-sugar options. The increasing awareness of the benefits of protein consumption, combined with the trend towards healthier snacking alternatives, has solidified the position of protein cookies as the largest segment in the fitness cookies market.
Fitness Cookies Market Share Analysis: Online is the fastest growing segment over the forecast period to 2032
The Online segment is projected to be the fastest-growing application in the Fitness Cookies Market by 2032. This rapid growth is attributed to the increasing consumer preference for the convenience and accessibility of online shopping. Online retail platforms offer a wide variety of fitness cookies, allowing consumers to easily compare products, read reviews, and make informed purchasing decisions from the comfort of their homes. The rise of e-commerce giants and specialized health food websites has expanded the availability of niche and specialty fitness cookies that may not be available in local stores. Additionally, the Past few yearshas accelerated the shift towards online shopping, with many consumers continuing to prefer this mode of purchase due to its safety and convenience. Digital marketing strategies, including targeted ads and social media promotions, further drive the visibility and sales of fitness cookies online. As internet penetration and smartphone usage continue to grow globally, the online segment is expected to see significant expansion, making it the fastest-growing application in the fitness cookies market.
Fitness Cookies Market Segmentation
By Type
Oat Meal Cookies
Protein Cookies
Fiber Cookies
Others
By Application
Online
Offline
Countries Analyzed
North America (US, Canada, Mexico)
Europe (Germany, UK, France, Spain, Italy, Russia, Rest of Europe)
Asia Pacific (China, India, Japan, South Korea, Australia, South East Asia, Rest of Asia)
South America (Brazil, Argentina, Rest of South America)
Middle East and Africa (Saudi Arabia, UAE, Rest of Middle East, South Africa, Egypt, Rest of Africa)
Fitness Cookies Companies Profiled in the Study
Buff Bake
Kellogg Company
Lenny and Larry’s
Mondelēz International
Munk Pack
Muscle Pharm
No Cow
ProSupps
Quest Nutrition
Yildiz Holdings
*- List Not Exhaustive
Chapter 1. TABLE OF CONTENTS
Chapter 2. Introduction to Fitness Cookies Market
2.1. Market Overview
2.2. Key Statistics and Report Highlights
2.3. Scope of the Comprehensive Study
2.3.1. Market Definition
2.3.2 Countries and Regions Covered
2.3.3 Research Objective
2.3.4 Units, Currency, and Conversions
2.3.5 Industry Value Chain
2.4. Key Market Segments
2.5. Key Companies
2.6. Study Period
Chapter 3. Strategic Analysis Review
3.1. Fitness Cookies Pricing Analysis and Forecast
3.2. Porter’s Five Forces
3.3. Market Ecosystem
3.4. SWOT Analysis
3.5. Regulatory Scenario
3.3. Effects of Inflation, Russia-Ukraine War, moderating economic growth, and other macroeconomic factors
Chapter 4. Competitive Landscape
4.1. Market Share Analysis
4.1.1. Global Fitness Cookies Market Share by Company, 2023
4.1.2. Product Offerings of Leading Fitness Cookies Companies
4.2. Market Entropy
4.2.1. New Product Launches in the Industry
4.2.2. Mergers, Acquisitions, Joint ventures, and Partnerships
4.3. Key Strategies and Best Practices
Chapter 5. Global Market Projections: Best, Reference, and Low Case Scenarios
5.1. Growth Analysis- Case Scenario Definitions
5.2. Low Growth Case Scenario Forecasts
5.3. Reference Growth Case Scenario Forecasts
5.4. High Growth Case Scenario Forecasts
Chapter 6. Market Dynamics
6.1. Fitness Cookies Market Drivers
6.2. Fitness Cookies Market Challenges
6.6. Fitness Cookies Market Opportunities
6.4. Fitness Cookies Market Trends
Chapter 7. Global Fitness Cookies Market Outlook Trends
7.1. Global Fitness Cookies Revenue (USD Million) and CAGR (%) by Type (2021-2032)
7.2. Global Fitness Cookies Revenue (USD Million) and CAGR (%) by Application (2021-2032)
7.3. Global Fitness Cookies Revenue (USD Million) and CAGR (%) by Product (2021-2032)
By Type
Oat Meal Cookies
Protein Cookies
Fiber Cookies
Others
By Application
Online
Offline
Chapter 8. Global Fitness Cookies Regional Analysis and Outlook
8.1. Global Fitness Cookies Revenue (USD Million) By Regions (2021- 2032)
8.2. North America Fitness Cookies Revenue (USD Million) by Country (2021-2032)
8.2.1. United States Fitness Cookies Regional Analysis and Outlook
8.2.2. Canada Fitness Cookies Regional Analysis and Outlook
8.2.3. Mexico Fitness Cookies Regional Analysis and Outlook
8.3. Europe Fitness Cookies Revenue (USD Million), by Country (2021-2032)
8.3.1. Germany Fitness Cookies Regional Analysis and Outlook
8.3.2. France Fitness Cookies Regional Analysis and Outlook
8.3.3. United Kingdom Fitness Cookies Regional Analysis and Outlook
8.3.4. Spain Fitness Cookies Regional Analysis and Outlook
8.3.5. Italy Fitness Cookies Regional Analysis and Outlook
8.3.6. Russia Fitness Cookies Regional Analysis and Outlook
8.3.7. Rest of Europe Fitness Cookies Regional Analysis and Outlook
8.4. Asia Pacific Fitness Cookies Revenue (USD Million) by Country (2021-2032)
8.4.1. China Fitness Cookies Regional Analysis and Outlook
8.4.2. Japan Fitness Cookies Regional Analysis and Outlook
8.4.3. India Fitness Cookies Regional Analysis and Outlook
8.4.4. South Korea Fitness Cookies Regional Analysis and Outlook
8.4.5. Australia Fitness Cookies Regional Analysis and Outlook
8.4.6. South East Asia Fitness Cookies Regional Analysis and Outlook
8.4.7. Rest of Asia Pacific Fitness Cookies Regional Analysis and Outlook
8.5. South America Fitness Cookies Revenue (USD Million), by Country (2021-2032)
8.5.1. Brazil Fitness Cookies Regional Analysis and Outlook
8.5.2. Argentina Fitness Cookies Regional Analysis and Outlook
8.5.3. Rest of South America Fitness Cookies Regional Analysis and Outlook
8.6. Middle East and Africa Fitness Cookies Revenue (USD Million) by Country (2021-2032)
8.6.1. Middle East Fitness Cookies Regional Analysis and Outlook
8.6.2. Africa Fitness Cookies Regional Analysis and Outlook
Chapter 9. North America Fitness Cookies Analysis and Outlook
9.1. North America Fitness Cookies Revenue (USD Million) by Segments (2021-2032)
9.1.1. North America Fitness Cookies Revenue (USD Million) by Type (2021-2032)
9.1.2. North America Fitness Cookies Revenue (USD Million) by Application (2021-2032)
9.1.3. North America Fitness Cookies Revenue (USD Million) by Product (2021-2032)
By Type
Oat Meal Cookies
Protein Cookies
Fiber Cookies
Others
By Application
Online
Offline
Chapter 10. Europe Fitness Cookies Analysis and Outlook
10.1. Europe Fitness Cookies Revenue (USD Million), by Segments (USD Million) (2021-2032)
10.1.1. Europe Fitness Cookies Revenue (USD Million) by Type (2021-2032)
10.1.2. Europe Fitness Cookies Revenue (USD Million) by Application (2021-2032)
10.1.3. Europe Fitness Cookies Revenue (USD Million) by Product (2021-2032)
By Type
Oat Meal Cookies
Protein Cookies
Fiber Cookies
Others
By Application
Online
Offline
Chapter 11. Asia Pacific Fitness Cookies Analysis and Outlook
11.1. Asia Pacific Fitness Cookies Revenue (USD Million), and Revenue (USD Million) by Segments (2021-2032)
11.1.1. Asia Pacific Fitness Cookies Revenue (USD Million) by Type (2021-2032)
11.1.2. Asia Pacific Fitness Cookies Revenue (USD Million) by Application (2021-2032)
11.1.3. Asia Pacific Fitness Cookies Revenue (USD Million) by Product (2021-2032)
By Type
Oat Meal Cookies
Protein Cookies
Fiber Cookies
Others
By Application
Online
Offline
Chapter 12. South America Fitness Cookies Analysis and Outlook
12.1. South America Fitness Cookies Revenue (USD Million), by Segments (2021-2032)
12.1.1. South America Fitness Cookies Revenue (USD Million) by Type (2021-2032)
12.1.2. South America Fitness Cookies Revenue (USD Million) by Application (2021-2032)
12.1.3. South America Fitness Cookies Revenue (USD Million) by Product (2021-2032)
By Type
Oat Meal Cookies
Protein Cookies
Fiber Cookies
Others
By Application
Online
Offline
Chapter 13. Middle East and Africa Fitness Cookies Analysis and Outlook
13.1. Middle East and Africa Fitness Cookies Revenue (USD Million), by Segments (2021-2032)
13.1.1. Middle East and Africa Fitness Cookies Revenue (USD Million) by Type (2021-2032)
13.1.2. Middle East and Africa Fitness Cookies Revenue (USD Million) by Application (2021-2032)
13.1.3. Middle East and Africa Fitness Cookies Revenue (USD Million) by Product (2021-2032)
By Type
Oat Meal Cookies
Protein Cookies
Fiber Cookies
Others
By Application
Online
Offline
Chapter 14. Fitness Cookies Company Profiles
14.1 Business Overview
14.2 Product Profiles
14.3 SWOT Profiles
14.5 Recent Developments
14.6 Financial Profile
List of Companies
Buff Bake
Kellogg Company
Lenny and Larry’s
Mondelēz International
Munk Pack
Muscle Pharm
No Cow
ProSupps
Quest Nutrition
Yildiz Holdings
15. Methodology and Data Sources
15.1 Customization Offerings
15.2 Subscription Services
15.3 Related Reports
15.4 Publisher Expertise
LIST OF TABLES
Table 1 Market Segmentation Analysis
Table 2 Global Fitness Cookies Market Share of Leading Companies, 2023
Table 3 Product Offerings of Leading Companies
Table 4 Low Growth Scenario Forecasts
Table 5 Reference Case Growth Scenario
Table 6 High Growth Case Scenario
Table 7 Global Fitness Cookies Revenue (USD Million) And CAGR (%) By Type (2021-2032)
Table 8 Global Fitness Cookies Revenue (USD Million) And CAGR (%) By Application (2021-2032)
Table 9 Global Fitness Cookies Revenue (USD Million) And CAGR (%) By Product (2021-2032)
Table 10 Global Fitness Cookies Market Revenue (USD Million) By Regions (2021-2032)
Table 11 Global Fitness Cookies Market Share (%) By Regions (2021-2032)
Table 12 North America Fitness Cookies Revenue (USD Million) By Country (2021-2032)
Table 13 Europe Fitness Cookies Revenue (USD Million) By Country (2021-2032)
Table 14 Asia Pacific Fitness Cookies Revenue (USD Million) By Country (2021-2032)
Table 15 South America Fitness Cookies Revenue (USD Million) By Country (2021-2032)
Table 16 Middle East and Africa Fitness Cookies Revenue (USD Million) By Region (2021-2032)
Table 17 North America Fitness Cookies Revenue (USD Million) By Type (2021-2032)
Table 18 North America Fitness Cookies Revenue (USD Million) By Application (2021-2032)
Table 19 North America Fitness Cookies Revenue (USD Million) By Product (2021-2032)
Table 20 Europe Fitness Cookies Revenue (USD Million) By Type (2021-2032)
Table 21 Europe Fitness Cookies Revenue (USD Million) By Application (2021-2032)
Table 22 Europe Fitness Cookies Revenue (USD Million) By Product (2021-2032)
Table 23 Asia Pacific Fitness Cookies Revenue (USD Million) By Type (2021-2032)
Table 24 Asia Pacific Fitness Cookies Revenue (USD Million) By Application (2021-2032)
Table 25 Asia Pacific Fitness Cookies Revenue (USD Million) By Product (2021-2032)
Table 26 South America Fitness Cookies Revenue (USD Million) By Type (2021-2032)
Table 27 South America Fitness Cookies Revenue (USD Million) By Application (2021-2032)
Table 28 South America Fitness Cookies Revenue (USD Million) By Product (2021-2032)
Table 29 Middle East and Africa Fitness Cookies Revenue (USD Million) By Type (2021-2032)
Table 30 Middle East and Africa Fitness Cookies Revenue (USD Million) By Application (2021-2032)
Table 31 Middle East and Africa Fitness Cookies Revenue (USD Million) By Product (2021-2032)
LIST OF FIGURES
Figure 1. Market Scope
Figure 2. Pricing Forecasts Per Unit, 2023- 2032
Figure 3. Porter’s Five Forces
Figure 4. Global Fitness Cookies Market Revenue (USD Million) By Regions (2021-2032)
Figure 5. Global Fitness Cookies Market Share (%) By Regions (2023)
Figure 6. North America Fitness Cookies Revenue (USD Million) By Country (2021-2032)
Figure 7. United States Fitness Cookies Revenue (USD Million) By Country (2021-2032)
Figure 8. Canada Fitness Cookies Revenue (USD Million) By Country (2021-2032)
Figure 9. Mexico Fitness Cookies Revenue (USD Million) By Country (2021-2032)
Figure 10. Europe Fitness Cookies Revenue (USD Million) By Country (2021-2032)
Figure 11. Germany Fitness Cookies Revenue (USD Million) By Country (2021-2032)
Figure 12. France Fitness Cookies Revenue (USD Million) By Country (2021-2032)
Figure 13. United Kingdom Fitness Cookies Revenue (USD Million) By Country (2021-2032)
Figure 14. Spain Fitness Cookies Revenue (USD Million) By Country (2021-2032)
Figure 15. Italy Fitness Cookies Revenue (USD Million) By Country (2021-2032)
Figure 16. Russia Fitness Cookies Revenue (USD Million) By Country (2021-2032)
Figure 17. Rest of Europe Fitness Cookies Revenue (USD Million) By Country (2021-2032)
Figure 11. Asia Pacific Fitness Cookies Revenue (USD Million) By Country (2021-2032)
Figure 12. China Fitness Cookies Revenue (USD Million) By Country (2021-2032)
Figure 13. Japan Fitness Cookies Revenue (USD Million) By Country (2021-2032)
Figure 14. India Fitness Cookies Revenue (USD Million) By Country (2021-2032)
Figure 15. South Korea Fitness Cookies Revenue (USD Million) By Country (2021-2032)
Figure 16. Australia Fitness Cookies Revenue (USD Million) By Country (2021-2032)
Figure 17. South East Asia Fitness Cookies Revenue (USD Million) By Country (2021-2032)
Figure 18. South America Fitness Cookies Revenue (USD Million) By Country (2021-2032)
Figure 19. Brazil Fitness Cookies Revenue (USD Million) By Country (2021-2032)
Figure 20. Argentina Fitness Cookies Revenue (USD Million) By Country (2021-2032)
Figure 21. Rest of Asia Pacific Fitness Cookies Revenue (USD Million) By Country (2021-2032)
Figure 22. Middle East and Africa Fitness Cookies Revenue (USD Million) By Region (2021-2032)
Figure 23. Saudi Arabia Fitness Cookies Revenue (USD Million) By Region (2021-2032)
Figure 24. The UAE Fitness Cookies Revenue (USD Million) By Region (2021-2032)
Figure 25. Rest of Middle East Fitness Cookies Revenue (USD Million) By Region (2021-2032)
Figure 26. South Africa Fitness Cookies Revenue (USD Million) By Region (2021-2032)
Figure 27. Africa Fitness Cookies Revenue (USD Million) By Region (2021-2032)
Figure 28. North America Fitness Cookies Revenue (USD Million) By Type (2021-2032)
Figure 29. North America Fitness Cookies Revenue (USD Million) By Application (2021-2032)
Figure 30. North America Fitness Cookies Revenue (USD Million) By Product (2021-2032)
Figure 31. Europe Fitness Cookies Revenue (USD Million) By Type (2021-2032)
Figure 32. Europe Fitness Cookies Revenue (USD Million) By Application (2021-2032)
Figure 33. Europe Fitness Cookies Revenue (USD Million) By Product (2021-2032)
Figure 34. Asia Pacific Fitness Cookies Revenue (USD Million) By Type (2021-2032)
Figure 35. Asia Pacific Fitness Cookies Revenue (USD Million) By Application (2021-2032)
Figure 36. Asia Pacific Fitness Cookies Revenue (USD Million) By Product (2021-2032)
Figure 37. South America Fitness Cookies Revenue (USD Million) By Type (2021-2032)
Figure 38. South America Fitness Cookies Revenue (USD Million) By Application (2021-2032)
Figure 39. South America Fitness Cookies Revenue (USD Million) By Product (2021-2032)
Figure 40. Middle East and Africa Fitness Cookies Revenue (USD Million) By Type (2021-2032)
Figure 41. Middle East and Africa Fitness Cookies Revenue (USD Million) By Application (2021-2032)
Figure 42. Middle East and Africa Fitness Cookies Revenue (USD Million) By Product (2021-2032)
By Type
Oat Meal Cookies
Protein Cookies
Fiber Cookies
Others
By Application
Online
Offline
Countries Analyzed
North America (US, Canada, Mexico)
Europe (Germany, UK, France, Spain, Italy, Russia, Rest of Europe)
Asia Pacific (China, India, Japan, South Korea, Australia, South East Asia, Rest of Asia)
South America (Brazil, Argentina, Rest of South America)
Middle East and Africa (Saudi Arabia, UAE, Rest of Middle East, South Africa, Egypt, Rest of Africa)
