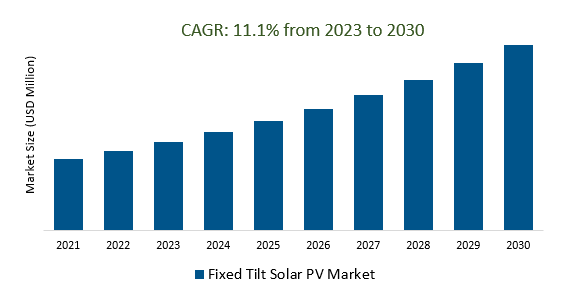
The Global Fixed Tilt Solar PV Market Size is estimated to register 11.1% growth over the forecast period from 2023 to 2030.
The Fixed Tilt Solar PV Market is driven by various factors, including government policies, environmental concerns, decreasing costs, energy independence, technological advancements, grid integration, bifacial solar panels, sustainability, community solar, innovative financing models, digitalization, solar-plus-storage, global expansion, solar tracking technologies, residential adoption, and integration into microgrids and islanding solutions. Government policies, tax incentives, and subsidies are crucial in promoting the adoption of these systems. The market is also influenced by rising awareness of climate change and the need for clean, renewable energy sources. Technological advancements, such as solar panel efficiency and durability, are making fixed tilt systems more reliable and cost-effective. The market is also influenced by the growing popularity of community solar projects, innovative financing models, and the integration of fixed tilt solar PV into microgrids and islanding solutions.
Grid Integration Solutions Bolster Solar Energy System Reliability and Stability is creating a demand in the market.
The integration of grid solutions plays a pivotal role in enhancing the reliability and stability of solar energy systems, which has spurred a growing demand within the Fixed Tilt Solar PV Market. Grid integration solutions encompass advanced technologies and strategies that optimize the seamless connection of solar arrays to the existing electrical grid. This synergy ensures a steady and consistent power supply, reducing the system's vulnerability to fluctuations in solar energy production. As a result, the Fixed Tilt Solar PV Market is witnessing a surge in interest as stakeholders recognize the pivotal role these solutions play in ensuring uninterrupted power generation and promoting sustainable energy practices. This heightened demand underscores the market's commitment to fortifying the efficiency and dependability of solar energy installations.
Solar Power as a Sustainable Solution to Climate Change and Renewable Energy Demand is attracting a wide customer base.
Solar power has emerged as a formidable and sustainable solution in the fight against climate change, offering a potent remedy to surging renewable energy demand. This eco-friendly energy source has gained widespread appeal and is capturing the attention of a diverse customer base. In particular, the Fixed Tilt Solar PV Market has witnessed a notable surge in interest and investment. With its static panel orientation, fixed tilt solar PV systems are known for their cost-effectiveness and ease of installation, making them an attractive choice for both residential and commercial consumers. As the world seeks to transition to cleaner energy sources and mitigate the effects of climate change, the Fixed Tilt Solar PV Market plays a pivotal role in advancing this transformative journey towards sustainability.
Enhanced Efficiency and Durability Transform Fixed Tilt Systems and helps in boosting the market.
Enhanced Efficiency and Durability are proving to be game-changers in the Fixed Tilt Solar PV Market. These advancements not only make solar energy production more reliable but also significantly boost market growth. By increasing the efficiency of fixed tilt systems, more energy can be generated from the same number of solar panels. This results in a higher return on investment for solar projects, attracting more investors and driving market expansion. Additionally, improved durability ensures that these systems can withstand harsh environmental conditions, prolonging their lifespan and reducing maintenance costs. As a result, the Fixed Tilt Solar PV Market is experiencing a substantial transformation, becoming more appealing and competitive in the renewable energy landscape.
Market Share Analysis:
Crystalline silicon is the most dominant technology in the fixed tilt solar PV market.
Crystalline silicon stands as the undisputed champion in the realm of fixed tilt solar photovoltaic technology, commanding a significant presence in the renewable energy landscape. This remarkable success can be attributed to its exceptional efficiency, reliability, and cost-effectiveness, making it the preferred choice for a wide range of solar installations. Crystalline silicon solar panels are renowned for their ability to harness sunlight efficiently, converting it into electricity with remarkable precision. This technology's enduring popularity is a testament to its durability and consistency, ensuring long-term energy production. As the cornerstone of many solar power projects, crystalline silicon continues to lead the way in driving the global transition to clean, sustainable energy sources. Its robust performance and affordability make it an enduring choice for harnessing the power of the sun.
The commercial sector stands as the unequivocal driving force in the fixed-tilt solar photovoltaic (PV) market.
The undeniable dominance is evident in the widespread adoption of solar technology across businesses, office complexes, and industrial facilities. This surge in commercial installations is spurred by the desire to reduce energy costs and embrace sustainable practices. Moreover, the attractiveness of fixed-tilt solar PV systems lies in their cost-effectiveness, making them an ideal choice for commercial enterprises seeking long-term energy savings. As a result, the commercial sector plays a pivotal role in shaping the trajectory of the solar energy landscape, with its influence set to increase as sustainability becomes an even more prominent concern in the business world. The success of fixed-tilt solar PV in the commercial arena signifies a significant step towards a greener and more sustainable future.
The Asia Pacific region stands as the undisputed leader in the Fixed Tilt Solar PV Market.
With its burgeoning economies, robust technological advancements, and a growing commitment to sustainability, the region has established itself as the epicenter of solar power generation. Boasting a vast expanse of untapped solar resources, countries in the Asia Pacific have harnessed their potential to significantly bolster the adoption of fixed tilt solar PV systems. This dominance is underpinned by a concerted effort to reduce carbon emissions and dependence on conventional energy sources, driving substantial investment and innovation in the solar sector. Moreover, supportive government policies and incentives have further propelled the growth of the Fixed Tilt Solar PV Market in the Asia Pacific, making it a pivotal player in the global renewable energy landscape. As the region continues to set the pace for solar energy deployment, it cements its position as a vital contributor to a greener and more sustainable future.
Fixed Tilt Solar PV Market Segmentation
By Technology
- Crystalline Silicon
- Thin Film
- Others
By End User
- Residential
- Commercial
- Utility
By Region
- North America (United States, Canada, Mexico)
- Europe (Germany, France, United Kingdom, Spain, Italy, Others)
- Asia Pacific (China, India, Japan, South Korea, Australia, Others)
- Latin America (Brazil, Argentina, Others)
- Middle East and Africa (Saudi Arabia, UAE, Kuwait, Other Middle East, South Africa, Nigeria, Other Africa)
Fixed Tilt Solar PV Market Companies
- Solar FlexRack
- Trina Solar
- Alion Energy, Inc
- Sharp Corporation
- UNIRAC Inc
- Canadian Solar
- First Solar
- STI Norland
- Arctech Solar Holding Co
- SolarCity
*List not exhaustive
Fixed Tilt Solar PV Market Outlook 2023
1 Market Overview
1.1 Introduction to the Fixed Tilt Solar PV Market
1.2 Scope of the Study
1.3 Research Objective
1.3.1 Key Market Scope and Segments
1.3.2 Players Covered
1.3.3 Years Considered
2 Executive Summary
2.1 2023 Fixed Tilt Solar PV Industry- Market Statistics
3 Market Dynamics
3.1 Market Drivers
3.2 Market Challenges
3.3 Market Opportunities
3.4 Market Trends
4 Market Factor Analysis
4.1 Porter’s Five Forces
4.2 Market Entropy
4.2.1 Global Fixed Tilt Solar PV Market Companies with Area Served
4.2.2 Products Offerings Global Fixed Tilt Solar PV Market
5 COVID-19 Impact Analysis and Outlook Scenarios
5.1.1 Covid-19 Impact Analysis
5.1.2 post-COVID-19 Scenario- Low Growth Case
5.1.3 post-COVID-19 Scenario- Reference Growth Case
5.1.4 post-COVID-19 Scenario- Low Growth Case
6 Global Fixed Tilt Solar PV Market Trends
6.1 Global Fixed Tilt Solar PV Revenue (USD Million) and CAGR (%) by Type (2018-2030)
6.2 Global Fixed Tilt Solar PV Revenue (USD Million) and CAGR (%) by Applications (2018-2030)
6.3 Global Fixed Tilt Solar PV Revenue (USD Million) and CAGR (%) by regions (2018-2030)
7 Global Fixed Tilt Solar PV Market Revenue (USD Million) by Type, and Applications (2018-2022)
7.1 Global Fixed Tilt Solar PV Revenue (USD Million) by Type (2018-2022)
7.1.1 Global Fixed Tilt Solar PV Revenue (USD Million), Market Share (%) by Type (2018-2022)
7.2 Global Fixed Tilt Solar PV Revenue (USD Million) by Applications (2018-2022)
7.2.1 Global Fixed Tilt Solar PV Revenue (USD Million), Market Share (%) by Applications (2018-2022)
8 Global Fixed Tilt Solar PV Development Regional Status and Outlook
8.1 Global Fixed Tilt Solar PV Revenue (USD Million) By Regions (2018-2022)
8.2 North America Fixed Tilt Solar PV Revenue (USD Million) by Type, and Application (2018-2022)
8.2.1 North America Fixed Tilt Solar PV Revenue (USD Million) by Country (2018-2022)
8.2.2 North America Fixed Tilt Solar PV Revenue (USD Million) by Type (2018-2022)
8.2.3 North America Fixed Tilt Solar PV Revenue (USD Million) by Applications (2018-2022)
8.3 Europe Fixed Tilt Solar PV Revenue (USD Million), by Type, and Applications (USD Million) (2018-2022)
8.3.1 Europe Fixed Tilt Solar PV Revenue (USD Million), by Country (2018-2022)
8.3.2 Europe Fixed Tilt Solar PV Revenue (USD Million) by Type (2018-2022)
8.3.3 Europe Fixed Tilt Solar PV Revenue (USD Million) by Applications (2018-2022)
8.4 Asia Pacific Fixed Tilt Solar PV Revenue (USD Million), and Revenue (USD Million) by Type, and Applications (2018-2022)
8.4.1 Asia Pacific Fixed Tilt Solar PV Revenue (USD Million) by Country (2018-2022)
8.4.2 Asia Pacific Fixed Tilt Solar PV Revenue (USD Million) by Type (2018-2022)
8.4.3 Asia Pacific Fixed Tilt Solar PV Revenue (USD Million) by Applications (2018-2022)
8.5 South America Fixed Tilt Solar PV Revenue (USD Million), by Type, and Applications (2018-2022)
8.5.1 South America Fixed Tilt Solar PV Revenue (USD Million), by Country (2018-2022)
8.5.2 South America Fixed Tilt Solar PV Revenue (USD Million) by Type (2018-2022)
8.5.3 South America Fixed Tilt Solar PV Revenue (USD Million) by Applications (2018-2022)
8.6 Middle East and Africa Fixed Tilt Solar PV Revenue (USD Million), by Type, Technology, Application, Thickness (2018-2022)
8.6.1 Middle East and Africa Fixed Tilt Solar PV Revenue (USD Million) by Country (2018-2022)
8.6.2 Middle East and Africa Fixed Tilt Solar PV Revenue (USD Million) by Type (2018-2022)
8.6.3 Middle East and Africa Fixed Tilt Solar PV Revenue (USD Million) by Applications (2018-2022)
9 Company Profiles
10 Global Fixed Tilt Solar PV Market Revenue (USD Million), by Type, and Applications (2023-2030)
10.1 Global Fixed Tilt Solar PV Revenue (USD Million) and Market Share (%) by Type (2023-2030)
10.1.1 Global Fixed Tilt Solar PV Revenue (USD Million), and Market Share (%) by Type (2023-2030)
10.2 Global Fixed Tilt Solar PV Revenue (USD Million) and Market Share (%) by Applications (2023-2030)
10.2.1 Global Fixed Tilt Solar PV Revenue (USD Million), and Market Share (%) by Applications (2023-2030)
11 Global Fixed Tilt Solar PV Development Regional Status and Outlook Forecast
11.1 Global Fixed Tilt Solar PV Revenue (USD Million) By Regions (2023-2030)
11.2 North America Fixed Tilt Solar PV Revenue (USD Million) by Type, and Applications (2023-2030)
11.2.1 North America Fixed Tilt Solar PV Revenue (USD) Million by Country (2023-2030)
11.2.2 North America Fixed Tilt Solar PV Revenue (USD Million), by Type (2023-2030)
11.2.3 North America Fixed Tilt Solar PV Revenue (USD Million), Market Share (%) by Applications (2023-2030)
11.3 Europe Fixed Tilt Solar PV Revenue (USD Million), by Type, and Applications (2023-2030)
11.3.1 Europe Fixed Tilt Solar PV Revenue (USD Million), by Country (2023-2030)
11.3.2 Europe Fixed Tilt Solar PV Revenue (USD Million), by Type (2023-2030)
11.3.3 Europe Fixed Tilt Solar PV Revenue (USD Million), by Applications (2023-2030)
11.4 Asia Pacific Fixed Tilt Solar PV Revenue (USD Million) by Type, and Applications (2023-2030)
11.4.1 Asia Pacific Fixed Tilt Solar PV Revenue (USD Million), by Country (2023-2030)
11.4.2 Asia Pacific Fixed Tilt Solar PV Revenue (USD Million), by Type (2023-2030)
11.4.3 Asia Pacific Fixed Tilt Solar PV Revenue (USD Million), by Applications (2023-2030)
11.5 South America Fixed Tilt Solar PV Revenue (USD Million), by Type, and Applications (2023-2030)
11.5.1 South America Fixed Tilt Solar PV Revenue (USD Million), by Country (2023-2030)
11.5.2 South America Fixed Tilt Solar PV Revenue (USD Million), by Type (2023-2030)
11.5.3 South America Fixed Tilt Solar PV Revenue (USD Million), by Applications (2023-2030)
11.6 Middle East and Africa Fixed Tilt Solar PV Revenue (USD Million), by Type, and Applications (2023-2030)
11.6.1 Middle East and Africa Fixed Tilt Solar PV Revenue (USD Million), by region (2023-2030)
11.6.2 Middle East and Africa Fixed Tilt Solar PV Revenue (USD Million), by Type (2023-2030)
11.6.3 Middle East and Africa Fixed Tilt Solar PV Revenue (USD Million), by Applications (2023-2030)
12 Methodology and Data Sources
12.1 Methodology/Research Approach
12.1.1 Research Programs/Design
12.1.2 Market Size Estimation
12.1.3 Market Breakdown and Data Triangulation
12.2 Data Sources
12.2.1 Secondary Sources
12.2.2 Primary Sources
12.3 Disclaimer
List of Tables
Table 1 Market Segmentation Analysis
Table 2 Global Fixed Tilt Solar PV Market Companies with Areas Served
Table 3 Products Offerings Global Fixed Tilt Solar PV Market
Table 4 Low Growth Scenario Forecasts
Table 5 Reference Case Growth Scenario
Table 6 High Growth Case Scenario
Table 7 Global Fixed Tilt Solar PV Revenue (USD Million) And CAGR (%) By Type (2018-2030)
Table 8 Global Fixed Tilt Solar PV Revenue (USD Million) And CAGR (%) By Applications (2018-2030)
Table 9 Global Fixed Tilt Solar PV Revenue (USD Million) And CAGR (%) By Regions (2018-2030)
Table 10 Global Fixed Tilt Solar PV Revenue (USD Million) By Type (2018-2022)
Table 11 Global Fixed Tilt Solar PV Revenue Market Share (%) By Type (2018-2022)
Table 12 Global Fixed Tilt Solar PV Revenue (USD Million) By Applications (2018-2022)
Table 13 Global Fixed Tilt Solar PV Revenue Market Share (%) By Applications (2018-2022)
Table 14 Global Fixed Tilt Solar PV Market Revenue (USD Million) By Regions (2018-2022)
Table 15 Global Fixed Tilt Solar PV Market Share (%) By Regions (2018-2022)
Table 16 North America Fixed Tilt Solar PV Revenue (USD Million) By Country (2018-2022)
Table 17 North America Fixed Tilt Solar PV Revenue (USD Million) By Type (2018-2022)
Table 18 North America Fixed Tilt Solar PV Revenue (USD Million) By Applications (2018-2022)
Table 19 Europe Fixed Tilt Solar PV Revenue (USD Million) By Country (2018-2022)
Table 20 Europe Fixed Tilt Solar PV Revenue (USD Million) By Type (2018-2022)
Table 21 Europe Fixed Tilt Solar PV Revenue (USD Million) By Applications (2018-2022)
Table 22 Asia Pacific Fixed Tilt Solar PV Revenue (USD Million) By Country (2018-2022)
Table 23 Asia Pacific Fixed Tilt Solar PV Revenue (USD Million) By Type (2018-2022)
Table 24 Asia Pacific Fixed Tilt Solar PV Revenue (USD Million) By Applications (2018-2022)
Table 25 South America Fixed Tilt Solar PV Revenue (USD Million) By Country (2018-2022)
Table 26 South America Fixed Tilt Solar PV Revenue (USD Million) By Type (2018-2022)
Table 27 South America Fixed Tilt Solar PV Revenue (USD Million) By Applications (2018-2022)
Table 28 Middle East and Africa Fixed Tilt Solar PV Revenue (USD Million) By Region (2018-2022)
Table 29 Middle East and Africa Fixed Tilt Solar PV Revenue (USD Million) By Type (2018-2022)
Table 30 Middle East and Africa Fixed Tilt Solar PV Revenue (USD Million) By Applications (2018-2022)
Table 31 Financial Analysis
Table 32 Global Fixed Tilt Solar PV Revenue (USD Million) By Type (2023-2030)
Table 33 Global Fixed Tilt Solar PV Revenue Market Share (%) By Type (2023-2030)
Table 34 Global Fixed Tilt Solar PV Revenue (USD Million) By Applications (2023-2030)
Table 35 Global Fixed Tilt Solar PV Revenue Market Share (%) By Applications (2023-2030)
Table 36 Global Fixed Tilt Solar PV Market Revenue (USD Million), And Revenue (USD Million) By Regions (2023-2030)
Table 37 North America Fixed Tilt Solar PV Revenue (USD)By Country (2023-2030)
Table 38 North America Fixed Tilt Solar PV Revenue (USD Million) By Type (2023-2030)
Table 39 North America Fixed Tilt Solar PV Revenue (USD Million) By Applications (2023-2030)
Table 40 Europe Fixed Tilt Solar PV Revenue (USD Million) By Country (2023-2030)
Table 41 Europe Fixed Tilt Solar PV Revenue (USD Million) By Type (2023-2030)
Table 42 Europe Fixed Tilt Solar PV Revenue (USD Million) By Applications (2023-2030)
Table 43 Asia Pacific Fixed Tilt Solar PV Revenue (USD Million) By Country (2023-2030)
Table 44 Asia Pacific Fixed Tilt Solar PV Revenue (USD Million) By Type (2023-2030)
Table 45 Asia Pacific Fixed Tilt Solar PV Revenue (USD Million) By Applications (2023-2030)
Table 46 South America Fixed Tilt Solar PV Revenue (USD Million) By Country (2023-2030)
Table 47 South America Fixed Tilt Solar PV Revenue (USD Million) By Type (2023-2030)
Table 48 South America Fixed Tilt Solar PV Revenue (USD Million) By Applications (2023-2030)
Table 49 Middle East and Africa Fixed Tilt Solar PV Revenue (USD Million) By Region (2023-2030)
Table 50 Middle East and Africa Fixed Tilt Solar PV Revenue (USD Million) By Region (2023-2030)
Table 51 Middle East and Africa Fixed Tilt Solar PV Revenue (USD Million) By Type (2023-2030)
Table 52 Middle East and Africa Fixed Tilt Solar PV Revenue (USD Million) By Applications (2023-2030)
Table 53 Research Programs/Design for This Report
Table 54 Key Data Information from Secondary Sources
Table 55 Key Data Information from Primary Sources
List of Figures
Figure 1 Market Scope
Figure 2 Porter’s Five Forces
Figure 3 Global Fixed Tilt Solar PV Revenue (USD Million) By Type (2018-2022)
Figure 4 Global Fixed Tilt Solar PV Revenue Market Share (%) By Type (2022)
Figure 5 Global Fixed Tilt Solar PV Revenue (USD Million) By Applications (2018-2022)
Figure 6 Global Fixed Tilt Solar PV Revenue Market Share (%) By Applications (2022)
Figure 7 Global Fixed Tilt Solar PV Market Revenue (USD Million) By Regions (2018-2022)
Figure 8 Global Fixed Tilt Solar PV Market Share (%) By Regions (2022)
Figure 9 North America Fixed Tilt Solar PV Revenue (USD Million) By Country (2018-2022)
Figure 10 North America Fixed Tilt Solar PV Revenue (USD Million) By Type (2018-2022)
Figure 11 North America Fixed Tilt Solar PV Revenue (USD Million) By Applications (2018-2022)
Figure 12 Europe Fixed Tilt Solar PV Revenue (USD Million) By Country (2018-2022)
Figure 13 Europe Fixed Tilt Solar PV Revenue (USD Million) By Type (2018-2022)
Figure 14 Europe Fixed Tilt Solar PV Revenue (USD Million) By Applications (2018-2022)
Figure 15 Asia Pacific Fixed Tilt Solar PV Revenue (USD Million) By Country (2018-2022)
Figure 16 Asia Pacific Fixed Tilt Solar PV Revenue (USD Million) By Type (2018-2022)
Figure 17 Asia Pacific Fixed Tilt Solar PV Revenue (USD Million) By Applications (2018-2022)
Figure 18 South America Fixed Tilt Solar PV Revenue (USD Million) By Country (2018-2022)
Figure 19 South America Fixed Tilt Solar PV Revenue (USD Million) By Type (2018-2022)
Figure 20 South America Fixed Tilt Solar PV Revenue (USD Million) By Applications (2018-2022)
Figure 21 Middle East and Africa Fixed Tilt Solar PV Revenue (USD Million) By Region (2018-2022)
Figure 22 Middle East and Africa Fixed Tilt Solar PV Revenue (USD Million) By Type (2018-2022)
Figure 23 Middle East and Africa Fixed Tilt Solar PV Revenue (USD Million) By Applications (2018-2022)
Figure 24 Global Fixed Tilt Solar PV Revenue (USD Million) By Type (2023-2030)
Figure 25 Global Fixed Tilt Solar PV Revenue Market Share (%) By Type (2030)
Figure 26 Global Fixed Tilt Solar PV Revenue (USD Million) By Applications (2023-2030)
Figure 27 Global Fixed Tilt Solar PV Revenue Market Share (%) By Applications (2030)
Figure 28 Global Fixed Tilt Solar PV Market Revenue (USD Million) By Regions (2023-2030)
Figure 29 North America Fixed Tilt Solar PV Revenue (USD Million) By Country (2023-2030)
Figure 30 North America Fixed Tilt Solar PV Revenue (USD Million) By Type (2023-2030)
Figure 31 North America Fixed Tilt Solar PV Revenue (USD Million) By Applications (2023-2030)
Figure 32 Europe Fixed Tilt Solar PV Revenue (USD Million) By Country (2023-2030)
Figure 33 Europe Fixed Tilt Solar PV Revenue (USD Million) By Type (2023-2030)
Figure 34 Europe Fixed Tilt Solar PV Revenue (USD Million) By Applications (2023-2030)
Figure 35 Asia Pacific Fixed Tilt Solar PV Revenue (USD Million) By Country (2023-2030)
Figure 36 Asia Pacific Fixed Tilt Solar PV Revenue (USD Million) By Type (2023-2030)
Figure 37 Asia Pacific Fixed Tilt Solar PV Revenue (USD Million) By Applications (2023-2030)
Figure 38 South America Fixed Tilt Solar PV Revenue (USD Million) By Country (2023-2030)
Figure 39 South America Fixed Tilt Solar PV Revenue (USD Million) By Type (2023-2030)
Figure 40 South America Fixed Tilt Solar PV Revenue (USD Million) By Applications (2023-2030)
Figure 41 Middle East and Africa Fixed Tilt Solar PV Revenue (USD Million) By Region (2023-2030)
Figure 42 Middle East and Africa Fixed Tilt Solar PV Revenue (USD Million) By Region (2023-2030)
Figure 43 Middle East and Africa Fixed Tilt Solar PV Revenue (USD Million) By Type (2023-2030)
Figure 44 Middle East and Africa Fixed Tilt Solar PV Revenue (USD Million) By Applications (2023-2030)
Figure 45 Bottom-Up and Top-Down Approaches for This Report
Figure 46 Data Triangulation
