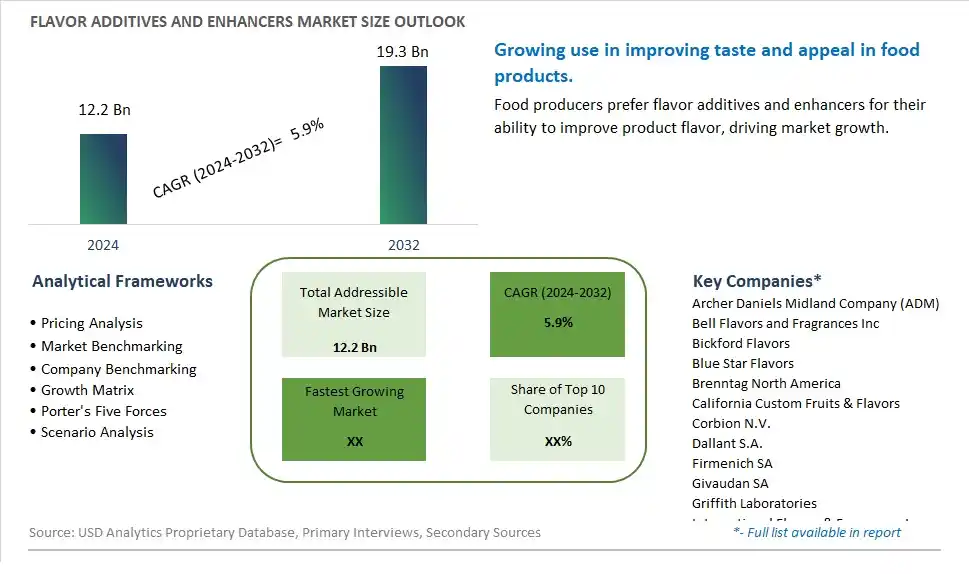
Global Flavor Additives and Enhancers Market Size is valued at $12.2 Billion in 2024 and is forecast to register a growth rate (CAGR) of 5.9% to reach $19.3 Billion by 2032.
The global Flavor Additives and Enhancers Market Comprehensive Study analyzes and forecasts the market size across 6 regions and 24 countries for diverse segments -By Type (Flavor Additives, Flavor Enhancers), By Application (Food, Household, Others)
An Introduction to Flavor Additives and Enhancers Market
In 2024, the Flavor Additives and Enhancers market is experiencing significant growth, driven by the increasing demand for enhanced taste and aroma in food and beverages. Flavor additives and enhancers, used to improve the sensory properties of products, are essential in the food, beverage, and pharmaceutical industries. The market benefits from advancements in flavor formulation and delivery technologies, the growing trend of convenience and processed foods, and the expansion of the global food and beverage sector. Additionally, the rising focus on natural and clean label flavor solutions is contributing to market growth.
Flavor Additives and Enhancers Competitive Landscape
The market report analyses the leading companies in the industry including Archer Daniels Midland Company (ADM), Bell Flavors and Fragrances Inc, Bickford Flavors, Blue Star Flavors, Brenntag North America, California Custom Fruits & Flavors, Corbion N.V., Dallant S.A., Firmenich SA, Givaudan SA, Griffith Laboratories, International Flavors & Fragrances Inc (IFF), Kerry Group Plc, Kikkoman Sales USA, Koninklijke DSM N.V., Prinova, Senomyx, Sensient Technologies Corp, Symrise AG, WILD Flavors, and Others.
Flavor Additives and Enhancers Market Dynamics
Flavor Additives and Enhancers Market Trend: Rising Demand for Natural and Clean Label Flavor Additives
The flavor additives and enhancers market is experiencing a significant trend towards the rising demand for natural and clean label flavor additives. Consumers are increasingly scrutinizing food labels and seeking products free from artificial ingredients, preservatives, and synthetic additives. This trend is driven by a growing awareness of the health impacts of artificial substances and a broader movement towards clean eating. Manufacturers are responding by developing flavor additives derived from natural sources such as herbs, spices, fruits, and vegetables, which not only enhance taste but also align with consumers' desire for transparency and healthier food options.
Flavor Additives and Enhancers Market Driver: Increasing Popularity of Convenience Foods
The increasing popularity of convenience foods is a major driver for the flavor additives and enhancers market. As busy lifestyles continue to dominate, consumers are relying more on ready-to-eat meals, snacks, and beverages that provide quick and easy meal solutions. These convenience foods often require flavor enhancement to meet consumer expectations for taste and quality. Flavor additives and enhancers play a crucial role in improving the palatability of these products, making them more appealing and satisfying. This driver is further supported by the expanding global food service industry, which demands consistent and high-quality flavors in its offerings.
Flavor Additives and Enhancers Market Opportunity: Innovation in Health-Boosting Flavor Enhancers
There is a significant opportunity for growth in the flavor additives and enhancers market through innovation in health-boosting flavor enhancers. Companies can capitalize on this opportunity by developing flavor enhancers that not only improve taste but also offer additional health benefits. This includes additives enriched with vitamins, minerals, and antioxidants, or those that support specific health goals such as gut health or immune support. By integrating functional ingredients into flavor enhancers, manufacturers can cater to the growing consumer demand for foods that contribute to overall wellness. Marketing these innovative products as part of a healthy lifestyle can attract health-conscious consumers and drive market expansion.
Flavor Additives and Enhancers Market Share Analysis: Flavor Additives segment generated the highest revenue share in the industry
Flavor Additives is the largest segment in the Flavor Additives and Enhancers Market by Type. This segment's dominance is driven by the extensive use of flavor additives across a wide range of food and beverage products. Flavor additives are used to enhance or modify the taste and aroma of food, making them more appealing to consumers. They play a crucial role in the food industry, helping manufacturers create diverse and appealing products that cater to different tastes and preferences. From baked goods and confectionery to savory snacks and beverages, flavor additives are integral in developing new products and improving existing ones. The demand for natural and artificial flavor additives continues to rise as consumers seek more variety and better-tasting food options. Additionally, the increasing trend towards clean label products has led to the development of natural flavor additives, further boosting the growth of this segment.
Flavor Additives and Enhancers Market Share Analysis: Food is the fastest growing segment over the forecast period to 2032
The Food segment is projected to be the fastest-growing application in the Flavor Additives and Enhancers Market by 2032. The rapid growth of this segment is driven by the increasing consumer demand for flavorful and diverse food options. As the global population continues to grow and urbanize, there is a rising need for convenient, ready-to-eat, and processed food products that do not compromise on taste. Flavor additives and enhancers are essential in meeting this demand, as they help maintain and improve the taste, aroma, and overall sensory experience of food products. The food industry's constant innovation and development of new products, including plant-based and health-focused options, further drive the need for effective flavor solutions. Further, the increasing popularity of international cuisines and the growing interest in gourmet and exotic flavors are contributing to the expansion of the flavor additives and enhancers market within the food sector. As consumers continue to seek out unique and enjoyable food experiences, the food segment is expected to see significant growth, making it the fastest-growing application in the market.
Flavor Additives and Enhancers Market Segmentation
By Type
Flavor Additives
Flavor Enhancers
By Application
Food
Household
Others
Countries Analyzed
North America (US, Canada, Mexico)
Europe (Germany, UK, France, Spain, Italy, Russia, Rest of Europe)
Asia Pacific (China, India, Japan, South Korea, Australia, South East Asia, Rest of Asia)
South America (Brazil, Argentina, Rest of South America)
Middle East and Africa (Saudi Arabia, UAE, Rest of Middle East, South Africa, Egypt, Rest of Africa)
Flavor Additives and Enhancers Companies Profiled in the Study
Archer Daniels Midland Company (ADM)
Bell Flavors and Fragrances Inc
Bickford Flavors
Blue Star Flavors
Brenntag North America
California Custom Fruits & Flavors
Corbion N.V.
Dallant S.A.
Firmenich SA
Givaudan SA
Griffith Laboratories
International Flavors & Fragrances Inc (IFF)
Kerry Group Plc
Kikkoman Sales USA
Koninklijke DSM N.V.
Prinova
Senomyx
Sensient Technologies Corp
Symrise AG
WILD Flavors
*- List Not Exhaustive
Chapter 1. TABLE OF CONTENTS
Chapter 2. Introduction to Flavor Additives and Enhancers Market
2.1. Market Overview
2.2. Key Statistics and Report Highlights
2.3. Scope of the Comprehensive Study
2.3.1. Market Definition
2.3.2 Countries and Regions Covered
2.3.3 Research Objective
2.3.4 Units, Currency, and Conversions
2.3.5 Industry Value Chain
2.4. Key Market Segments
2.5. Key Companies
2.6. Study Period
Chapter 3. Strategic Analysis Review
3.1. Flavor Additives and Enhancers Pricing Analysis and Forecast
3.2. Porter’s Five Forces
3.3. Market Ecosystem
3.4. SWOT Analysis
3.5. Regulatory Scenario
3.3. Effects of Inflation, Russia-Ukraine War, moderating economic growth, and other macroeconomic factors
Chapter 4. Competitive Landscape
4.1. Market Share Analysis
4.1.1. Global Flavor Additives and Enhancers Market Share by Company, 2023
4.1.2. Product Offerings of Leading Flavor Additives and Enhancers Companies
4.2. Market Entropy
4.2.1. New Product Launches in the Industry
4.2.2. Mergers, Acquisitions, Joint ventures, and Partnerships
4.3. Key Strategies and Best Practices
Chapter 5. Global Market Projections: Best, Reference, and Low Case Scenarios
5.1. Growth Analysis- Case Scenario Definitions
5.2. Low Growth Case Scenario Forecasts
5.3. Reference Growth Case Scenario Forecasts
5.4. High Growth Case Scenario Forecasts
Chapter 6. Market Dynamics
6.1. Flavor Additives and Enhancers Market Drivers
6.2. Flavor Additives and Enhancers Market Challenges
6.6. Flavor Additives and Enhancers Market Opportunities
6.4. Flavor Additives and Enhancers Market Trends
Chapter 7. Global Flavor Additives and Enhancers Market Outlook Trends
7.1. Global Flavor Additives and Enhancers Revenue (USD Million) and CAGR (%) by Type (2021-2032)
7.2. Global Flavor Additives and Enhancers Revenue (USD Million) and CAGR (%) by Application (2021-2032)
7.3. Global Flavor Additives and Enhancers Revenue (USD Million) and CAGR (%) by Product (2021-2032)
By Type
Flavor Additives
Flavor Enhancers
By Application
Food
Household
Others
Chapter 8. Global Flavor Additives and Enhancers Regional Analysis and Outlook
8.1. Global Flavor Additives and Enhancers Revenue (USD Million) By Regions (2021- 2032)
8.2. North America Flavor Additives and Enhancers Revenue (USD Million) by Country (2021-2032)
8.2.1. United States Flavor Additives and Enhancers Regional Analysis and Outlook
8.2.2. Canada Flavor Additives and Enhancers Regional Analysis and Outlook
8.2.3. Mexico Flavor Additives and Enhancers Regional Analysis and Outlook
8.3. Europe Flavor Additives and Enhancers Revenue (USD Million), by Country (2021-2032)
8.3.1. Germany Flavor Additives and Enhancers Regional Analysis and Outlook
8.3.2. France Flavor Additives and Enhancers Regional Analysis and Outlook
8.3.3. United Kingdom Flavor Additives and Enhancers Regional Analysis and Outlook
8.3.4. Spain Flavor Additives and Enhancers Regional Analysis and Outlook
8.3.5. Italy Flavor Additives and Enhancers Regional Analysis and Outlook
8.3.6. Russia Flavor Additives and Enhancers Regional Analysis and Outlook
8.3.7. Rest of Europe Flavor Additives and Enhancers Regional Analysis and Outlook
8.4. Asia Pacific Flavor Additives and Enhancers Revenue (USD Million) by Country (2021-2032)
8.4.1. China Flavor Additives and Enhancers Regional Analysis and Outlook
8.4.2. Japan Flavor Additives and Enhancers Regional Analysis and Outlook
8.4.3. India Flavor Additives and Enhancers Regional Analysis and Outlook
8.4.4. South Korea Flavor Additives and Enhancers Regional Analysis and Outlook
8.4.5. Australia Flavor Additives and Enhancers Regional Analysis and Outlook
8.4.6. South East Asia Flavor Additives and Enhancers Regional Analysis and Outlook
8.4.7. Rest of Asia Pacific Flavor Additives and Enhancers Regional Analysis and Outlook
8.5. South America Flavor Additives and Enhancers Revenue (USD Million), by Country (2021-2032)
8.5.1. Brazil Flavor Additives and Enhancers Regional Analysis and Outlook
8.5.2. Argentina Flavor Additives and Enhancers Regional Analysis and Outlook
8.5.3. Rest of South America Flavor Additives and Enhancers Regional Analysis and Outlook
8.6. Middle East and Africa Flavor Additives and Enhancers Revenue (USD Million) by Country (2021-2032)
8.6.1. Middle East Flavor Additives and Enhancers Regional Analysis and Outlook
8.6.2. Africa Flavor Additives and Enhancers Regional Analysis and Outlook
Chapter 9. North America Flavor Additives and Enhancers Analysis and Outlook
9.1. North America Flavor Additives and Enhancers Revenue (USD Million) by Segments (2021-2032)
9.1.1. North America Flavor Additives and Enhancers Revenue (USD Million) by Type (2021-2032)
9.1.2. North America Flavor Additives and Enhancers Revenue (USD Million) by Application (2021-2032)
9.1.3. North America Flavor Additives and Enhancers Revenue (USD Million) by Product (2021-2032)
By Type
Flavor Additives
Flavor Enhancers
By Application
Food
Household
Others
Chapter 10. Europe Flavor Additives and Enhancers Analysis and Outlook
10.1. Europe Flavor Additives and Enhancers Revenue (USD Million), by Segments (USD Million) (2021-2032)
10.1.1. Europe Flavor Additives and Enhancers Revenue (USD Million) by Type (2021-2032)
10.1.2. Europe Flavor Additives and Enhancers Revenue (USD Million) by Application (2021-2032)
10.1.3. Europe Flavor Additives and Enhancers Revenue (USD Million) by Product (2021-2032)
By Type
Flavor Additives
Flavor Enhancers
By Application
Food
Household
Others
Chapter 11. Asia Pacific Flavor Additives and Enhancers Analysis and Outlook
11.1. Asia Pacific Flavor Additives and Enhancers Revenue (USD Million), and Revenue (USD Million) by Segments (2021-2032)
11.1.1. Asia Pacific Flavor Additives and Enhancers Revenue (USD Million) by Type (2021-2032)
11.1.2. Asia Pacific Flavor Additives and Enhancers Revenue (USD Million) by Application (2021-2032)
11.1.3. Asia Pacific Flavor Additives and Enhancers Revenue (USD Million) by Product (2021-2032)
By Type
Flavor Additives
Flavor Enhancers
By Application
Food
Household
Others
Chapter 12. South America Flavor Additives and Enhancers Analysis and Outlook
12.1. South America Flavor Additives and Enhancers Revenue (USD Million), by Segments (2021-2032)
12.1.1. South America Flavor Additives and Enhancers Revenue (USD Million) by Type (2021-2032)
12.1.2. South America Flavor Additives and Enhancers Revenue (USD Million) by Application (2021-2032)
12.1.3. South America Flavor Additives and Enhancers Revenue (USD Million) by Product (2021-2032)
By Type
Flavor Additives
Flavor Enhancers
By Application
Food
Household
Others
Chapter 13. Middle East and Africa Flavor Additives and Enhancers Analysis and Outlook
13.1. Middle East and Africa Flavor Additives and Enhancers Revenue (USD Million), by Segments (2021-2032)
13.1.1. Middle East and Africa Flavor Additives and Enhancers Revenue (USD Million) by Type (2021-2032)
13.1.2. Middle East and Africa Flavor Additives and Enhancers Revenue (USD Million) by Application (2021-2032)
13.1.3. Middle East and Africa Flavor Additives and Enhancers Revenue (USD Million) by Product (2021-2032)
By Type
Flavor Additives
Flavor Enhancers
By Application
Food
Household
Others
Chapter 14. Flavor Additives and Enhancers Company Profiles
14.1 Business Overview
14.2 Product Profiles
14.3 SWOT Profiles
14.5 Recent Developments
14.6 Financial Profile
List of Companies
Archer Daniels Midland Company (ADM)
Bell Flavors and Fragrances Inc
Bickford Flavors
Blue Star Flavors
Brenntag North America
California Custom Fruits & Flavors
Corbion N.V.
Dallant S.A.
Firmenich SA
Givaudan SA
Griffith Laboratories
International Flavors & Fragrances Inc (IFF)
Kerry Group Plc
Kikkoman Sales USA
Koninklijke DSM N.V.
Prinova
Senomyx
Sensient Technologies Corp
Symrise AG
WILD Flavors
15. Methodology and Data Sources
15.1 Customization Offerings
15.2 Subscription Services
15.3 Related Reports
15.4 Publisher Expertise
LIST OF TABLES
Table 1 Market Segmentation Analysis
Table 2 Global Flavor Additives and Enhancers Market Share of Leading Companies, 2023
Table 3 Product Offerings of Leading Companies
Table 4 Low Growth Scenario Forecasts
Table 5 Reference Case Growth Scenario
Table 6 High Growth Case Scenario
Table 7 Global Flavor Additives and Enhancers Revenue (USD Million) And CAGR (%) By Type (2021-2032)
Table 8 Global Flavor Additives and Enhancers Revenue (USD Million) And CAGR (%) By Application (2021-2032)
Table 9 Global Flavor Additives and Enhancers Revenue (USD Million) And CAGR (%) By Product (2021-2032)
Table 10 Global Flavor Additives and Enhancers Market Revenue (USD Million) By Regions (2021-2032)
Table 11 Global Flavor Additives and Enhancers Market Share (%) By Regions (2021-2032)
Table 12 North America Flavor Additives and Enhancers Revenue (USD Million) By Country (2021-2032)
Table 13 Europe Flavor Additives and Enhancers Revenue (USD Million) By Country (2021-2032)
Table 14 Asia Pacific Flavor Additives and Enhancers Revenue (USD Million) By Country (2021-2032)
Table 15 South America Flavor Additives and Enhancers Revenue (USD Million) By Country (2021-2032)
Table 16 Middle East and Africa Flavor Additives and Enhancers Revenue (USD Million) By Region (2021-2032)
Table 17 North America Flavor Additives and Enhancers Revenue (USD Million) By Type (2021-2032)
Table 18 North America Flavor Additives and Enhancers Revenue (USD Million) By Application (2021-2032)
Table 19 North America Flavor Additives and Enhancers Revenue (USD Million) By Product (2021-2032)
Table 20 Europe Flavor Additives and Enhancers Revenue (USD Million) By Type (2021-2032)
Table 21 Europe Flavor Additives and Enhancers Revenue (USD Million) By Application (2021-2032)
Table 22 Europe Flavor Additives and Enhancers Revenue (USD Million) By Product (2021-2032)
Table 23 Asia Pacific Flavor Additives and Enhancers Revenue (USD Million) By Type (2021-2032)
Table 24 Asia Pacific Flavor Additives and Enhancers Revenue (USD Million) By Application (2021-2032)
Table 25 Asia Pacific Flavor Additives and Enhancers Revenue (USD Million) By Product (2021-2032)
Table 26 South America Flavor Additives and Enhancers Revenue (USD Million) By Type (2021-2032)
Table 27 South America Flavor Additives and Enhancers Revenue (USD Million) By Application (2021-2032)
Table 28 South America Flavor Additives and Enhancers Revenue (USD Million) By Product (2021-2032)
Table 29 Middle East and Africa Flavor Additives and Enhancers Revenue (USD Million) By Type (2021-2032)
Table 30 Middle East and Africa Flavor Additives and Enhancers Revenue (USD Million) By Application (2021-2032)
Table 31 Middle East and Africa Flavor Additives and Enhancers Revenue (USD Million) By Product (2021-2032)
LIST OF FIGURES
Figure 1. Market Scope
Figure 2. Pricing Forecasts Per Unit, 2023- 2032
Figure 3. Porter’s Five Forces
Figure 4. Global Flavor Additives and Enhancers Market Revenue (USD Million) By Regions (2021-2032)
Figure 5. Global Flavor Additives and Enhancers Market Share (%) By Regions (2023)
Figure 6. North America Flavor Additives and Enhancers Revenue (USD Million) By Country (2021-2032)
Figure 7. United States Flavor Additives and Enhancers Revenue (USD Million) By Country (2021-2032)
Figure 8. Canada Flavor Additives and Enhancers Revenue (USD Million) By Country (2021-2032)
Figure 9. Mexico Flavor Additives and Enhancers Revenue (USD Million) By Country (2021-2032)
Figure 10. Europe Flavor Additives and Enhancers Revenue (USD Million) By Country (2021-2032)
Figure 11. Germany Flavor Additives and Enhancers Revenue (USD Million) By Country (2021-2032)
Figure 12. France Flavor Additives and Enhancers Revenue (USD Million) By Country (2021-2032)
Figure 13. United Kingdom Flavor Additives and Enhancers Revenue (USD Million) By Country (2021-2032)
Figure 14. Spain Flavor Additives and Enhancers Revenue (USD Million) By Country (2021-2032)
Figure 15. Italy Flavor Additives and Enhancers Revenue (USD Million) By Country (2021-2032)
Figure 16. Russia Flavor Additives and Enhancers Revenue (USD Million) By Country (2021-2032)
Figure 17. Rest of Europe Flavor Additives and Enhancers Revenue (USD Million) By Country (2021-2032)
Figure 11. Asia Pacific Flavor Additives and Enhancers Revenue (USD Million) By Country (2021-2032)
Figure 12. China Flavor Additives and Enhancers Revenue (USD Million) By Country (2021-2032)
Figure 13. Japan Flavor Additives and Enhancers Revenue (USD Million) By Country (2021-2032)
Figure 14. India Flavor Additives and Enhancers Revenue (USD Million) By Country (2021-2032)
Figure 15. South Korea Flavor Additives and Enhancers Revenue (USD Million) By Country (2021-2032)
Figure 16. Australia Flavor Additives and Enhancers Revenue (USD Million) By Country (2021-2032)
Figure 17. South East Asia Flavor Additives and Enhancers Revenue (USD Million) By Country (2021-2032)
Figure 18. South America Flavor Additives and Enhancers Revenue (USD Million) By Country (2021-2032)
Figure 19. Brazil Flavor Additives and Enhancers Revenue (USD Million) By Country (2021-2032)
Figure 20. Argentina Flavor Additives and Enhancers Revenue (USD Million) By Country (2021-2032)
Figure 21. Rest of Asia Pacific Flavor Additives and Enhancers Revenue (USD Million) By Country (2021-2032)
Figure 22. Middle East and Africa Flavor Additives and Enhancers Revenue (USD Million) By Region (2021-2032)
Figure 23. Saudi Arabia Flavor Additives and Enhancers Revenue (USD Million) By Region (2021-2032)
Figure 24. The UAE Flavor Additives and Enhancers Revenue (USD Million) By Region (2021-2032)
Figure 25. Rest of Middle East Flavor Additives and Enhancers Revenue (USD Million) By Region (2021-2032)
Figure 26. South Africa Flavor Additives and Enhancers Revenue (USD Million) By Region (2021-2032)
Figure 27. Africa Flavor Additives and Enhancers Revenue (USD Million) By Region (2021-2032)
Figure 28. North America Flavor Additives and Enhancers Revenue (USD Million) By Type (2021-2032)
Figure 29. North America Flavor Additives and Enhancers Revenue (USD Million) By Application (2021-2032)
Figure 30. North America Flavor Additives and Enhancers Revenue (USD Million) By Product (2021-2032)
Figure 31. Europe Flavor Additives and Enhancers Revenue (USD Million) By Type (2021-2032)
Figure 32. Europe Flavor Additives and Enhancers Revenue (USD Million) By Application (2021-2032)
Figure 33. Europe Flavor Additives and Enhancers Revenue (USD Million) By Product (2021-2032)
Figure 34. Asia Pacific Flavor Additives and Enhancers Revenue (USD Million) By Type (2021-2032)
Figure 35. Asia Pacific Flavor Additives and Enhancers Revenue (USD Million) By Application (2021-2032)
Figure 36. Asia Pacific Flavor Additives and Enhancers Revenue (USD Million) By Product (2021-2032)
Figure 37. South America Flavor Additives and Enhancers Revenue (USD Million) By Type (2021-2032)
Figure 38. South America Flavor Additives and Enhancers Revenue (USD Million) By Application (2021-2032)
Figure 39. South America Flavor Additives and Enhancers Revenue (USD Million) By Product (2021-2032)
Figure 40. Middle East and Africa Flavor Additives and Enhancers Revenue (USD Million) By Type (2021-2032)
Figure 41. Middle East and Africa Flavor Additives and Enhancers Revenue (USD Million) By Application (2021-2032)
Figure 42. Middle East and Africa Flavor Additives and Enhancers Revenue (USD Million) By Product (2021-2032)
By Type
Flavor Additives
Flavor Enhancers
By Application
Food
Household
Others
Countries Analyzed
North America (US, Canada, Mexico)
Europe (Germany, UK, France, Spain, Italy, Russia, Rest of Europe)
Asia Pacific (China, India, Japan, South Korea, Australia, South East Asia, Rest of Asia)
South America (Brazil, Argentina, Rest of South America)
Middle East and Africa (Saudi Arabia, UAE, Rest of Middle East, South Africa, Egypt, Rest of Africa)
