Global Flavor Carriers Market Size is valued at $242.1 Million in 2024 and is forecast to register a growth rate (CAGR) of 4.9% to reach $355 Million by 2032.
The global Flavor Carriers Market Comprehensive Study analyzes and forecasts the market size across 6 regions and 24 countries for diverse segments -By Type (Bitterness Suppressors, Flavor Carriers, Solvents, Fats, Starches, Sugars), By Application (Food, Beverages, Pharmaceuticals), By Form (Liquid, Solid), By Flavor (Natural, Artificial)
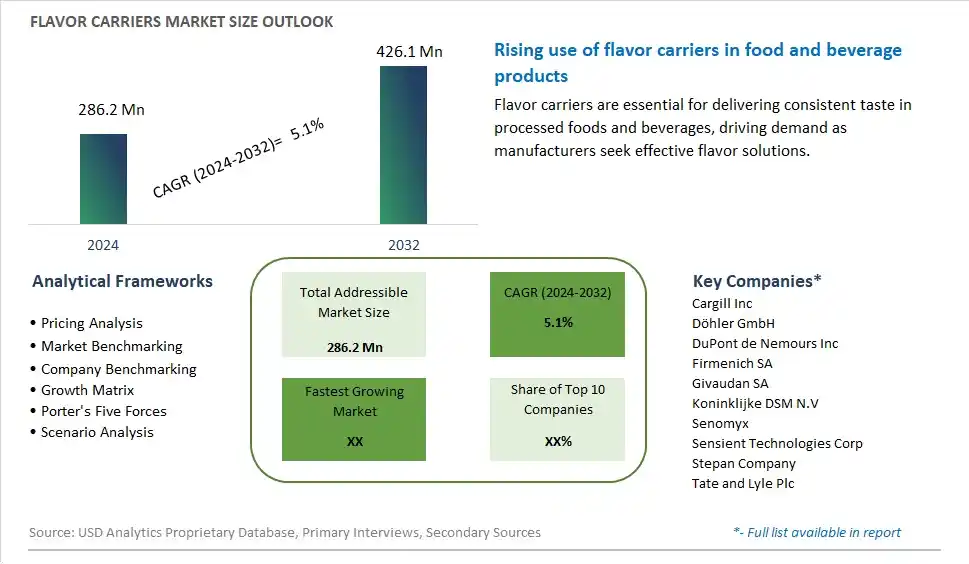
An Introduction to Flavor Carriers Market
The Flavor Carriers market in 2024 is thriving, fueled by the rising demand for effective delivery systems for flavor additives in various food and beverage applications. Flavor carriers, which help distribute and preserve flavors, are crucial for maintaining product consistency and quality. The market benefits from advancements in carrier technologies, the growing trend of clean label and natural ingredients, and the expansion of the functional food and beverage sectors. Additionally, the increasing focus on flavor innovation and product differentiation is driving market growth.
Flavor Carriers Competitive Landscape
The market report analyses the leading companies in the industry including Cargill, Incorporated, Döhler GmbH, Dow Inc, Firmenich SA, Givaudan SA, International Flavors & Fragrances Inc. (IFF), Kerry Group plc, Senomyx, Inc., Sensient Technologies Corporation, Symrise AG, and Others.
Flavor Carriers Market Dynamics
Flavor Carriers Market Trend: Increasing Use of Natural and Plant-Based Flavor Carriers
The flavor carriers market is experiencing a significant trend towards the increasing use of natural and plant-based flavor carriers. Consumers are becoming more health-conscious and environmentally aware, leading to a preference for clean-label products that use natural ingredients. This trend is driven by the demand for transparency in food processing and the avoidance of artificial additives. Manufacturers are responding by developing flavor carriers derived from natural sources such as plant extracts, essential oils, and natural gums. This not only meets consumer demand for healthier and more sustainable products but also enhances the appeal of end products in a competitive market.
Flavor Carriers Market Driver: Growing Demand for Processed and Convenience Foods
The growing demand for processed and convenience foods is a major driver for the flavor carriers market. As lifestyles become busier, consumers are increasingly turning to ready-to-eat meals, snacks, and beverages that offer convenience without compromising on taste. Flavor carriers play a crucial role in maintaining and enhancing the flavor profiles of these products during processing and storage. The expansion of the global food service industry and the rising popularity of packaged foods are further driving the demand for effective flavor carriers that ensure consistent and high-quality taste experiences across various food applications.
Flavor Carriers Market Opportunity: Innovation in Multifunctional Flavor Carriers
There is a significant opportunity for growth in the flavor carriers market through innovation in multifunctional flavor carriers. Companies can develop carriers that not only enhance flavor but also offer additional benefits such as improved shelf life, better nutrient delivery, and stability under various processing conditions. This includes the integration of functional ingredients like antioxidants, emulsifiers, and stabilizers into flavor carriers. By focusing on multifunctionality, manufacturers can create value-added products that cater to the evolving needs of food producers and consumers. This approach can drive market expansion by addressing the demand for innovative, high-performance ingredients in the food and beverage industry.
Flavor Carriers Market Share Analysis: Flavor Carriers segment generated the highest revenue share in the industry
Flavor Carriers are the largest segment in the Flavor Carriers Market by Type. Flavor carriers are essential components in the food and beverage industry, used to deliver and stabilize flavors in various products. These carriers ensure that flavors are evenly distributed and maintained throughout the shelf life of the product. They play a crucial role in enhancing the overall sensory experience of food and beverages by preserving the intensity and consistency of flavors. Common flavor carriers include maltodextrin, gum arabic, and other food-grade carriers that are compatible with a wide range of flavor compounds. The widespread use of flavor carriers across multiple applications, from processed foods and snacks to beverages and confectionery, underscores their importance in the industry. Their versatility and effectiveness in improving product quality make them the largest segment in the market.
Flavor Carriers Market Share Analysis: Beverages is the fastest growing segment over the forecast period to 2032
The Beverages segment is projected to be the fastest-growing application in the Flavor Carriers Market by 2032. The rapid growth of this segment is driven by the increasing demand for innovative and diverse beverage options that offer unique and enhanced flavor profiles. As consumers seek healthier and more flavorful drink choices, beverage manufacturers are continuously developing new products such as flavored waters, energy drinks, functional beverages, and plant-based drinks. Flavor carriers are crucial in these formulations as they help maintain the stability and consistency of flavors in various liquid matrices. Additionally, the trend towards natural and clean-label ingredients in beverages further drives the need for effective flavor carriers that can deliver natural flavors without compromising quality. The expanding global market for beverages, coupled with the continuous innovation in product development, is expected to propel the growth of the flavor carriers segment in this application. As a result, the beverages segment is set to experience significant growth, making it the fastest-growing application in the flavor carriers market.
Flavor Carriers Market Share Analysis: Solid segment generated the highest revenue share in the industry
In the Flavor Carriers Market, the largest segment by form is Solid. Solid flavor carriers play a pivotal role in the food and beverage industry by stabilizing and delivering flavors effectively across a wide range of applications. These carriers are preferred for their ease of handling, stability, and versatility in applications such as confectionery, snacks, bakery products, and dietary supplements. Solid carriers include substances like maltodextrin, starches, and sugars, which not only act as carriers but also contribute to texture and mouthfeel in finished products. Their ability to encapsulate and protect flavor compounds ensures consistent flavor release and enhances the overall sensory experience of food products.
Flavor Carriers Market Share Analysis: Natural Flavors is the fastest growing segment over the forecast period to 2032
The Natural Flavors segment is anticipated to be the fastest-growing in the Flavor Carriers Market by 2032. As consumer preferences shift towards healthier and cleaner-label products, there is a growing demand for natural flavors derived from botanical sources such as fruits, vegetables, herbs, and spices. Natural flavors are perceived as more authentic and are preferred by consumers looking to avoid synthetic additives. Solid flavor carriers are particularly instrumental in natural flavor applications, as they help maintain the integrity and potency of these delicate natural extracts throughout processing and storage. With increasing regulations favoring natural ingredients and the rise of clean-label trends globally, the market for natural flavors supported by solid carriers is poised for significant growth in the coming years. This growth underscores the importance of solid carriers in meeting the demand for natural, flavorful, and wholesome food and beverage products.
Flavor Carriers Market Segmentation
By Type
Bitterness Suppressors
Flavor Carriers
Solvents
Fats
Starches
Sugars
By Application
Food
Beverages
Pharmaceuticals
By Form
Liquid
Solid
By Flavor
Natural
Artificial
Countries Analyzed
North America (US, Canada, Mexico)
Europe (Germany, UK, France, Spain, Italy, Russia, Rest of Europe)
Asia Pacific (China, India, Japan, South Korea, Australia, South East Asia, Rest of Asia)
South America (Brazil, Argentina, Rest of South America)
Middle East and Africa (Saudi Arabia, UAE, Rest of Middle East, South Africa, Egypt, Rest of Africa)
Flavor Carriers Companies Profiled in the Study
Cargill, Incorporated
Döhler GmbH
Dow Inc
Firmenich SA
Givaudan SA
International Flavors & Fragrances Inc. (IFF)
Kerry Group plc
Senomyx, Inc.
Sensient Technologies Corporation
Symrise AG
*- List Not Exhaustive
Chapter 1. TABLE OF CONTENTS
Chapter 2. Introduction to Flavor Carriers Market
2.1. Market Overview
2.2. Key Statistics and Report Highlights
2.3. Scope of the Comprehensive Study
2.3.1. Market Definition
2.3.2 Countries and Regions Covered
2.3.3 Research Objective
2.3.4 Units, Currency, and Conversions
2.3.5 Industry Value Chain
2.4. Key Market Segments
2.5. Key Companies
2.6. Study Period
Chapter 3. Strategic Analysis Review
3.1. Flavor Carriers Pricing Analysis and Forecast
3.2. Porter’s Five Forces
3.3. Market Ecosystem
3.4. SWOT Analysis
3.5. Regulatory Scenario
3.3. Effects of Inflation, Russia-Ukraine War, moderating economic growth, and other macroeconomic factors
Chapter 4. Competitive Landscape
4.1. Market Share Analysis
4.1.1. Global Flavor Carriers Market Share by Company, 2023
4.1.2. Product Offerings of Leading Flavor Carriers Companies
4.2. Market Entropy
4.2.1. New Product Launches in the Industry
4.2.2. Mergers, Acquisitions, Joint ventures, and Partnerships
4.3. Key Strategies and Best Practices
Chapter 5. Global Market Projections: Best, Reference, and Low Case Scenarios
5.1. Growth Analysis- Case Scenario Definitions
5.2. Low Growth Case Scenario Forecasts
5.3. Reference Growth Case Scenario Forecasts
5.4. High Growth Case Scenario Forecasts
Chapter 6. Market Dynamics
6.1. Flavor Carriers Market Drivers
6.2. Flavor Carriers Market Challenges
6.6. Flavor Carriers Market Opportunities
6.4. Flavor Carriers Market Trends
Chapter 7. Global Flavor Carriers Market Outlook Trends
7.1. Global Flavor Carriers Revenue (USD Million) and CAGR (%) by Type (2021-2032)
7.2. Global Flavor Carriers Revenue (USD Million) and CAGR (%) by Application (2021-2032)
7.3. Global Flavor Carriers Revenue (USD Million) and CAGR (%) by Product (2021-2032)
By Type
Bitterness Suppressors
Flavor Carriers
Solvents
Fats
Starches
Sugars
By Application
Food
Beverages
Pharmaceuticals
By Form
Liquid
Solid
By Flavor
Natural
Artificial
Chapter 8. Global Flavor Carriers Regional Analysis and Outlook
8.1. Global Flavor Carriers Revenue (USD Million) By Regions (2021- 2032)
8.2. North America Flavor Carriers Revenue (USD Million) by Country (2021-2032)
8.2.1. United States Flavor Carriers Regional Analysis and Outlook
8.2.2. Canada Flavor Carriers Regional Analysis and Outlook
8.2.3. Mexico Flavor Carriers Regional Analysis and Outlook
8.3. Europe Flavor Carriers Revenue (USD Million), by Country (2021-2032)
8.3.1. Germany Flavor Carriers Regional Analysis and Outlook
8.3.2. France Flavor Carriers Regional Analysis and Outlook
8.3.3. United Kingdom Flavor Carriers Regional Analysis and Outlook
8.3.4. Spain Flavor Carriers Regional Analysis and Outlook
8.3.5. Italy Flavor Carriers Regional Analysis and Outlook
8.3.6. Russia Flavor Carriers Regional Analysis and Outlook
8.3.7. Rest of Europe Flavor Carriers Regional Analysis and Outlook
8.4. Asia Pacific Flavor Carriers Revenue (USD Million) by Country (2021-2032)
8.4.1. China Flavor Carriers Regional Analysis and Outlook
8.4.2. Japan Flavor Carriers Regional Analysis and Outlook
8.4.3. India Flavor Carriers Regional Analysis and Outlook
8.4.4. South Korea Flavor Carriers Regional Analysis and Outlook
8.4.5. Australia Flavor Carriers Regional Analysis and Outlook
8.4.6. South East Asia Flavor Carriers Regional Analysis and Outlook
8.4.7. Rest of Asia Pacific Flavor Carriers Regional Analysis and Outlook
8.5. South America Flavor Carriers Revenue (USD Million), by Country (2021-2032)
8.5.1. Brazil Flavor Carriers Regional Analysis and Outlook
8.5.2. Argentina Flavor Carriers Regional Analysis and Outlook
8.5.3. Rest of South America Flavor Carriers Regional Analysis and Outlook
8.6. Middle East and Africa Flavor Carriers Revenue (USD Million) by Country (2021-2032)
8.6.1. Middle East Flavor Carriers Regional Analysis and Outlook
8.6.2. Africa Flavor Carriers Regional Analysis and Outlook
Chapter 9. North America Flavor Carriers Analysis and Outlook
9.1. North America Flavor Carriers Revenue (USD Million) by Segments (2021-2032)
9.1.1. North America Flavor Carriers Revenue (USD Million) by Type (2021-2032)
9.1.2. North America Flavor Carriers Revenue (USD Million) by Application (2021-2032)
9.1.3. North America Flavor Carriers Revenue (USD Million) by Product (2021-2032)
By Type
Bitterness Suppressors
Flavor Carriers
Solvents
Fats
Starches
Sugars
By Application
Food
Beverages
Pharmaceuticals
By Form
Liquid
Solid
By Flavor
Natural
Artificial
Chapter 10. Europe Flavor Carriers Analysis and Outlook
10.1. Europe Flavor Carriers Revenue (USD Million), by Segments (USD Million) (2021-2032)
10.1.1. Europe Flavor Carriers Revenue (USD Million) by Type (2021-2032)
10.1.2. Europe Flavor Carriers Revenue (USD Million) by Application (2021-2032)
10.1.3. Europe Flavor Carriers Revenue (USD Million) by Product (2021-2032)
By Type
Bitterness Suppressors
Flavor Carriers
Solvents
Fats
Starches
Sugars
By Application
Food
Beverages
Pharmaceuticals
By Form
Liquid
Solid
By Flavor
Natural
Artificial
Chapter 11. Asia Pacific Flavor Carriers Analysis and Outlook
11.1. Asia Pacific Flavor Carriers Revenue (USD Million), and Revenue (USD Million) by Segments (2021-2032)
11.1.1. Asia Pacific Flavor Carriers Revenue (USD Million) by Type (2021-2032)
11.1.2. Asia Pacific Flavor Carriers Revenue (USD Million) by Application (2021-2032)
11.1.3. Asia Pacific Flavor Carriers Revenue (USD Million) by Product (2021-2032)
By Type
Bitterness Suppressors
Flavor Carriers
Solvents
Fats
Starches
Sugars
By Application
Food
Beverages
Pharmaceuticals
By Form
Liquid
Solid
By Flavor
Natural
Artificial
Chapter 12. South America Flavor Carriers Analysis and Outlook
12.1. South America Flavor Carriers Revenue (USD Million), by Segments (2021-2032)
12.1.1. South America Flavor Carriers Revenue (USD Million) by Type (2021-2032)
12.1.2. South America Flavor Carriers Revenue (USD Million) by Application (2021-2032)
12.1.3. South America Flavor Carriers Revenue (USD Million) by Product (2021-2032)
By Type
Bitterness Suppressors
Flavor Carriers
Solvents
Fats
Starches
Sugars
By Application
Food
Beverages
Pharmaceuticals
By Form
Liquid
Solid
By Flavor
Natural
Artificial
Chapter 13. Middle East and Africa Flavor Carriers Analysis and Outlook
13.1. Middle East and Africa Flavor Carriers Revenue (USD Million), by Segments (2021-2032)
13.1.1. Middle East and Africa Flavor Carriers Revenue (USD Million) by Type (2021-2032)
13.1.2. Middle East and Africa Flavor Carriers Revenue (USD Million) by Application (2021-2032)
13.1.3. Middle East and Africa Flavor Carriers Revenue (USD Million) by Product (2021-2032)
By Type
Bitterness Suppressors
Flavor Carriers
Solvents
Fats
Starches
Sugars
By Application
Food
Beverages
Pharmaceuticals
By Form
Liquid
Solid
By Flavor
Natural
Artificial
Chapter 14. Flavor Carriers Company Profiles
14.1 Business Overview
14.2 Product Profiles
14.3 SWOT Profiles
14.5 Recent Developments
14.6 Financial Profile
List of Companies
Cargill, Incorporated
Döhler GmbH
Dow Inc
Firmenich SA
Givaudan SA
International Flavors & Fragrances Inc. (IFF)
Kerry Group plc
Senomyx, Inc.
Sensient Technologies Corporation
Symrise AG
15. Methodology and Data Sources
15.1 Customization Offerings
15.2 Subscription Services
15.3 Related Reports
15.4 Publisher Expertise
LIST OF TABLES
Table 1 Market Segmentation Analysis
Table 2 Global Flavor Carriers Market Share of Leading Companies, 2023
Table 3 Product Offerings of Leading Companies
Table 4 Low Growth Scenario Forecasts
Table 5 Reference Case Growth Scenario
Table 6 High Growth Case Scenario
Table 7 Global Flavor Carriers Revenue (USD Million) And CAGR (%) By Type (2021-2032)
Table 8 Global Flavor Carriers Revenue (USD Million) And CAGR (%) By Application (2021-2032)
Table 9 Global Flavor Carriers Revenue (USD Million) And CAGR (%) By Product (2021-2032)
Table 10 Global Flavor Carriers Market Revenue (USD Million) By Regions (2021-2032)
Table 11 Global Flavor Carriers Market Share (%) By Regions (2021-2032)
Table 12 North America Flavor Carriers Revenue (USD Million) By Country (2021-2032)
Table 13 Europe Flavor Carriers Revenue (USD Million) By Country (2021-2032)
Table 14 Asia Pacific Flavor Carriers Revenue (USD Million) By Country (2021-2032)
Table 15 South America Flavor Carriers Revenue (USD Million) By Country (2021-2032)
Table 16 Middle East and Africa Flavor Carriers Revenue (USD Million) By Region (2021-2032)
Table 17 North America Flavor Carriers Revenue (USD Million) By Type (2021-2032)
Table 18 North America Flavor Carriers Revenue (USD Million) By Application (2021-2032)
Table 19 North America Flavor Carriers Revenue (USD Million) By Product (2021-2032)
Table 20 Europe Flavor Carriers Revenue (USD Million) By Type (2021-2032)
Table 21 Europe Flavor Carriers Revenue (USD Million) By Application (2021-2032)
Table 22 Europe Flavor Carriers Revenue (USD Million) By Product (2021-2032)
Table 23 Asia Pacific Flavor Carriers Revenue (USD Million) By Type (2021-2032)
Table 24 Asia Pacific Flavor Carriers Revenue (USD Million) By Application (2021-2032)
Table 25 Asia Pacific Flavor Carriers Revenue (USD Million) By Product (2021-2032)
Table 26 South America Flavor Carriers Revenue (USD Million) By Type (2021-2032)
Table 27 South America Flavor Carriers Revenue (USD Million) By Application (2021-2032)
Table 28 South America Flavor Carriers Revenue (USD Million) By Product (2021-2032)
Table 29 Middle East and Africa Flavor Carriers Revenue (USD Million) By Type (2021-2032)
Table 30 Middle East and Africa Flavor Carriers Revenue (USD Million) By Application (2021-2032)
Table 31 Middle East and Africa Flavor Carriers Revenue (USD Million) By Product (2021-2032)
LIST OF FIGURES
Figure 1. Market Scope
Figure 2. Pricing Forecasts Per Unit, 2023- 2032
Figure 3. Porter’s Five Forces
Figure 4. Global Flavor Carriers Market Revenue (USD Million) By Regions (2021-2032)
Figure 5. Global Flavor Carriers Market Share (%) By Regions (2023)
Figure 6. North America Flavor Carriers Revenue (USD Million) By Country (2021-2032)
Figure 7. United States Flavor Carriers Revenue (USD Million) By Country (2021-2032)
Figure 8. Canada Flavor Carriers Revenue (USD Million) By Country (2021-2032)
Figure 9. Mexico Flavor Carriers Revenue (USD Million) By Country (2021-2032)
Figure 10. Europe Flavor Carriers Revenue (USD Million) By Country (2021-2032)
Figure 11. Germany Flavor Carriers Revenue (USD Million) By Country (2021-2032)
Figure 12. France Flavor Carriers Revenue (USD Million) By Country (2021-2032)
Figure 13. United Kingdom Flavor Carriers Revenue (USD Million) By Country (2021-2032)
Figure 14. Spain Flavor Carriers Revenue (USD Million) By Country (2021-2032)
Figure 15. Italy Flavor Carriers Revenue (USD Million) By Country (2021-2032)
Figure 16. Russia Flavor Carriers Revenue (USD Million) By Country (2021-2032)
Figure 17. Rest of Europe Flavor Carriers Revenue (USD Million) By Country (2021-2032)
Figure 11. Asia Pacific Flavor Carriers Revenue (USD Million) By Country (2021-2032)
Figure 12. China Flavor Carriers Revenue (USD Million) By Country (2021-2032)
Figure 13. Japan Flavor Carriers Revenue (USD Million) By Country (2021-2032)
Figure 14. India Flavor Carriers Revenue (USD Million) By Country (2021-2032)
Figure 15. South Korea Flavor Carriers Revenue (USD Million) By Country (2021-2032)
Figure 16. Australia Flavor Carriers Revenue (USD Million) By Country (2021-2032)
Figure 17. South East Asia Flavor Carriers Revenue (USD Million) By Country (2021-2032)
Figure 18. South America Flavor Carriers Revenue (USD Million) By Country (2021-2032)
Figure 19. Brazil Flavor Carriers Revenue (USD Million) By Country (2021-2032)
Figure 20. Argentina Flavor Carriers Revenue (USD Million) By Country (2021-2032)
Figure 21. Rest of Asia Pacific Flavor Carriers Revenue (USD Million) By Country (2021-2032)
Figure 22. Middle East and Africa Flavor Carriers Revenue (USD Million) By Region (2021-2032)
Figure 23. Saudi Arabia Flavor Carriers Revenue (USD Million) By Region (2021-2032)
Figure 24. The UAE Flavor Carriers Revenue (USD Million) By Region (2021-2032)
Figure 25. Rest of Middle East Flavor Carriers Revenue (USD Million) By Region (2021-2032)
Figure 26. South Africa Flavor Carriers Revenue (USD Million) By Region (2021-2032)
Figure 27. Africa Flavor Carriers Revenue (USD Million) By Region (2021-2032)
Figure 28. North America Flavor Carriers Revenue (USD Million) By Type (2021-2032)
Figure 29. North America Flavor Carriers Revenue (USD Million) By Application (2021-2032)
Figure 30. North America Flavor Carriers Revenue (USD Million) By Product (2021-2032)
Figure 31. Europe Flavor Carriers Revenue (USD Million) By Type (2021-2032)
Figure 32. Europe Flavor Carriers Revenue (USD Million) By Application (2021-2032)
Figure 33. Europe Flavor Carriers Revenue (USD Million) By Product (2021-2032)
Figure 34. Asia Pacific Flavor Carriers Revenue (USD Million) By Type (2021-2032)
Figure 35. Asia Pacific Flavor Carriers Revenue (USD Million) By Application (2021-2032)
Figure 36. Asia Pacific Flavor Carriers Revenue (USD Million) By Product (2021-2032)
Figure 37. South America Flavor Carriers Revenue (USD Million) By Type (2021-2032)
Figure 38. South America Flavor Carriers Revenue (USD Million) By Application (2021-2032)
Figure 39. South America Flavor Carriers Revenue (USD Million) By Product (2021-2032)
Figure 40. Middle East and Africa Flavor Carriers Revenue (USD Million) By Type (2021-2032)
Figure 41. Middle East and Africa Flavor Carriers Revenue (USD Million) By Application (2021-2032)
Figure 42. Middle East and Africa Flavor Carriers Revenue (USD Million) By Product (2021-2032)
By Type
Bitterness Suppressors
Flavor Carriers
Solvents
Fats
Starches
Sugars
By Application
Food
Beverages
Pharmaceuticals
By Form
Liquid
Solid
By Flavor
Natural
Artificial
Countries Analyzed
North America (US, Canada, Mexico)
Europe (Germany, UK, France, Spain, Italy, Russia, Rest of Europe)
Asia Pacific (China, India, Japan, South Korea, Australia, South East Asia, Rest of Asia)
South America (Brazil, Argentina, Rest of South America)
Middle East and Africa (Saudi Arabia, UAE, Rest of Middle East, South Africa, Egypt, Rest of Africa)
