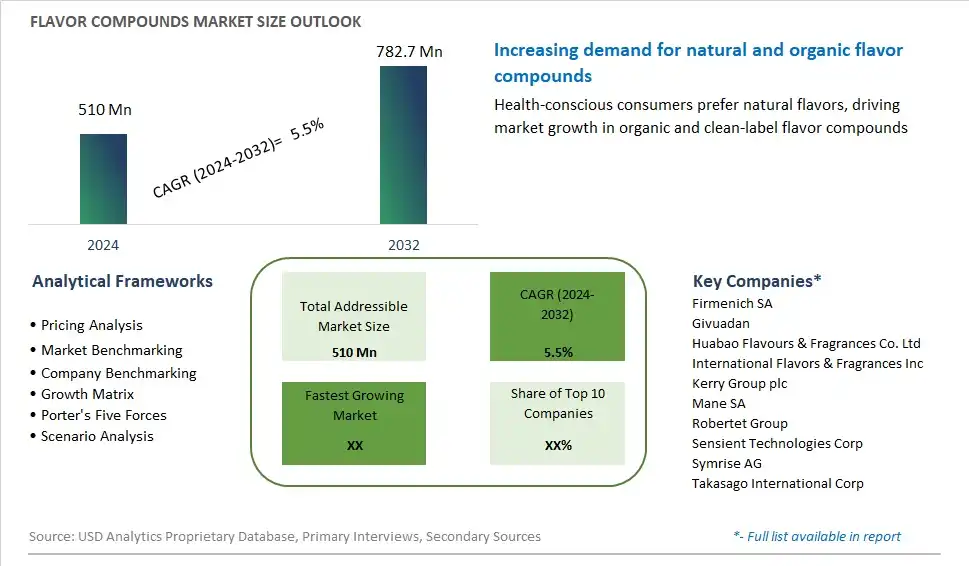
Global Flavor Compounds Market Size is valued at $510 Million in 2024 and is forecast to register a growth rate (CAGR) of 5.5% to reach $782.7 Million by 2032.
The global Flavor Compounds Market Comprehensive Study analyzes and forecasts the market size across 6 regions and 24 countries for diverse segments -By Flavor (Salty Flavor, Fruity Flavor, Savory Flavor, Spicy Flavor, Sweet Flavor, Others), By Application (Meat Alternatives, Plant-based Yogurts, Plant-based Beverages, Protein Bars & Snacks, Others)
An Introduction to Flavor Compounds Market
The flavor compounds market in 2024 is expanding, driven by the increasing demand for enhanced taste experiences in food and beverages. Flavor compounds, which include natural and synthetic flavors, are essential in creating the desired taste profiles for a wide range of products, from savory snacks and confectionery to beverages and dairy products. The market is characterized by innovations in flavor extraction and synthesis, enabling manufacturers to create more complex and authentic taste experiences. The growing trend towards clean label products is driving demand for natural flavor compounds, sourced from fruits, vegetables, herbs, and spices. Additionally, the rise of plant-based foods and beverages is spurring the development of new flavor compounds that mimic the taste and aroma of animal-based products. The flavor compounds market is poised for significant growth as consumers seek out novel and indulgent taste experiences.
Flavor Compounds Competitive Landscape
The market report analyses the leading companies in the industry including Firmenich SA, Givuadan, Huabao Flavours & Fragrances Co. Ltd, International Flavors & Fragrances Inc, Kerry Group plc, Mane SA, Robertet Group, Sensient Technologies Corp, Symrise AG, Takasago International Corp, and Others.
Flavor Compounds Market Dynamics
Flavor Compounds Market Trend: Growing Demand for Natural and Authentic Flavors
One of the most prominent trends in the flavor compounds market is the growing demand for natural and authentic flavors. As consumers become increasingly health-conscious and discerning about the ingredients in their food and beverages, there is a shift away from artificial flavors and towards natural alternatives. This trend is driven by factors such as the rising awareness of health and wellness, concerns about synthetic additives, and the desire for cleaner label products. Consumers seek flavors derived from real fruits, herbs, spices, and botanicals that offer authentic taste experiences and align with clean eating preferences. Additionally, there is a growing interest in ethnic and regional flavors that reflect diverse culinary traditions and cultural experiences. Manufacturers of flavor compounds are responding to this trend by developing natural extracts, essential oils, and flavor blends that capture the essence of fresh ingredients and deliver rich, complex flavors. By offering natural and authentic flavor solutions, companies can meet consumer demand for healthier and more wholesome products, driving growth in the flavor compounds market.
Market Driver: Innovation in Food and Beverage Industry
The primary driver of the flavor compounds market is the continuous innovation and evolution of the food and beverage industry. With changing consumer preferences, shifting market dynamics, and intense competition, food and beverage manufacturers are constantly seeking ways to differentiate their products and create unique sensory experiences. Flavor compounds play a crucial role in product development by enhancing taste, aroma, and mouthfeel, and creating memorable flavor profiles that resonate with consumers. This driver is fueled by factors such as the demand for novel and exotic flavors, the need to reformulate products to meet changing dietary trends, and the influence of culinary innovations and global cuisines on consumer expectations. Manufacturers of flavor compounds are leveraging advancements in food science, sensory technology, and ingredient sourcing to develop innovative flavor solutions that inspire creativity and drive product differentiation. By collaborating closely with food and beverage companies and anticipating market trends, flavor compound manufacturers can stay ahead of the curve and capitalize on opportunities for growth in the industry.
Market Opportunity: Expansion into Functional and Health-Enhancing Flavors
A significant opportunity for the flavor compounds market lies in the expansion into functional and health-enhancing flavors. With the growing emphasis on health and wellness, there is a rising demand for food and beverage products that not only taste good but also offer added nutritional benefits and functional properties. Flavor compounds can be formulated to incorporate health-promoting ingredients such as vitamins, antioxidants, probiotics, and botanical extracts, providing consumers with options that support their overall well-being. Additionally, there is an opportunity to develop flavors that address specific health concerns, such as stress relief, immune support, digestive health, and cognitive function. By innovating in functional and health-enhancing flavors, flavor compound manufacturers can meet the evolving needs of health-conscious consumers and tap into the growing market for functional foods and beverages. Moreover, by partnering with food and beverage companies to develop customized flavor solutions, manufacturers can create value-added products that stand out in the market and drive consumer loyalty.
Flavor Compounds Market Share Analysis: Sweet Flavor held the dominant market share in 2024
Within the Flavor Compounds Market, the sweet flavor segment is the largest, commanding a significant share of the industry. This dominance can be attributed to several factors, including widespread consumer preference for sweet-tasting foods and beverages, as well as the versatility of sweet flavor compounds in various applications. Sweet flavors are integral to a wide range of products, including confectionery, desserts, baked goods, beverages, and dairy products, among others. Further, the sensory appeal of sweetness plays a crucial role in consumer acceptance and enjoyment of food and beverage products. Additionally, the growing trend of indulgent treats and premium desserts, as well as the demand for healthier alternatives such as natural sweeteners and sugar substitutes, further drives the growth of the sweet flavor segment in the Flavor Compounds Market. As manufacturers continue to innovate and develop new formulations to meet evolving consumer preferences and regulatory requirements, the sweet flavor segment is expected to maintain its dominance, driving market growth and expansion in the industry.
Flavor Compounds Market Share Analysis: Plant-based Beverages market is poised to register the fastest growth rae over the forecast period to 2032
Among the applications in the Flavor Compounds Market, the plant-based beverages segment stands out as the fastest-growing, experiencing significant expansion in recent years. The robust growth outlook is driven by several factors, including shifting consumer preferences towards plant-based diets, increased awareness of environmental sustainability, and the rising demand for healthier beverage options. Plant-based beverages, such as almond milk, oat milk, and coconut water, have gained popularity as alternatives to traditional dairy products, appealing to consumers seeking lactose-free, vegan, and clean label options. Additionally, the incorporation of flavor compounds enhances the taste and sensory experience of plant-based beverages, mimicking the flavors of traditional dairy products while offering unique and innovative flavor profiles. Further, the growing market for functional beverages, including those fortified with vitamins, minerals, and protein, further drives the demand for flavored plant-based beverages. As consumers continue to prioritize health, sustainability, and flavor variety in their beverage choices, the plant-based beverages segment is expected to sustain its rapid growth trajectory, driving market expansion and innovation in the Flavor Compounds Market.
Flavor Compounds Market Segmentation
By Flavor
Salty Flavor
Fruity Flavor
Savory Flavor
Spicy Flavor
Sweet Flavor
Others
By Application
Meat Alternatives
Plant-based Yogurts
Plant-based Beverages
Protein Bars & Snacks
Others
Countries Analyzed
North America (US, Canada, Mexico)
Europe (Germany, UK, France, Spain, Italy, Russia, Rest of Europe)
Asia Pacific (China, India, Japan, South Korea, Australia, South East Asia, Rest of Asia)
South America (Brazil, Argentina, Rest of South America)
Middle East and Africa (Saudi Arabia, UAE, Rest of Middle East, South Africa, Egypt, Rest of Africa)
Flavor Compounds Companies Profiled in the Study
Firmenich SA
Givuadan
Huabao Flavours & Fragrances Co. Ltd
International Flavors & Fragrances Inc
Kerry Group plc
Mane SA
Robertet Group
Sensient Technologies Corp
Symrise AG
Takasago International Corp
*- List Not Exhaustive
Chapter 1. TABLE OF CONTENTS
Chapter 2. Introduction to Flavor Compounds Market
2.1. Market Overview
2.2. Key Statistics and Report Highlights
2.3. Scope of the Comprehensive Study
2.3.1. Market Definition
2.3.2 Countries and Regions Covered
2.3.3 Research Objective
2.3.4 Units, Currency, and Conversions
2.3.5 Industry Value Chain
2.4. Key Market Segments
2.5. Key Companies
2.6. Study Period
Chapter 3. Strategic Analysis Review
3.1. Flavor Compounds Pricing Analysis and Forecast
3.2. Porter’s Five Forces
3.3. Market Ecosystem
3.4. SWOT Analysis
3.5. Regulatory Scenario
3.3. Effects of Inflation, Russia-Ukraine War, moderating economic growth, and other macroeconomic factors
Chapter 4. Competitive Landscape
4.1. Market Share Analysis
4.1.1. Global Flavor Compounds Market Share by Company, 2023
4.1.2. Product Offerings of Leading Flavor Compounds Companies
4.2. Market Entropy
4.2.1. New Product Launches in the Industry
4.2.2. Mergers, Acquisitions, Joint ventures, and Partnerships
4.3. Key Strategies and Best Practices
Chapter 5. Global Market Projections: Best, Reference, and Low Case Scenarios
5.1. Growth Analysis- Case Scenario Definitions
5.2. Low Growth Case Scenario Forecasts
5.3. Reference Growth Case Scenario Forecasts
5.4. High Growth Case Scenario Forecasts
Chapter 6. Market Dynamics
6.1. Flavor Compounds Market Drivers
6.2. Flavor Compounds Market Challenges
6.6. Flavor Compounds Market Opportunities
6.4. Flavor Compounds Market Trends
Chapter 7. Global Flavor Compounds Market Outlook Trends
7.1. Global Flavor Compounds Revenue (USD Million) and CAGR (%) by Type (2021-2032)
7.2. Global Flavor Compounds Revenue (USD Million) and CAGR (%) by Application (2021-2032)
7.3. Global Flavor Compounds Revenue (USD Million) and CAGR (%) by Product (2021-2032)
By Flavor
Salty Flavor
Fruity Flavor
Savory Flavor
Spicy Flavor
Sweet Flavor
Others
By Application
Meat Alternatives
Plant-based Yogurts
Plant-based Beverages
Protein Bars & Snacks
Others
Chapter 8. Global Flavor Compounds Regional Analysis and Outlook
8.1. Global Flavor Compounds Revenue (USD Million) By Regions (2021- 2032)
8.2. North America Flavor Compounds Revenue (USD Million) by Country (2021-2032)
8.2.1. United States Flavor Compounds Regional Analysis and Outlook
8.2.2. Canada Flavor Compounds Regional Analysis and Outlook
8.2.3. Mexico Flavor Compounds Regional Analysis and Outlook
8.3. Europe Flavor Compounds Revenue (USD Million), by Country (2021-2032)
8.3.1. Germany Flavor Compounds Regional Analysis and Outlook
8.3.2. France Flavor Compounds Regional Analysis and Outlook
8.3.3. United Kingdom Flavor Compounds Regional Analysis and Outlook
8.3.4. Spain Flavor Compounds Regional Analysis and Outlook
8.3.5. Italy Flavor Compounds Regional Analysis and Outlook
8.3.6. Russia Flavor Compounds Regional Analysis and Outlook
8.3.7. Rest of Europe Flavor Compounds Regional Analysis and Outlook
8.4. Asia Pacific Flavor Compounds Revenue (USD Million) by Country (2021-2032)
8.4.1. China Flavor Compounds Regional Analysis and Outlook
8.4.2. Japan Flavor Compounds Regional Analysis and Outlook
8.4.3. India Flavor Compounds Regional Analysis and Outlook
8.4.4. South Korea Flavor Compounds Regional Analysis and Outlook
8.4.5. Australia Flavor Compounds Regional Analysis and Outlook
8.4.6. South East Asia Flavor Compounds Regional Analysis and Outlook
8.4.7. Rest of Asia Pacific Flavor Compounds Regional Analysis and Outlook
8.5. South America Flavor Compounds Revenue (USD Million), by Country (2021-2032)
8.5.1. Brazil Flavor Compounds Regional Analysis and Outlook
8.5.2. Argentina Flavor Compounds Regional Analysis and Outlook
8.5.3. Rest of South America Flavor Compounds Regional Analysis and Outlook
8.6. Middle East and Africa Flavor Compounds Revenue (USD Million) by Country (2021-2032)
8.6.1. Middle East Flavor Compounds Regional Analysis and Outlook
8.6.2. Africa Flavor Compounds Regional Analysis and Outlook
Chapter 9. North America Flavor Compounds Analysis and Outlook
9.1. North America Flavor Compounds Revenue (USD Million) by Segments (2021-2032)
9.1.1. North America Flavor Compounds Revenue (USD Million) by Type (2021-2032)
9.1.2. North America Flavor Compounds Revenue (USD Million) by Application (2021-2032)
9.1.3. North America Flavor Compounds Revenue (USD Million) by Product (2021-2032)
By Flavor
Salty Flavor
Fruity Flavor
Savory Flavor
Spicy Flavor
Sweet Flavor
Others
By Application
Meat Alternatives
Plant-based Yogurts
Plant-based Beverages
Protein Bars & Snacks
Others
Chapter 10. Europe Flavor Compounds Analysis and Outlook
10.1. Europe Flavor Compounds Revenue (USD Million), by Segments (USD Million) (2021-2032)
10.1.1. Europe Flavor Compounds Revenue (USD Million) by Type (2021-2032)
10.1.2. Europe Flavor Compounds Revenue (USD Million) by Application (2021-2032)
10.1.3. Europe Flavor Compounds Revenue (USD Million) by Product (2021-2032)
By Flavor
Salty Flavor
Fruity Flavor
Savory Flavor
Spicy Flavor
Sweet Flavor
Others
By Application
Meat Alternatives
Plant-based Yogurts
Plant-based Beverages
Protein Bars & Snacks
Others
Chapter 11. Asia Pacific Flavor Compounds Analysis and Outlook
11.1. Asia Pacific Flavor Compounds Revenue (USD Million), and Revenue (USD Million) by Segments (2021-2032)
11.1.1. Asia Pacific Flavor Compounds Revenue (USD Million) by Type (2021-2032)
11.1.2. Asia Pacific Flavor Compounds Revenue (USD Million) by Application (2021-2032)
11.1.3. Asia Pacific Flavor Compounds Revenue (USD Million) by Product (2021-2032)
By Flavor
Salty Flavor
Fruity Flavor
Savory Flavor
Spicy Flavor
Sweet Flavor
Others
By Application
Meat Alternatives
Plant-based Yogurts
Plant-based Beverages
Protein Bars & Snacks
Others
Chapter 12. South America Flavor Compounds Analysis and Outlook
12.1. South America Flavor Compounds Revenue (USD Million), by Segments (2021-2032)
12.1.1. South America Flavor Compounds Revenue (USD Million) by Type (2021-2032)
12.1.2. South America Flavor Compounds Revenue (USD Million) by Application (2021-2032)
12.1.3. South America Flavor Compounds Revenue (USD Million) by Product (2021-2032)
By Flavor
Salty Flavor
Fruity Flavor
Savory Flavor
Spicy Flavor
Sweet Flavor
Others
By Application
Meat Alternatives
Plant-based Yogurts
Plant-based Beverages
Protein Bars & Snacks
Others
Chapter 13. Middle East and Africa Flavor Compounds Analysis and Outlook
13.1. Middle East and Africa Flavor Compounds Revenue (USD Million), by Segments (2021-2032)
13.1.1. Middle East and Africa Flavor Compounds Revenue (USD Million) by Type (2021-2032)
13.1.2. Middle East and Africa Flavor Compounds Revenue (USD Million) by Application (2021-2032)
13.1.3. Middle East and Africa Flavor Compounds Revenue (USD Million) by Product (2021-2032)
By Flavor
Salty Flavor
Fruity Flavor
Savory Flavor
Spicy Flavor
Sweet Flavor
Others
By Application
Meat Alternatives
Plant-based Yogurts
Plant-based Beverages
Protein Bars & Snacks
Others
Chapter 14. Flavor Compounds Company Profiles
14.1 Business Overview
14.2 Product Profiles
14.3 SWOT Profiles
14.5 Recent Developments
14.6 Financial Profile
List of Companies
Firmenich SA
Givuadan
Huabao Flavours & Fragrances Co. Ltd
International Flavors & Fragrances Inc
Kerry Group plc
Mane SA
Robertet Group
Sensient Technologies Corp
Symrise AG
Takasago International Corp
15. Methodology and Data Sources
15.1 Customization Offerings
15.2 Subscription Services
15.3 Related Reports
15.4 Publisher Expertise
LIST OF TABLES
Table 1 Market Segmentation Analysis
Table 2 Global Flavor Compounds Market Share of Leading Companies, 2023
Table 3 Product Offerings of Leading Companies
Table 4 Low Growth Scenario Forecasts
Table 5 Reference Case Growth Scenario
Table 6 High Growth Case Scenario
Table 7 Global Flavor Compounds Revenue (USD Million) And CAGR (%) By Type (2021-2032)
Table 8 Global Flavor Compounds Revenue (USD Million) And CAGR (%) By Application (2021-2032)
Table 9 Global Flavor Compounds Revenue (USD Million) And CAGR (%) By Product (2021-2032)
Table 10 Global Flavor Compounds Market Revenue (USD Million) By Regions (2021-2032)
Table 11 Global Flavor Compounds Market Share (%) By Regions (2021-2032)
Table 12 North America Flavor Compounds Revenue (USD Million) By Country (2021-2032)
Table 13 Europe Flavor Compounds Revenue (USD Million) By Country (2021-2032)
Table 14 Asia Pacific Flavor Compounds Revenue (USD Million) By Country (2021-2032)
Table 15 South America Flavor Compounds Revenue (USD Million) By Country (2021-2032)
Table 16 Middle East and Africa Flavor Compounds Revenue (USD Million) By Region (2021-2032)
Table 17 North America Flavor Compounds Revenue (USD Million) By Type (2021-2032)
Table 18 North America Flavor Compounds Revenue (USD Million) By Application (2021-2032)
Table 19 North America Flavor Compounds Revenue (USD Million) By Product (2021-2032)
Table 20 Europe Flavor Compounds Revenue (USD Million) By Type (2021-2032)
Table 21 Europe Flavor Compounds Revenue (USD Million) By Application (2021-2032)
Table 22 Europe Flavor Compounds Revenue (USD Million) By Product (2021-2032)
Table 23 Asia Pacific Flavor Compounds Revenue (USD Million) By Type (2021-2032)
Table 24 Asia Pacific Flavor Compounds Revenue (USD Million) By Application (2021-2032)
Table 25 Asia Pacific Flavor Compounds Revenue (USD Million) By Product (2021-2032)
Table 26 South America Flavor Compounds Revenue (USD Million) By Type (2021-2032)
Table 27 South America Flavor Compounds Revenue (USD Million) By Application (2021-2032)
Table 28 South America Flavor Compounds Revenue (USD Million) By Product (2021-2032)
Table 29 Middle East and Africa Flavor Compounds Revenue (USD Million) By Type (2021-2032)
Table 30 Middle East and Africa Flavor Compounds Revenue (USD Million) By Application (2021-2032)
Table 31 Middle East and Africa Flavor Compounds Revenue (USD Million) By Product (2021-2032)
LIST OF FIGURES
Figure 1. Market Scope
Figure 2. Pricing Forecasts Per Unit, 2023- 2032
Figure 3. Porter’s Five Forces
Figure 4. Global Flavor Compounds Market Revenue (USD Million) By Regions (2021-2032)
Figure 5. Global Flavor Compounds Market Share (%) By Regions (2023)
Figure 6. North America Flavor Compounds Revenue (USD Million) By Country (2021-2032)
Figure 7. United States Flavor Compounds Revenue (USD Million) By Country (2021-2032)
Figure 8. Canada Flavor Compounds Revenue (USD Million) By Country (2021-2032)
Figure 9. Mexico Flavor Compounds Revenue (USD Million) By Country (2021-2032)
Figure 10. Europe Flavor Compounds Revenue (USD Million) By Country (2021-2032)
Figure 11. Germany Flavor Compounds Revenue (USD Million) By Country (2021-2032)
Figure 12. France Flavor Compounds Revenue (USD Million) By Country (2021-2032)
Figure 13. United Kingdom Flavor Compounds Revenue (USD Million) By Country (2021-2032)
Figure 14. Spain Flavor Compounds Revenue (USD Million) By Country (2021-2032)
Figure 15. Italy Flavor Compounds Revenue (USD Million) By Country (2021-2032)
Figure 16. Russia Flavor Compounds Revenue (USD Million) By Country (2021-2032)
Figure 17. Rest of Europe Flavor Compounds Revenue (USD Million) By Country (2021-2032)
Figure 11. Asia Pacific Flavor Compounds Revenue (USD Million) By Country (2021-2032)
Figure 12. China Flavor Compounds Revenue (USD Million) By Country (2021-2032)
Figure 13. Japan Flavor Compounds Revenue (USD Million) By Country (2021-2032)
Figure 14. India Flavor Compounds Revenue (USD Million) By Country (2021-2032)
Figure 15. South Korea Flavor Compounds Revenue (USD Million) By Country (2021-2032)
Figure 16. Australia Flavor Compounds Revenue (USD Million) By Country (2021-2032)
Figure 17. South East Asia Flavor Compounds Revenue (USD Million) By Country (2021-2032)
Figure 18. South America Flavor Compounds Revenue (USD Million) By Country (2021-2032)
Figure 19. Brazil Flavor Compounds Revenue (USD Million) By Country (2021-2032)
Figure 20. Argentina Flavor Compounds Revenue (USD Million) By Country (2021-2032)
Figure 21. Rest of Asia Pacific Flavor Compounds Revenue (USD Million) By Country (2021-2032)
Figure 22. Middle East and Africa Flavor Compounds Revenue (USD Million) By Region (2021-2032)
Figure 23. Saudi Arabia Flavor Compounds Revenue (USD Million) By Region (2021-2032)
Figure 24. The UAE Flavor Compounds Revenue (USD Million) By Region (2021-2032)
Figure 25. Rest of Middle East Flavor Compounds Revenue (USD Million) By Region (2021-2032)
Figure 26. South Africa Flavor Compounds Revenue (USD Million) By Region (2021-2032)
Figure 27. Africa Flavor Compounds Revenue (USD Million) By Region (2021-2032)
Figure 28. North America Flavor Compounds Revenue (USD Million) By Type (2021-2032)
Figure 29. North America Flavor Compounds Revenue (USD Million) By Application (2021-2032)
Figure 30. North America Flavor Compounds Revenue (USD Million) By Product (2021-2032)
Figure 31. Europe Flavor Compounds Revenue (USD Million) By Type (2021-2032)
Figure 32. Europe Flavor Compounds Revenue (USD Million) By Application (2021-2032)
Figure 33. Europe Flavor Compounds Revenue (USD Million) By Product (2021-2032)
Figure 34. Asia Pacific Flavor Compounds Revenue (USD Million) By Type (2021-2032)
Figure 35. Asia Pacific Flavor Compounds Revenue (USD Million) By Application (2021-2032)
Figure 36. Asia Pacific Flavor Compounds Revenue (USD Million) By Product (2021-2032)
Figure 37. South America Flavor Compounds Revenue (USD Million) By Type (2021-2032)
Figure 38. South America Flavor Compounds Revenue (USD Million) By Application (2021-2032)
Figure 39. South America Flavor Compounds Revenue (USD Million) By Product (2021-2032)
Figure 40. Middle East and Africa Flavor Compounds Revenue (USD Million) By Type (2021-2032)
Figure 41. Middle East and Africa Flavor Compounds Revenue (USD Million) By Application (2021-2032)
Figure 42. Middle East and Africa Flavor Compounds Revenue (USD Million) By Product (2021-2032)
By Flavor
Salty Flavor
Fruity Flavor
Savory Flavor
Spicy Flavor
Sweet Flavor
Others
By Application
Meat Alternatives
Plant-based Yogurts
Plant-based Beverages
Protein Bars & Snacks
Others
Countries Analyzed
North America (US, Canada, Mexico)
Europe (Germany, UK, France, Spain, Italy, Russia, Rest of Europe)
Asia Pacific (China, India, Japan, South Korea, Australia, South East Asia, Rest of Asia)
South America (Brazil, Argentina, Rest of South America)
Middle East and Africa (Saudi Arabia, UAE, Rest of Middle East, South Africa, Egypt, Rest of Africa)
