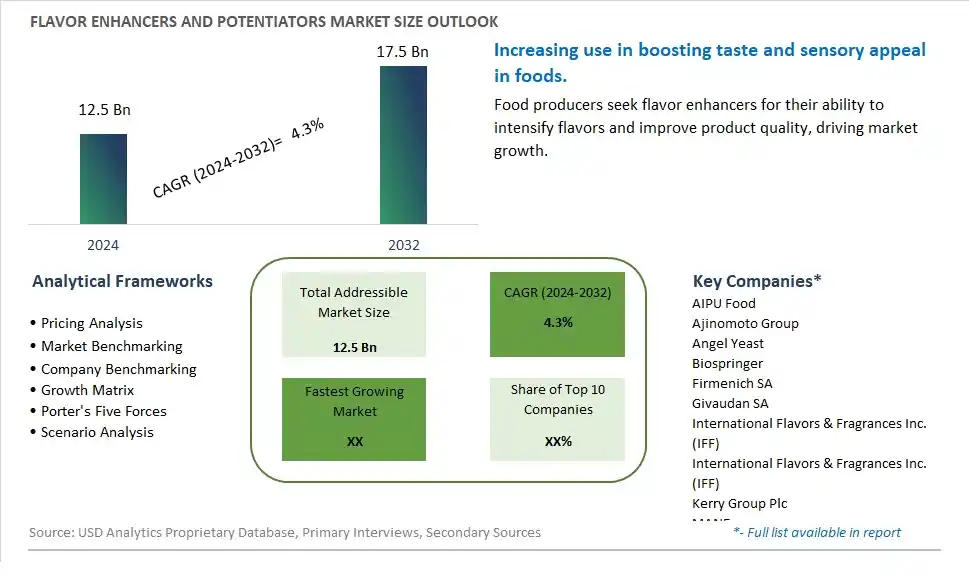
Global Flavor Enhancers and Potentiators Market Size is valued at $12.5 Billion in 2024 and is forecast to register a growth rate (CAGR) of 4.3% to reach $17.5 Billion by 2032.
The global Flavor Enhancers and Potentiators Market Comprehensive Study analyzes and forecasts the market size across 6 regions and 24 countries for diverse segments -By Type (Monosodium Glutamate (MSG), Hydrolyzed Vegetable Protein (HVP), Yeast Extract, Others), By Application (Beverages, Dairy Product, Confectionery, Bakery, Meat Products, Savory and Snacks, Frozen Products)
An Introduction to Flavor Enhancers and Potentiators Market
The Flavor Enhancers and Potentiators market in 2024 is thriving, fueled by the rising demand for improved taste and sensory experience in food products. Flavor enhancers and potentiators, such as monosodium glutamate (MSG), yeast extracts, and nucleotides, are used to amplify the existing flavors in food and beverages. The market benefits from advancements in flavor science, the growing trend of convenience and processed foods, and the expansion of the global food and beverage sector. Additionally, the increasing focus on clean label and natural flavor enhancers is contributing to market growth.
Flavor Enhancers and Potentiators Competitive Landscape
The market report analyses the leading companies in the industry including AIPU Food, Ajinomoto Group, Angel Yeast, Biospringer, Firmenich SA, Givaudan SA, International Flavors & Fragrances Inc. (IFF), International Flavors & Fragrances Inc. (IFF), Kerry Group Plc, MANE, Meihua, Ningxia Eppen Biotech Co. Ltd, Ohly, Robertet, Royal DSM N.V., Sensient Technologies Corp, Symrise AG, T. Hasegawa, Takasago International Corp, and Others.
Flavor Enhancers and Potentiators Market Dynamics
Flavor Enhancers and Potentiators Market Trend: Increasing Demand for Natural and Clean Label Flavor Enhancers
The flavor enhancers and potentiators market is experiencing a significant trend towards increasing demand for natural and clean label flavor enhancers. Consumers are becoming more discerning about the ingredients in their food, preferring products free from artificial additives, MSG, and synthetic chemicals. This trend is driven by the broader movement towards clean eating and transparency in food labeling, as well as growing health consciousness. Manufacturers are responding by developing flavor enhancers derived from natural sources such as yeast extracts, vegetable proteins, and seaweed, which not only enhance taste but also align with consumer preferences for natural, minimally processed ingredients.
Flavor Enhancers and Potentiators Market Driver: Rising Popularity of Convenience Foods and Ready-to-Eat Meals
The rising popularity of convenience foods and ready-to-eat meals is a major driver for the flavor enhancers and potentiators market. As busy lifestyles continue to dominate, consumers are increasingly turning to quick, easy-to-prepare food options that do not compromise on taste. Flavor enhancers are essential in maintaining and boosting the flavor profile of these processed foods, ensuring they remain appealing and satisfying. The expansion of the global food service industry, including fast food, takeout, and home delivery services, further supports the demand for effective flavor enhancers that can improve the taste and palatability of a wide range of convenience food products.
Flavor Enhancers and Potentiators Market Opportunity: Innovation in Health-Boosting and Functional Flavor Enhancers
There is a significant opportunity for growth in the flavor enhancers and potentiators market through innovation in health-boosting and functional flavor enhancers. Companies can capitalize on this by developing enhancers that not only improve taste but also offer additional health benefits. This includes incorporating ingredients known for their nutritional properties, such as antioxidants, vitamins, and minerals, or creating formulations that support specific health goals like improved digestion or enhanced immunity. By focusing on multifunctional flavor enhancers, manufacturers can meet the evolving demands of health-conscious consumers and differentiate their products in a competitive market, driving growth and consumer loyalty.
Flavor Enhancers and Potentiators Market Share Analysis: Savory and Snack segment generated the highest revenue share in the industry
Among the various applications in the Flavor Enhancers and Potentiators Market, Savoury and Snacks emerge as the largest segment. This category includes a wide range of products such as savory snacks, ready-to-eat meals, instant noodles, and other convenience foods where flavor enhancement plays a critical role in consumer preference. Savoury and snack products often rely on flavor enhancers like Monosodium Glutamate (MSG), Hydrolyzed Vegetable Protein (HVP), and Yeast Extract to improve taste profiles, intensify umami flavors, and enhance overall palatability. These ingredients are sought after by manufacturers aiming to cater to the growing demand for convenient, flavorful, and satisfying snack options across global markets.
Flavor Enhancers and Potentiators Market Share Analysis: Beverages is the fastest growing segment over the forecast period to 2032
The fastest-growing segment in the Flavor Enhancers and Potentiators Market by 2032 is Beverages. This growth is driven by evolving consumer preferences towards beverages that offer enhanced taste experiences and functional benefits. Beverage manufacturers are increasingly incorporating flavor enhancers and potentiators to create innovative and appealing drink formulations. These additives are utilized in various beverages such as energy drinks, flavored water, sports drinks, and functional beverages to mask bitterness, improve mouthfeel, and deliver unique flavor profiles that resonate with modern consumer tastes. The expanding market for health-conscious and indulgent beverages further propels the demand for flavor enhancers and potentiators, positioning Beverages as a dynamic and high-growth segment within the industry.
Flavor Enhancers and Potentiators Market Segmentation
By Type
Monosodium Glutamate (MSG)
Hydrolyzed Vegetable Protein (HVP)
Yeast Extract
Others
By Application
Beverages
Dairy Product
Confectionery
Bakery
Meat Products
Savory and Snacks
Frozen Products
Countries Analyzed
North America (US, Canada, Mexico)
Europe (Germany, UK, France, Spain, Italy, Russia, Rest of Europe)
Asia Pacific (China, India, Japan, South Korea, Australia, South East Asia, Rest of Asia)
South America (Brazil, Argentina, Rest of South America)
Middle East and Africa (Saudi Arabia, UAE, Rest of Middle East, South Africa, Egypt, Rest of Africa)
Flavor Enhancers and Potentiators Companies Profiled in the Study
AIPU Food
Ajinomoto Group
Angel Yeast
Biospringer
Firmenich SA
Givaudan SA
International Flavors & Fragrances Inc. (IFF)
International Flavors & Fragrances Inc. (IFF)
Kerry Group Plc
MANE
Meihua
Ningxia Eppen Biotech Co. Ltd
Ohly
Robertet
Royal DSM N.V.
Sensient Technologies Corp
Symrise AG
T. Hasegawa
Takasago International Corp
*- List Not Exhaustive
Chapter 1. TABLE OF CONTENTS
Chapter 2. Introduction to Flavor Enhancers and Potentiators Market
2.1. Market Overview
2.2. Key Statistics and Report Highlights
2.3. Scope of the Comprehensive Study
2.3.1. Market Definition
2.3.2 Countries and Regions Covered
2.3.3 Research Objective
2.3.4 Units, Currency, and Conversions
2.3.5 Industry Value Chain
2.4. Key Market Segments
2.5. Key Companies
2.6. Study Period
Chapter 3. Strategic Analysis Review
3.1. Flavor Enhancers and Potentiators Pricing Analysis and Forecast
3.2. Porter’s Five Forces
3.3. Market Ecosystem
3.4. SWOT Analysis
3.5. Regulatory Scenario
3.3. Effects of Inflation, Russia-Ukraine War, moderating economic growth, and other macroeconomic factors
Chapter 4. Competitive Landscape
4.1. Market Share Analysis
4.1.1. Global Flavor Enhancers and Potentiators Market Share by Company, 2023
4.1.2. Product Offerings of Leading Flavor Enhancers and Potentiators Companies
4.2. Market Entropy
4.2.1. New Product Launches in the Industry
4.2.2. Mergers, Acquisitions, Joint ventures, and Partnerships
4.3. Key Strategies and Best Practices
Chapter 5. Global Market Projections: Best, Reference, and Low Case Scenarios
5.1. Growth Analysis- Case Scenario Definitions
5.2. Low Growth Case Scenario Forecasts
5.3. Reference Growth Case Scenario Forecasts
5.4. High Growth Case Scenario Forecasts
Chapter 6. Market Dynamics
6.1. Flavor Enhancers and Potentiators Market Drivers
6.2. Flavor Enhancers and Potentiators Market Challenges
6.6. Flavor Enhancers and Potentiators Market Opportunities
6.4. Flavor Enhancers and Potentiators Market Trends
Chapter 7. Global Flavor Enhancers and Potentiators Market Outlook Trends
7.1. Global Flavor Enhancers and Potentiators Revenue (USD Million) and CAGR (%) by Type (2021-2032)
7.2. Global Flavor Enhancers and Potentiators Revenue (USD Million) and CAGR (%) by Application (2021-2032)
7.3. Global Flavor Enhancers and Potentiators Revenue (USD Million) and CAGR (%) by Product (2021-2032)
By Type
Monosodium Glutamate (MSG)
Hydrolyzed Vegetable Protein (HVP)
Yeast Extract
Others
By Application
Beverages
Dairy Product
Confectionery
Bakery
Meat Products
Savory and Snacks
Frozen Products
Chapter 8. Global Flavor Enhancers and Potentiators Regional Analysis and Outlook
8.1. Global Flavor Enhancers and Potentiators Revenue (USD Million) By Regions (2021- 2032)
8.2. North America Flavor Enhancers and Potentiators Revenue (USD Million) by Country (2021-2032)
8.2.1. United States Flavor Enhancers and Potentiators Regional Analysis and Outlook
8.2.2. Canada Flavor Enhancers and Potentiators Regional Analysis and Outlook
8.2.3. Mexico Flavor Enhancers and Potentiators Regional Analysis and Outlook
8.3. Europe Flavor Enhancers and Potentiators Revenue (USD Million), by Country (2021-2032)
8.3.1. Germany Flavor Enhancers and Potentiators Regional Analysis and Outlook
8.3.2. France Flavor Enhancers and Potentiators Regional Analysis and Outlook
8.3.3. United Kingdom Flavor Enhancers and Potentiators Regional Analysis and Outlook
8.3.4. Spain Flavor Enhancers and Potentiators Regional Analysis and Outlook
8.3.5. Italy Flavor Enhancers and Potentiators Regional Analysis and Outlook
8.3.6. Russia Flavor Enhancers and Potentiators Regional Analysis and Outlook
8.3.7. Rest of Europe Flavor Enhancers and Potentiators Regional Analysis and Outlook
8.4. Asia Pacific Flavor Enhancers and Potentiators Revenue (USD Million) by Country (2021-2032)
8.4.1. China Flavor Enhancers and Potentiators Regional Analysis and Outlook
8.4.2. Japan Flavor Enhancers and Potentiators Regional Analysis and Outlook
8.4.3. India Flavor Enhancers and Potentiators Regional Analysis and Outlook
8.4.4. South Korea Flavor Enhancers and Potentiators Regional Analysis and Outlook
8.4.5. Australia Flavor Enhancers and Potentiators Regional Analysis and Outlook
8.4.6. South East Asia Flavor Enhancers and Potentiators Regional Analysis and Outlook
8.4.7. Rest of Asia Pacific Flavor Enhancers and Potentiators Regional Analysis and Outlook
8.5. South America Flavor Enhancers and Potentiators Revenue (USD Million), by Country (2021-2032)
8.5.1. Brazil Flavor Enhancers and Potentiators Regional Analysis and Outlook
8.5.2. Argentina Flavor Enhancers and Potentiators Regional Analysis and Outlook
8.5.3. Rest of South America Flavor Enhancers and Potentiators Regional Analysis and Outlook
8.6. Middle East and Africa Flavor Enhancers and Potentiators Revenue (USD Million) by Country (2021-2032)
8.6.1. Middle East Flavor Enhancers and Potentiators Regional Analysis and Outlook
8.6.2. Africa Flavor Enhancers and Potentiators Regional Analysis and Outlook
Chapter 9. North America Flavor Enhancers and Potentiators Analysis and Outlook
9.1. North America Flavor Enhancers and Potentiators Revenue (USD Million) by Segments (2021-2032)
9.1.1. North America Flavor Enhancers and Potentiators Revenue (USD Million) by Type (2021-2032)
9.1.2. North America Flavor Enhancers and Potentiators Revenue (USD Million) by Application (2021-2032)
9.1.3. North America Flavor Enhancers and Potentiators Revenue (USD Million) by Product (2021-2032)
By Type
Monosodium Glutamate (MSG)
Hydrolyzed Vegetable Protein (HVP)
Yeast Extract
Others
By Application
Beverages
Dairy Product
Confectionery
Bakery
Meat Products
Savory and Snacks
Frozen Products
Chapter 10. Europe Flavor Enhancers and Potentiators Analysis and Outlook
10.1. Europe Flavor Enhancers and Potentiators Revenue (USD Million), by Segments (USD Million) (2021-2032)
10.1.1. Europe Flavor Enhancers and Potentiators Revenue (USD Million) by Type (2021-2032)
10.1.2. Europe Flavor Enhancers and Potentiators Revenue (USD Million) by Application (2021-2032)
10.1.3. Europe Flavor Enhancers and Potentiators Revenue (USD Million) by Product (2021-2032)
By Type
Monosodium Glutamate (MSG)
Hydrolyzed Vegetable Protein (HVP)
Yeast Extract
Others
By Application
Beverages
Dairy Product
Confectionery
Bakery
Meat Products
Savory and Snacks
Frozen Products
Chapter 11. Asia Pacific Flavor Enhancers and Potentiators Analysis and Outlook
11.1. Asia Pacific Flavor Enhancers and Potentiators Revenue (USD Million), and Revenue (USD Million) by Segments (2021-2032)
11.1.1. Asia Pacific Flavor Enhancers and Potentiators Revenue (USD Million) by Type (2021-2032)
11.1.2. Asia Pacific Flavor Enhancers and Potentiators Revenue (USD Million) by Application (2021-2032)
11.1.3. Asia Pacific Flavor Enhancers and Potentiators Revenue (USD Million) by Product (2021-2032)
By Type
Monosodium Glutamate (MSG)
Hydrolyzed Vegetable Protein (HVP)
Yeast Extract
Others
By Application
Beverages
Dairy Product
Confectionery
Bakery
Meat Products
Savory and Snacks
Frozen Products
Chapter 12. South America Flavor Enhancers and Potentiators Analysis and Outlook
12.1. South America Flavor Enhancers and Potentiators Revenue (USD Million), by Segments (2021-2032)
12.1.1. South America Flavor Enhancers and Potentiators Revenue (USD Million) by Type (2021-2032)
12.1.2. South America Flavor Enhancers and Potentiators Revenue (USD Million) by Application (2021-2032)
12.1.3. South America Flavor Enhancers and Potentiators Revenue (USD Million) by Product (2021-2032)
By Type
Monosodium Glutamate (MSG)
Hydrolyzed Vegetable Protein (HVP)
Yeast Extract
Others
By Application
Beverages
Dairy Product
Confectionery
Bakery
Meat Products
Savory and Snacks
Frozen Products
Chapter 13. Middle East and Africa Flavor Enhancers and Potentiators Analysis and Outlook
13.1. Middle East and Africa Flavor Enhancers and Potentiators Revenue (USD Million), by Segments (2021-2032)
13.1.1. Middle East and Africa Flavor Enhancers and Potentiators Revenue (USD Million) by Type (2021-2032)
13.1.2. Middle East and Africa Flavor Enhancers and Potentiators Revenue (USD Million) by Application (2021-2032)
13.1.3. Middle East and Africa Flavor Enhancers and Potentiators Revenue (USD Million) by Product (2021-2032)
By Type
Monosodium Glutamate (MSG)
Hydrolyzed Vegetable Protein (HVP)
Yeast Extract
Others
By Application
Beverages
Dairy Product
Confectionery
Bakery
Meat Products
Savory and Snacks
Frozen Products
Chapter 14. Flavor Enhancers and Potentiators Company Profiles
14.1 Business Overview
14.2 Product Profiles
14.3 SWOT Profiles
14.5 Recent Developments
14.6 Financial Profile
List of Companies
AIPU Food
Ajinomoto Group
Angel Yeast
Biospringer
Firmenich SA
Givaudan SA
International Flavors & Fragrances Inc. (IFF)
International Flavors & Fragrances Inc. (IFF)
Kerry Group Plc
MANE
Meihua
Ningxia Eppen Biotech Co. Ltd
Ohly
Robertet
Royal DSM N.V.
Sensient Technologies Corp
Symrise AG
T. Hasegawa
Takasago International Corp
15. Methodology and Data Sources
15.1 Customization Offerings
15.2 Subscription Services
15.3 Related Reports
15.4 Publisher Expertise
LIST OF TABLES
Table 1 Market Segmentation Analysis
Table 2 Global Flavor Enhancers and Potentiators Market Share of Leading Companies, 2023
Table 3 Product Offerings of Leading Companies
Table 4 Low Growth Scenario Forecasts
Table 5 Reference Case Growth Scenario
Table 6 High Growth Case Scenario
Table 7 Global Flavor Enhancers and Potentiators Revenue (USD Million) And CAGR (%) By Type (2021-2032)
Table 8 Global Flavor Enhancers and Potentiators Revenue (USD Million) And CAGR (%) By Application (2021-2032)
Table 9 Global Flavor Enhancers and Potentiators Revenue (USD Million) And CAGR (%) By Product (2021-2032)
Table 10 Global Flavor Enhancers and Potentiators Market Revenue (USD Million) By Regions (2021-2032)
Table 11 Global Flavor Enhancers and Potentiators Market Share (%) By Regions (2021-2032)
Table 12 North America Flavor Enhancers and Potentiators Revenue (USD Million) By Country (2021-2032)
Table 13 Europe Flavor Enhancers and Potentiators Revenue (USD Million) By Country (2021-2032)
Table 14 Asia Pacific Flavor Enhancers and Potentiators Revenue (USD Million) By Country (2021-2032)
Table 15 South America Flavor Enhancers and Potentiators Revenue (USD Million) By Country (2021-2032)
Table 16 Middle East and Africa Flavor Enhancers and Potentiators Revenue (USD Million) By Region (2021-2032)
Table 17 North America Flavor Enhancers and Potentiators Revenue (USD Million) By Type (2021-2032)
Table 18 North America Flavor Enhancers and Potentiators Revenue (USD Million) By Application (2021-2032)
Table 19 North America Flavor Enhancers and Potentiators Revenue (USD Million) By Product (2021-2032)
Table 20 Europe Flavor Enhancers and Potentiators Revenue (USD Million) By Type (2021-2032)
Table 21 Europe Flavor Enhancers and Potentiators Revenue (USD Million) By Application (2021-2032)
Table 22 Europe Flavor Enhancers and Potentiators Revenue (USD Million) By Product (2021-2032)
Table 23 Asia Pacific Flavor Enhancers and Potentiators Revenue (USD Million) By Type (2021-2032)
Table 24 Asia Pacific Flavor Enhancers and Potentiators Revenue (USD Million) By Application (2021-2032)
Table 25 Asia Pacific Flavor Enhancers and Potentiators Revenue (USD Million) By Product (2021-2032)
Table 26 South America Flavor Enhancers and Potentiators Revenue (USD Million) By Type (2021-2032)
Table 27 South America Flavor Enhancers and Potentiators Revenue (USD Million) By Application (2021-2032)
Table 28 South America Flavor Enhancers and Potentiators Revenue (USD Million) By Product (2021-2032)
Table 29 Middle East and Africa Flavor Enhancers and Potentiators Revenue (USD Million) By Type (2021-2032)
Table 30 Middle East and Africa Flavor Enhancers and Potentiators Revenue (USD Million) By Application (2021-2032)
Table 31 Middle East and Africa Flavor Enhancers and Potentiators Revenue (USD Million) By Product (2021-2032)
LIST OF FIGURES
Figure 1. Market Scope
Figure 2. Pricing Forecasts Per Unit, 2023- 2032
Figure 3. Porter’s Five Forces
Figure 4. Global Flavor Enhancers and Potentiators Market Revenue (USD Million) By Regions (2021-2032)
Figure 5. Global Flavor Enhancers and Potentiators Market Share (%) By Regions (2023)
Figure 6. North America Flavor Enhancers and Potentiators Revenue (USD Million) By Country (2021-2032)
Figure 7. United States Flavor Enhancers and Potentiators Revenue (USD Million) By Country (2021-2032)
Figure 8. Canada Flavor Enhancers and Potentiators Revenue (USD Million) By Country (2021-2032)
Figure 9. Mexico Flavor Enhancers and Potentiators Revenue (USD Million) By Country (2021-2032)
Figure 10. Europe Flavor Enhancers and Potentiators Revenue (USD Million) By Country (2021-2032)
Figure 11. Germany Flavor Enhancers and Potentiators Revenue (USD Million) By Country (2021-2032)
Figure 12. France Flavor Enhancers and Potentiators Revenue (USD Million) By Country (2021-2032)
Figure 13. United Kingdom Flavor Enhancers and Potentiators Revenue (USD Million) By Country (2021-2032)
Figure 14. Spain Flavor Enhancers and Potentiators Revenue (USD Million) By Country (2021-2032)
Figure 15. Italy Flavor Enhancers and Potentiators Revenue (USD Million) By Country (2021-2032)
Figure 16. Russia Flavor Enhancers and Potentiators Revenue (USD Million) By Country (2021-2032)
Figure 17. Rest of Europe Flavor Enhancers and Potentiators Revenue (USD Million) By Country (2021-2032)
Figure 11. Asia Pacific Flavor Enhancers and Potentiators Revenue (USD Million) By Country (2021-2032)
Figure 12. China Flavor Enhancers and Potentiators Revenue (USD Million) By Country (2021-2032)
Figure 13. Japan Flavor Enhancers and Potentiators Revenue (USD Million) By Country (2021-2032)
Figure 14. India Flavor Enhancers and Potentiators Revenue (USD Million) By Country (2021-2032)
Figure 15. South Korea Flavor Enhancers and Potentiators Revenue (USD Million) By Country (2021-2032)
Figure 16. Australia Flavor Enhancers and Potentiators Revenue (USD Million) By Country (2021-2032)
Figure 17. South East Asia Flavor Enhancers and Potentiators Revenue (USD Million) By Country (2021-2032)
Figure 18. South America Flavor Enhancers and Potentiators Revenue (USD Million) By Country (2021-2032)
Figure 19. Brazil Flavor Enhancers and Potentiators Revenue (USD Million) By Country (2021-2032)
Figure 20. Argentina Flavor Enhancers and Potentiators Revenue (USD Million) By Country (2021-2032)
Figure 21. Rest of Asia Pacific Flavor Enhancers and Potentiators Revenue (USD Million) By Country (2021-2032)
Figure 22. Middle East and Africa Flavor Enhancers and Potentiators Revenue (USD Million) By Region (2021-2032)
Figure 23. Saudi Arabia Flavor Enhancers and Potentiators Revenue (USD Million) By Region (2021-2032)
Figure 24. The UAE Flavor Enhancers and Potentiators Revenue (USD Million) By Region (2021-2032)
Figure 25. Rest of Middle East Flavor Enhancers and Potentiators Revenue (USD Million) By Region (2021-2032)
Figure 26. South Africa Flavor Enhancers and Potentiators Revenue (USD Million) By Region (2021-2032)
Figure 27. Africa Flavor Enhancers and Potentiators Revenue (USD Million) By Region (2021-2032)
Figure 28. North America Flavor Enhancers and Potentiators Revenue (USD Million) By Type (2021-2032)
Figure 29. North America Flavor Enhancers and Potentiators Revenue (USD Million) By Application (2021-2032)
Figure 30. North America Flavor Enhancers and Potentiators Revenue (USD Million) By Product (2021-2032)
Figure 31. Europe Flavor Enhancers and Potentiators Revenue (USD Million) By Type (2021-2032)
Figure 32. Europe Flavor Enhancers and Potentiators Revenue (USD Million) By Application (2021-2032)
Figure 33. Europe Flavor Enhancers and Potentiators Revenue (USD Million) By Product (2021-2032)
Figure 34. Asia Pacific Flavor Enhancers and Potentiators Revenue (USD Million) By Type (2021-2032)
Figure 35. Asia Pacific Flavor Enhancers and Potentiators Revenue (USD Million) By Application (2021-2032)
Figure 36. Asia Pacific Flavor Enhancers and Potentiators Revenue (USD Million) By Product (2021-2032)
Figure 37. South America Flavor Enhancers and Potentiators Revenue (USD Million) By Type (2021-2032)
Figure 38. South America Flavor Enhancers and Potentiators Revenue (USD Million) By Application (2021-2032)
Figure 39. South America Flavor Enhancers and Potentiators Revenue (USD Million) By Product (2021-2032)
Figure 40. Middle East and Africa Flavor Enhancers and Potentiators Revenue (USD Million) By Type (2021-2032)
Figure 41. Middle East and Africa Flavor Enhancers and Potentiators Revenue (USD Million) By Application (2021-2032)
Figure 42. Middle East and Africa Flavor Enhancers and Potentiators Revenue (USD Million) By Product (2021-2032)
By Type
Monosodium Glutamate (MSG)
Hydrolyzed Vegetable Protein (HVP)
Yeast Extract
Others
By Application
Beverages
Dairy Product
Confectionery
Bakery
Meat Products
Savory and Snacks
Frozen Products
Countries Analyzed
North America (US, Canada, Mexico)
Europe (Germany, UK, France, Spain, Italy, Russia, Rest of Europe)
Asia Pacific (China, India, Japan, South Korea, Australia, South East Asia, Rest of Asia)
South America (Brazil, Argentina, Rest of South America)
Middle East and Africa (Saudi Arabia, UAE, Rest of Middle East, South Africa, Egypt, Rest of Africa)
