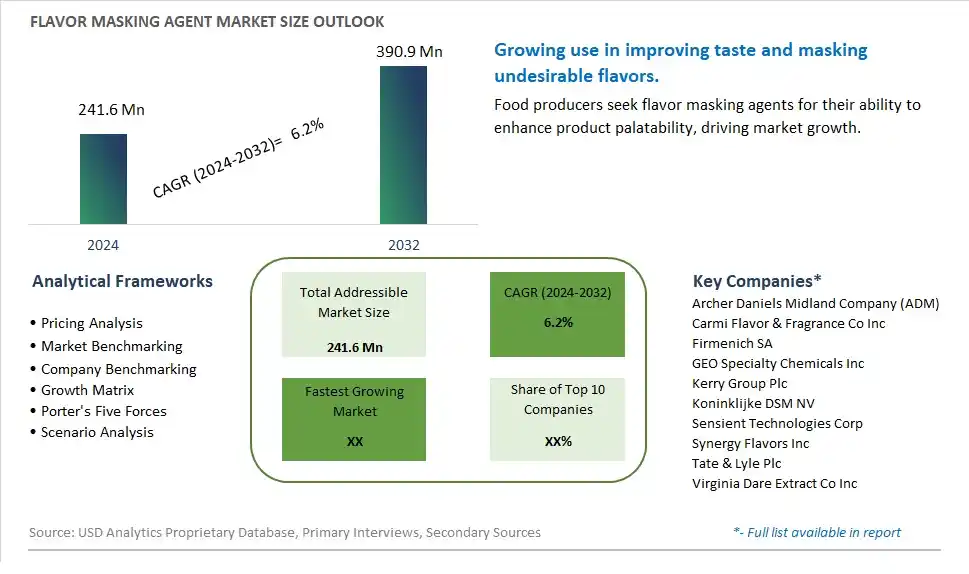
Global Flavor Masking Agent Market Size is valued at $241.6 Million in 2024 and is forecast to register a growth rate (CAGR) of 6.2% to reach $390.9 Million by 2032.
The global Flavor Masking Agent Market Comprehensive Study analyzes and forecasts the market size across 6 regions and 24 countries for diverse segments -By Type (Sweet, Salt, Fat, Bitter, Others), By Application (Food and Beverages, Pharmaceuticals, Nutraceuticals, Others)
An Introduction to Flavor Masking Agent Market
The Flavor Masking Agent market in 2024 is experiencing significant growth, driven by the increasing demand for products that improve the palatability of food and beverages containing unpleasant or off-flavors. Flavor masking agents, used to mask bitter, metallic, or medicinal tastes, are essential in functional foods, dietary supplements, and pharmaceuticals. The market benefits from advancements in flavor masking technologies, the growing trend of health and wellness, and the expansion of the nutraceutical sector. Additionally, the rising focus on consumer acceptance and product quality is contributing to market growth.
Flavor Masking Agent Competitive Landscape
The market report analyses the leading companies in the industry including Archer Daniels Midland Company (ADM), Carmi Flavor & Fragrance Co Inc, Firmenich SA, GEO Specialty Chemicals Inc, Kerry Group Plc, Koninklijke DSM NV, Sensient Technologies Corp, Synergy Flavors Inc, Tate & Lyle Plc, Virginia Dare Extract Co Inc, and Others.
Flavor Masking Agent Market Dynamics
Flavor Masking Agent Market Trend: Increasing Use of Natural Flavor Masking Agents
The flavor masking agent market is experiencing a significant trend towards the increasing use of natural flavor masking agents. Consumers are becoming more conscious of the ingredients in their food and beverages, preferring natural and clean label products over those with synthetic additives. This trend is driven by the growing demand for transparency and healthier consumption choices. Manufacturers are responding by developing flavor masking agents derived from natural sources such as plant extracts, herbs, and spices. These natural agents are effective in masking undesirable tastes from vitamins, minerals, and other functional ingredients without compromising the product's overall quality and appeal.
Flavor Masking Agent Market Driver: Rising Demand for Functional Foods and Beverages
The rising demand for functional foods and beverages is a major driver for the flavor masking agent market. As consumers become more health-conscious, they are seeking products fortified with vitamins, minerals, proteins, and other beneficial ingredients. However, these functional additives often come with strong or unpleasant flavors that can deter consumers. Flavor masking agents are essential in enhancing the palatability of these products, making them more enjoyable to consume. This driver is supported by the expansion of the health and wellness industry, which continuously introduces new fortified products that require effective taste masking solutions to meet consumer expectations.
Flavor Masking Agent Market Opportunity: Innovation in Multi-Functional Masking Solutions
There is a significant opportunity for growth in the flavor masking agent market through innovation in multi-functional masking solutions. Companies can develop advanced masking agents that not only neutralize undesirable tastes but also enhance overall flavor profiles and improve mouthfeel. Additionally, there is potential to create specialized masking agents tailored for specific applications, such as plant-based proteins, dietary supplements, and medicinal products. By focusing on multi-functional and application-specific solutions, manufacturers can address the diverse needs of food and beverage producers, attract a wider range of clients, and drive market expansion in the competitive landscape of flavor masking agents.
Flavor Masking Agent Market Share Analysis: Sweet segment generated the highest revenue share in the industry
Within the Flavor Masking Agent Market, Sweet masking agents stand out as the largest segment. Sweet masking agents are crucial in food and beverage formulations where masking bitter or unpleasant tastes without adding extra sweetness is necessary. These agents are used extensively in products like pharmaceuticals, health supplements, and functional foods where the taste profile needs modification to enhance palatability without altering the intended flavor or function of the product.
Flavor Masking Agent Market Share Analysis: Pharmaceuticals is the fastest growing segment over the forecast period to 2032
The fastest-growing segment in the Flavor Masking Agent Market by 2032 is Pharmaceuticals. This growth is driven by the increasing demand for taste-masking solutions in pharmaceutical formulations, especially for medications that have bitter or unpleasant tastes. Flavor masking agents play a pivotal role in enhancing patient compliance and adherence by masking the bitterness or unpleasant aftertaste of drugs, thereby improving overall patient experience. As pharmaceutical companies focus more on patient-centric formulations and consumer-friendly products, the adoption of flavor masking agents is expected to surge, contributing significantly to the growth of this market segment. Further, the development of new drugs and formulations requiring effective taste-masking solutions further accelerates the demand for flavor masking agents in the pharmaceutical sector.
Flavor Masking Agent Market Segmentation
By Type
Sweet
Salt
Fat
Bitter
Others
By Application
Food and Beverages
Pharmaceuticals
Nutraceuticals
Others
Countries Analyzed
North America (US, Canada, Mexico)
Europe (Germany, UK, France, Spain, Italy, Russia, Rest of Europe)
Asia Pacific (China, India, Japan, South Korea, Australia, South East Asia, Rest of Asia)
South America (Brazil, Argentina, Rest of South America)
Middle East and Africa (Saudi Arabia, UAE, Rest of Middle East, South Africa, Egypt, Rest of Africa)
Flavor Masking Agent Companies Profiled in the Study
Archer Daniels Midland Company (ADM)
Carmi Flavor & Fragrance Co Inc
Firmenich SA
GEO Specialty Chemicals Inc
Kerry Group Plc
Koninklijke DSM NV
Sensient Technologies Corp
Synergy Flavors Inc
Tate & Lyle Plc
Virginia Dare Extract Co Inc
*- List Not Exhaustive
Chapter 1. TABLE OF CONTENTS
Chapter 2. Introduction to Flavor Masking Agent Market
2.1. Market Overview
2.2. Key Statistics and Report Highlights
2.3. Scope of the Comprehensive Study
2.3.1. Market Definition
2.3.2 Countries and Regions Covered
2.3.3 Research Objective
2.3.4 Units, Currency, and Conversions
2.3.5 Industry Value Chain
2.4. Key Market Segments
2.5. Key Companies
2.6. Study Period
Chapter 3. Strategic Analysis Review
3.1. Flavor Masking Agent Pricing Analysis and Forecast
3.2. Porter’s Five Forces
3.3. Market Ecosystem
3.4. SWOT Analysis
3.5. Regulatory Scenario
3.3. Effects of Inflation, Russia-Ukraine War, moderating economic growth, and other macroeconomic factors
Chapter 4. Competitive Landscape
4.1. Market Share Analysis
4.1.1. Global Flavor Masking Agent Market Share by Company, 2023
4.1.2. Product Offerings of Leading Flavor Masking Agent Companies
4.2. Market Entropy
4.2.1. New Product Launches in the Industry
4.2.2. Mergers, Acquisitions, Joint ventures, and Partnerships
4.3. Key Strategies and Best Practices
Chapter 5. Global Market Projections: Best, Reference, and Low Case Scenarios
5.1. Growth Analysis- Case Scenario Definitions
5.2. Low Growth Case Scenario Forecasts
5.3. Reference Growth Case Scenario Forecasts
5.4. High Growth Case Scenario Forecasts
Chapter 6. Market Dynamics
6.1. Flavor Masking Agent Market Drivers
6.2. Flavor Masking Agent Market Challenges
6.6. Flavor Masking Agent Market Opportunities
6.4. Flavor Masking Agent Market Trends
Chapter 7. Global Flavor Masking Agent Market Outlook Trends
7.1. Global Flavor Masking Agent Revenue (USD Million) and CAGR (%) by Type (2021-2032)
7.2. Global Flavor Masking Agent Revenue (USD Million) and CAGR (%) by Application (2021-2032)
7.3. Global Flavor Masking Agent Revenue (USD Million) and CAGR (%) by Product (2021-2032)
By Type
Sweet
Salt
Fat
Bitter
Others
By Application
Food and Beverages
Pharmaceuticals
Nutraceuticals
Others
Chapter 8. Global Flavor Masking Agent Regional Analysis and Outlook
8.1. Global Flavor Masking Agent Revenue (USD Million) By Regions (2021- 2032)
8.2. North America Flavor Masking Agent Revenue (USD Million) by Country (2021-2032)
8.2.1. United States Flavor Masking Agent Regional Analysis and Outlook
8.2.2. Canada Flavor Masking Agent Regional Analysis and Outlook
8.2.3. Mexico Flavor Masking Agent Regional Analysis and Outlook
8.3. Europe Flavor Masking Agent Revenue (USD Million), by Country (2021-2032)
8.3.1. Germany Flavor Masking Agent Regional Analysis and Outlook
8.3.2. France Flavor Masking Agent Regional Analysis and Outlook
8.3.3. United Kingdom Flavor Masking Agent Regional Analysis and Outlook
8.3.4. Spain Flavor Masking Agent Regional Analysis and Outlook
8.3.5. Italy Flavor Masking Agent Regional Analysis and Outlook
8.3.6. Russia Flavor Masking Agent Regional Analysis and Outlook
8.3.7. Rest of Europe Flavor Masking Agent Regional Analysis and Outlook
8.4. Asia Pacific Flavor Masking Agent Revenue (USD Million) by Country (2021-2032)
8.4.1. China Flavor Masking Agent Regional Analysis and Outlook
8.4.2. Japan Flavor Masking Agent Regional Analysis and Outlook
8.4.3. India Flavor Masking Agent Regional Analysis and Outlook
8.4.4. South Korea Flavor Masking Agent Regional Analysis and Outlook
8.4.5. Australia Flavor Masking Agent Regional Analysis and Outlook
8.4.6. South East Asia Flavor Masking Agent Regional Analysis and Outlook
8.4.7. Rest of Asia Pacific Flavor Masking Agent Regional Analysis and Outlook
8.5. South America Flavor Masking Agent Revenue (USD Million), by Country (2021-2032)
8.5.1. Brazil Flavor Masking Agent Regional Analysis and Outlook
8.5.2. Argentina Flavor Masking Agent Regional Analysis and Outlook
8.5.3. Rest of South America Flavor Masking Agent Regional Analysis and Outlook
8.6. Middle East and Africa Flavor Masking Agent Revenue (USD Million) by Country (2021-2032)
8.6.1. Middle East Flavor Masking Agent Regional Analysis and Outlook
8.6.2. Africa Flavor Masking Agent Regional Analysis and Outlook
Chapter 9. North America Flavor Masking Agent Analysis and Outlook
9.1. North America Flavor Masking Agent Revenue (USD Million) by Segments (2021-2032)
9.1.1. North America Flavor Masking Agent Revenue (USD Million) by Type (2021-2032)
9.1.2. North America Flavor Masking Agent Revenue (USD Million) by Application (2021-2032)
9.1.3. North America Flavor Masking Agent Revenue (USD Million) by Product (2021-2032)
By Type
Sweet
Salt
Fat
Bitter
Others
By Application
Food and Beverages
Pharmaceuticals
Nutraceuticals
Others
Chapter 10. Europe Flavor Masking Agent Analysis and Outlook
10.1. Europe Flavor Masking Agent Revenue (USD Million), by Segments (USD Million) (2021-2032)
10.1.1. Europe Flavor Masking Agent Revenue (USD Million) by Type (2021-2032)
10.1.2. Europe Flavor Masking Agent Revenue (USD Million) by Application (2021-2032)
10.1.3. Europe Flavor Masking Agent Revenue (USD Million) by Product (2021-2032)
By Type
Sweet
Salt
Fat
Bitter
Others
By Application
Food and Beverages
Pharmaceuticals
Nutraceuticals
Others
Chapter 11. Asia Pacific Flavor Masking Agent Analysis and Outlook
11.1. Asia Pacific Flavor Masking Agent Revenue (USD Million), and Revenue (USD Million) by Segments (2021-2032)
11.1.1. Asia Pacific Flavor Masking Agent Revenue (USD Million) by Type (2021-2032)
11.1.2. Asia Pacific Flavor Masking Agent Revenue (USD Million) by Application (2021-2032)
11.1.3. Asia Pacific Flavor Masking Agent Revenue (USD Million) by Product (2021-2032)
By Type
Sweet
Salt
Fat
Bitter
Others
By Application
Food and Beverages
Pharmaceuticals
Nutraceuticals
Others
Chapter 12. South America Flavor Masking Agent Analysis and Outlook
12.1. South America Flavor Masking Agent Revenue (USD Million), by Segments (2021-2032)
12.1.1. South America Flavor Masking Agent Revenue (USD Million) by Type (2021-2032)
12.1.2. South America Flavor Masking Agent Revenue (USD Million) by Application (2021-2032)
12.1.3. South America Flavor Masking Agent Revenue (USD Million) by Product (2021-2032)
By Type
Sweet
Salt
Fat
Bitter
Others
By Application
Food and Beverages
Pharmaceuticals
Nutraceuticals
Others
Chapter 13. Middle East and Africa Flavor Masking Agent Analysis and Outlook
13.1. Middle East and Africa Flavor Masking Agent Revenue (USD Million), by Segments (2021-2032)
13.1.1. Middle East and Africa Flavor Masking Agent Revenue (USD Million) by Type (2021-2032)
13.1.2. Middle East and Africa Flavor Masking Agent Revenue (USD Million) by Application (2021-2032)
13.1.3. Middle East and Africa Flavor Masking Agent Revenue (USD Million) by Product (2021-2032)
By Type
Sweet
Salt
Fat
Bitter
Others
By Application
Food and Beverages
Pharmaceuticals
Nutraceuticals
Others
Chapter 14. Flavor Masking Agent Company Profiles
14.1 Business Overview
14.2 Product Profiles
14.3 SWOT Profiles
14.5 Recent Developments
14.6 Financial Profile
List of Companies
Archer Daniels Midland Company (ADM)
Carmi Flavor & Fragrance Co Inc
Firmenich SA
GEO Specialty Chemicals Inc
Kerry Group Plc
Koninklijke DSM NV
Sensient Technologies Corp
Synergy Flavors Inc
Tate & Lyle Plc
Virginia Dare Extract Co Inc
15. Methodology and Data Sources
15.1 Customization Offerings
15.2 Subscription Services
15.3 Related Reports
15.4 Publisher Expertise
LIST OF TABLES
Table 1 Market Segmentation Analysis
Table 2 Global Flavor Masking Agent Market Share of Leading Companies, 2023
Table 3 Product Offerings of Leading Companies
Table 4 Low Growth Scenario Forecasts
Table 5 Reference Case Growth Scenario
Table 6 High Growth Case Scenario
Table 7 Global Flavor Masking Agent Revenue (USD Million) And CAGR (%) By Type (2021-2032)
Table 8 Global Flavor Masking Agent Revenue (USD Million) And CAGR (%) By Application (2021-2032)
Table 9 Global Flavor Masking Agent Revenue (USD Million) And CAGR (%) By Product (2021-2032)
Table 10 Global Flavor Masking Agent Market Revenue (USD Million) By Regions (2021-2032)
Table 11 Global Flavor Masking Agent Market Share (%) By Regions (2021-2032)
Table 12 North America Flavor Masking Agent Revenue (USD Million) By Country (2021-2032)
Table 13 Europe Flavor Masking Agent Revenue (USD Million) By Country (2021-2032)
Table 14 Asia Pacific Flavor Masking Agent Revenue (USD Million) By Country (2021-2032)
Table 15 South America Flavor Masking Agent Revenue (USD Million) By Country (2021-2032)
Table 16 Middle East and Africa Flavor Masking Agent Revenue (USD Million) By Region (2021-2032)
Table 17 North America Flavor Masking Agent Revenue (USD Million) By Type (2021-2032)
Table 18 North America Flavor Masking Agent Revenue (USD Million) By Application (2021-2032)
Table 19 North America Flavor Masking Agent Revenue (USD Million) By Product (2021-2032)
Table 20 Europe Flavor Masking Agent Revenue (USD Million) By Type (2021-2032)
Table 21 Europe Flavor Masking Agent Revenue (USD Million) By Application (2021-2032)
Table 22 Europe Flavor Masking Agent Revenue (USD Million) By Product (2021-2032)
Table 23 Asia Pacific Flavor Masking Agent Revenue (USD Million) By Type (2021-2032)
Table 24 Asia Pacific Flavor Masking Agent Revenue (USD Million) By Application (2021-2032)
Table 25 Asia Pacific Flavor Masking Agent Revenue (USD Million) By Product (2021-2032)
Table 26 South America Flavor Masking Agent Revenue (USD Million) By Type (2021-2032)
Table 27 South America Flavor Masking Agent Revenue (USD Million) By Application (2021-2032)
Table 28 South America Flavor Masking Agent Revenue (USD Million) By Product (2021-2032)
Table 29 Middle East and Africa Flavor Masking Agent Revenue (USD Million) By Type (2021-2032)
Table 30 Middle East and Africa Flavor Masking Agent Revenue (USD Million) By Application (2021-2032)
Table 31 Middle East and Africa Flavor Masking Agent Revenue (USD Million) By Product (2021-2032)
LIST OF FIGURES
Figure 1. Market Scope
Figure 2. Pricing Forecasts Per Unit, 2023- 2032
Figure 3. Porter’s Five Forces
Figure 4. Global Flavor Masking Agent Market Revenue (USD Million) By Regions (2021-2032)
Figure 5. Global Flavor Masking Agent Market Share (%) By Regions (2023)
Figure 6. North America Flavor Masking Agent Revenue (USD Million) By Country (2021-2032)
Figure 7. United States Flavor Masking Agent Revenue (USD Million) By Country (2021-2032)
Figure 8. Canada Flavor Masking Agent Revenue (USD Million) By Country (2021-2032)
Figure 9. Mexico Flavor Masking Agent Revenue (USD Million) By Country (2021-2032)
Figure 10. Europe Flavor Masking Agent Revenue (USD Million) By Country (2021-2032)
Figure 11. Germany Flavor Masking Agent Revenue (USD Million) By Country (2021-2032)
Figure 12. France Flavor Masking Agent Revenue (USD Million) By Country (2021-2032)
Figure 13. United Kingdom Flavor Masking Agent Revenue (USD Million) By Country (2021-2032)
Figure 14. Spain Flavor Masking Agent Revenue (USD Million) By Country (2021-2032)
Figure 15. Italy Flavor Masking Agent Revenue (USD Million) By Country (2021-2032)
Figure 16. Russia Flavor Masking Agent Revenue (USD Million) By Country (2021-2032)
Figure 17. Rest of Europe Flavor Masking Agent Revenue (USD Million) By Country (2021-2032)
Figure 11. Asia Pacific Flavor Masking Agent Revenue (USD Million) By Country (2021-2032)
Figure 12. China Flavor Masking Agent Revenue (USD Million) By Country (2021-2032)
Figure 13. Japan Flavor Masking Agent Revenue (USD Million) By Country (2021-2032)
Figure 14. India Flavor Masking Agent Revenue (USD Million) By Country (2021-2032)
Figure 15. South Korea Flavor Masking Agent Revenue (USD Million) By Country (2021-2032)
Figure 16. Australia Flavor Masking Agent Revenue (USD Million) By Country (2021-2032)
Figure 17. South East Asia Flavor Masking Agent Revenue (USD Million) By Country (2021-2032)
Figure 18. South America Flavor Masking Agent Revenue (USD Million) By Country (2021-2032)
Figure 19. Brazil Flavor Masking Agent Revenue (USD Million) By Country (2021-2032)
Figure 20. Argentina Flavor Masking Agent Revenue (USD Million) By Country (2021-2032)
Figure 21. Rest of Asia Pacific Flavor Masking Agent Revenue (USD Million) By Country (2021-2032)
Figure 22. Middle East and Africa Flavor Masking Agent Revenue (USD Million) By Region (2021-2032)
Figure 23. Saudi Arabia Flavor Masking Agent Revenue (USD Million) By Region (2021-2032)
Figure 24. The UAE Flavor Masking Agent Revenue (USD Million) By Region (2021-2032)
Figure 25. Rest of Middle East Flavor Masking Agent Revenue (USD Million) By Region (2021-2032)
Figure 26. South Africa Flavor Masking Agent Revenue (USD Million) By Region (2021-2032)
Figure 27. Africa Flavor Masking Agent Revenue (USD Million) By Region (2021-2032)
Figure 28. North America Flavor Masking Agent Revenue (USD Million) By Type (2021-2032)
Figure 29. North America Flavor Masking Agent Revenue (USD Million) By Application (2021-2032)
Figure 30. North America Flavor Masking Agent Revenue (USD Million) By Product (2021-2032)
Figure 31. Europe Flavor Masking Agent Revenue (USD Million) By Type (2021-2032)
Figure 32. Europe Flavor Masking Agent Revenue (USD Million) By Application (2021-2032)
Figure 33. Europe Flavor Masking Agent Revenue (USD Million) By Product (2021-2032)
Figure 34. Asia Pacific Flavor Masking Agent Revenue (USD Million) By Type (2021-2032)
Figure 35. Asia Pacific Flavor Masking Agent Revenue (USD Million) By Application (2021-2032)
Figure 36. Asia Pacific Flavor Masking Agent Revenue (USD Million) By Product (2021-2032)
Figure 37. South America Flavor Masking Agent Revenue (USD Million) By Type (2021-2032)
Figure 38. South America Flavor Masking Agent Revenue (USD Million) By Application (2021-2032)
Figure 39. South America Flavor Masking Agent Revenue (USD Million) By Product (2021-2032)
Figure 40. Middle East and Africa Flavor Masking Agent Revenue (USD Million) By Type (2021-2032)
Figure 41. Middle East and Africa Flavor Masking Agent Revenue (USD Million) By Application (2021-2032)
Figure 42. Middle East and Africa Flavor Masking Agent Revenue (USD Million) By Product (2021-2032)
By Type
Sweet
Salt
Fat
Bitter
Others
By Application
Food and Beverages
Pharmaceuticals
Nutraceuticals
Others
Countries Analyzed
North America (US, Canada, Mexico)
Europe (Germany, UK, France, Spain, Italy, Russia, Rest of Europe)
Asia Pacific (China, India, Japan, South Korea, Australia, South East Asia, Rest of Asia)
South America (Brazil, Argentina, Rest of South America)
Middle East and Africa (Saudi Arabia, UAE, Rest of Middle East, South Africa, Egypt, Rest of Africa)
