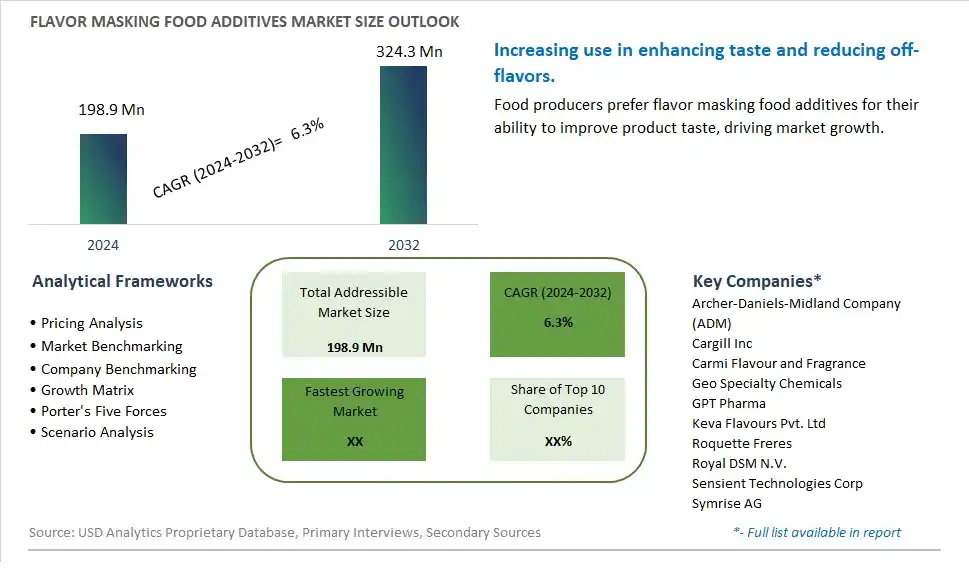
Global Flavor Masking Food Additives Market Size is valued at $198.9 Million in 2024 and is forecast to register a growth rate (CAGR) of 6.3% to reach $324.3 Million by 2032.
The global Flavor Masking Food Additives Market Comprehensive Study analyzes and forecasts the market size across 6 regions and 24 countries for diverse segments -By Type (Salt Flavor, Fat Flavor, Bitter Flavor, Others), By Application (Food & Beverages, Pharmaceuticals, Nutraceuticals, Others)
An Introduction to Flavor Masking Food Additives Market
The Flavor Masking Food Additives market in 2024 is thriving, fueled by the rising demand for additives that enhance the taste and sensory profile of health-focused food and beverage products. Flavor masking food additives, such as natural extracts, sweeteners, and acids, are used to cover undesirable tastes in protein-rich, fortified, and functional foods. The market benefits from advancements in food science, the growing trend of clean label and natural ingredients, and the expansion of the health and wellness sector. Additionally, the increasing focus on product innovation and consumer satisfaction is driving market growth.
Flavor Masking Food Additives Competitive Landscape
The market report analyses the leading companies in the industry including Archer-Daniels-Midland Company (ADM), Cargill Inc, Carmi Flavour and Fragrance, Geo Specialty Chemicals, GPT Pharma, Keva Flavours Pvt. Ltd, Roquette Freres, Royal DSM N.V., Sensient Technologies Corp, Symrise AG, and Others.
Flavor Masking Food Additives Market Dynamics
Flavor Masking Food Additives Market Trend: Increasing Preference for Natural and Clean Label Products
The flavor masking food additives market is experiencing a significant trend towards the increasing preference for natural and clean label products. Consumers are becoming more vigilant about the ingredients in their food, seeking products that are free from artificial additives and chemicals. This shift is driven by growing health consciousness and a desire for transparency in food production. Manufacturers are responding by developing natural flavor masking additives derived from sources such as botanical extracts, fruits, and herbs. These natural solutions not only align with consumer preferences but also enhance the overall appeal of food products by ensuring they meet clean label standards.
Flavor Masking Food Additives Market Driver: Rising Demand for Nutritionally Fortified Foods and Beverages
The rising demand for nutritionally fortified foods and beverages is a major driver for the flavor masking food additives market. As consumers become more health-conscious, there is an increasing trend towards incorporating functional ingredients like vitamins, minerals, and plant-based proteins into their diets. However, these functional ingredients often come with strong, unpleasant flavors that can affect the palatability of the final product. Flavor masking additives are essential for improving the taste profile of fortified foods and beverages, making them more enjoyable for consumers and ensuring they meet their nutritional goals without compromising on taste.
Flavor Masking Food Additives Market Opportunity: Innovation in Multi-Functional and Customized Solutions
There is a significant opportunity for growth in the flavor masking food additives market through innovation in multi-functional and customized solutions. Companies can develop advanced masking agents that not only neutralize undesirable flavors but also enhance the overall sensory experience of food and beverages. This includes creating tailored solutions for specific applications, such as masking the bitterness of plant-based proteins, the metallic taste of fortified minerals, or the off-flavors in low-sugar products. By investing in research and development to offer versatile and effective flavor masking solutions, manufacturers can cater to the evolving demands of food producers and health-conscious consumers, driving market expansion and differentiation in the competitive landscape.
Flavor Masking Food Additives Market Share Analysis: Bitter segment generated the highest revenue share in the industry
Among the segments of the Flavor Masking Food Additives Market, the largest segment is Bitter Flavor masking additives. Bitter flavors can be challenging in food and beverage formulations, as they often need to be masked to improve overall taste and consumer acceptability. Bitter masking additives play a crucial role in enhancing the sensory profile of products without compromising their nutritional or functional benefits. They are extensively used in various food and beverage applications where bitterness needs to be masked effectively.
Flavor Masking Food Additives Market Share Analysis: Pharmaceuticals is the fastest growing segment over the forecast period to 2032
The fastest-growing segment in the Flavor Masking Food Additives Market by 2032 is Pharmaceuticals. This growth is driven by the increasing demand for taste-masking solutions in pharmaceutical formulations. Pharmaceutical products often contain active ingredients that have bitter or unpleasant tastes, which can affect patient compliance and adherence. Flavor masking food additives, particularly those designed to mask bitterness, are essential in pharmaceuticals to improve palatability and enhance patient experience. As the pharmaceutical industry continues to focus on patient-centric care and the development of consumer-friendly medications, the demand for effective flavor masking food additives is expected to rise significantly. This trend underscores the importance of taste-masking technologies in ensuring better therapeutic outcomes and patient satisfaction in the pharmaceutical sector.
Flavor Masking Food Additives Market Segmentation
By Type
Salt Flavor
Fat Flavor
Bitter Flavor
Others
By Application
Food & Beverages
Pharmaceuticals
Nutraceuticals
Others
Countries Analyzed
North America (US, Canada, Mexico)
Europe (Germany, UK, France, Spain, Italy, Russia, Rest of Europe)
Asia Pacific (China, India, Japan, South Korea, Australia, South East Asia, Rest of Asia)
South America (Brazil, Argentina, Rest of South America)
Middle East and Africa (Saudi Arabia, UAE, Rest of Middle East, South Africa, Egypt, Rest of Africa)
Flavor Masking Food Additives Companies Profiled in the Study
Archer-Daniels-Midland Company (ADM)
Cargill Inc
Carmi Flavour and Fragrance
Geo Specialty Chemicals
GPT Pharma
Keva Flavours Pvt. Ltd
Roquette Freres
Royal DSM N.V.
Sensient Technologies Corp
Symrise AG
*- List Not Exhaustive
Chapter 1. TABLE OF CONTENTS
Chapter 2. Introduction to Flavor Masking Food Additives Market
2.1. Market Overview
2.2. Key Statistics and Report Highlights
2.3. Scope of the Comprehensive Study
2.3.1. Market Definition
2.3.2 Countries and Regions Covered
2.3.3 Research Objective
2.3.4 Units, Currency, and Conversions
2.3.5 Industry Value Chain
2.4. Key Market Segments
2.5. Key Companies
2.6. Study Period
Chapter 3. Strategic Analysis Review
3.1. Flavor Masking Food Additives Pricing Analysis and Forecast
3.2. Porter’s Five Forces
3.3. Market Ecosystem
3.4. SWOT Analysis
3.5. Regulatory Scenario
3.3. Effects of Inflation, Russia-Ukraine War, moderating economic growth, and other macroeconomic factors
Chapter 4. Competitive Landscape
4.1. Market Share Analysis
4.1.1. Global Flavor Masking Food Additives Market Share by Company, 2023
4.1.2. Product Offerings of Leading Flavor Masking Food Additives Companies
4.2. Market Entropy
4.2.1. New Product Launches in the Industry
4.2.2. Mergers, Acquisitions, Joint ventures, and Partnerships
4.3. Key Strategies and Best Practices
Chapter 5. Global Market Projections: Best, Reference, and Low Case Scenarios
5.1. Growth Analysis- Case Scenario Definitions
5.2. Low Growth Case Scenario Forecasts
5.3. Reference Growth Case Scenario Forecasts
5.4. High Growth Case Scenario Forecasts
Chapter 6. Market Dynamics
6.1. Flavor Masking Food Additives Market Drivers
6.2. Flavor Masking Food Additives Market Challenges
6.6. Flavor Masking Food Additives Market Opportunities
6.4. Flavor Masking Food Additives Market Trends
Chapter 7. Global Flavor Masking Food Additives Market Outlook Trends
7.1. Global Flavor Masking Food Additives Revenue (USD Million) and CAGR (%) by Type (2021-2032)
7.2. Global Flavor Masking Food Additives Revenue (USD Million) and CAGR (%) by Application (2021-2032)
7.3. Global Flavor Masking Food Additives Revenue (USD Million) and CAGR (%) by Product (2021-2032)
By Type
Salt Flavor
Fat Flavor
Bitter Flavor
Others
By Application
Food & Beverages
Pharmaceuticals
Nutraceuticals
Others
Chapter 8. Global Flavor Masking Food Additives Regional Analysis and Outlook
8.1. Global Flavor Masking Food Additives Revenue (USD Million) By Regions (2021- 2032)
8.2. North America Flavor Masking Food Additives Revenue (USD Million) by Country (2021-2032)
8.2.1. United States Flavor Masking Food Additives Regional Analysis and Outlook
8.2.2. Canada Flavor Masking Food Additives Regional Analysis and Outlook
8.2.3. Mexico Flavor Masking Food Additives Regional Analysis and Outlook
8.3. Europe Flavor Masking Food Additives Revenue (USD Million), by Country (2021-2032)
8.3.1. Germany Flavor Masking Food Additives Regional Analysis and Outlook
8.3.2. France Flavor Masking Food Additives Regional Analysis and Outlook
8.3.3. United Kingdom Flavor Masking Food Additives Regional Analysis and Outlook
8.3.4. Spain Flavor Masking Food Additives Regional Analysis and Outlook
8.3.5. Italy Flavor Masking Food Additives Regional Analysis and Outlook
8.3.6. Russia Flavor Masking Food Additives Regional Analysis and Outlook
8.3.7. Rest of Europe Flavor Masking Food Additives Regional Analysis and Outlook
8.4. Asia Pacific Flavor Masking Food Additives Revenue (USD Million) by Country (2021-2032)
8.4.1. China Flavor Masking Food Additives Regional Analysis and Outlook
8.4.2. Japan Flavor Masking Food Additives Regional Analysis and Outlook
8.4.3. India Flavor Masking Food Additives Regional Analysis and Outlook
8.4.4. South Korea Flavor Masking Food Additives Regional Analysis and Outlook
8.4.5. Australia Flavor Masking Food Additives Regional Analysis and Outlook
8.4.6. South East Asia Flavor Masking Food Additives Regional Analysis and Outlook
8.4.7. Rest of Asia Pacific Flavor Masking Food Additives Regional Analysis and Outlook
8.5. South America Flavor Masking Food Additives Revenue (USD Million), by Country (2021-2032)
8.5.1. Brazil Flavor Masking Food Additives Regional Analysis and Outlook
8.5.2. Argentina Flavor Masking Food Additives Regional Analysis and Outlook
8.5.3. Rest of South America Flavor Masking Food Additives Regional Analysis and Outlook
8.6. Middle East and Africa Flavor Masking Food Additives Revenue (USD Million) by Country (2021-2032)
8.6.1. Middle East Flavor Masking Food Additives Regional Analysis and Outlook
8.6.2. Africa Flavor Masking Food Additives Regional Analysis and Outlook
Chapter 9. North America Flavor Masking Food Additives Analysis and Outlook
9.1. North America Flavor Masking Food Additives Revenue (USD Million) by Segments (2021-2032)
9.1.1. North America Flavor Masking Food Additives Revenue (USD Million) by Type (2021-2032)
9.1.2. North America Flavor Masking Food Additives Revenue (USD Million) by Application (2021-2032)
9.1.3. North America Flavor Masking Food Additives Revenue (USD Million) by Product (2021-2032)
By Type
Salt Flavor
Fat Flavor
Bitter Flavor
Others
By Application
Food & Beverages
Pharmaceuticals
Nutraceuticals
Others
Chapter 10. Europe Flavor Masking Food Additives Analysis and Outlook
10.1. Europe Flavor Masking Food Additives Revenue (USD Million), by Segments (USD Million) (2021-2032)
10.1.1. Europe Flavor Masking Food Additives Revenue (USD Million) by Type (2021-2032)
10.1.2. Europe Flavor Masking Food Additives Revenue (USD Million) by Application (2021-2032)
10.1.3. Europe Flavor Masking Food Additives Revenue (USD Million) by Product (2021-2032)
By Type
Salt Flavor
Fat Flavor
Bitter Flavor
Others
By Application
Food & Beverages
Pharmaceuticals
Nutraceuticals
Others
Chapter 11. Asia Pacific Flavor Masking Food Additives Analysis and Outlook
11.1. Asia Pacific Flavor Masking Food Additives Revenue (USD Million), and Revenue (USD Million) by Segments (2021-2032)
11.1.1. Asia Pacific Flavor Masking Food Additives Revenue (USD Million) by Type (2021-2032)
11.1.2. Asia Pacific Flavor Masking Food Additives Revenue (USD Million) by Application (2021-2032)
11.1.3. Asia Pacific Flavor Masking Food Additives Revenue (USD Million) by Product (2021-2032)
By Type
Salt Flavor
Fat Flavor
Bitter Flavor
Others
By Application
Food & Beverages
Pharmaceuticals
Nutraceuticals
Others
Chapter 12. South America Flavor Masking Food Additives Analysis and Outlook
12.1. South America Flavor Masking Food Additives Revenue (USD Million), by Segments (2021-2032)
12.1.1. South America Flavor Masking Food Additives Revenue (USD Million) by Type (2021-2032)
12.1.2. South America Flavor Masking Food Additives Revenue (USD Million) by Application (2021-2032)
12.1.3. South America Flavor Masking Food Additives Revenue (USD Million) by Product (2021-2032)
By Type
Salt Flavor
Fat Flavor
Bitter Flavor
Others
By Application
Food & Beverages
Pharmaceuticals
Nutraceuticals
Others
Chapter 13. Middle East and Africa Flavor Masking Food Additives Analysis and Outlook
13.1. Middle East and Africa Flavor Masking Food Additives Revenue (USD Million), by Segments (2021-2032)
13.1.1. Middle East and Africa Flavor Masking Food Additives Revenue (USD Million) by Type (2021-2032)
13.1.2. Middle East and Africa Flavor Masking Food Additives Revenue (USD Million) by Application (2021-2032)
13.1.3. Middle East and Africa Flavor Masking Food Additives Revenue (USD Million) by Product (2021-2032)
By Type
Salt Flavor
Fat Flavor
Bitter Flavor
Others
By Application
Food & Beverages
Pharmaceuticals
Nutraceuticals
Others
Chapter 14. Flavor Masking Food Additives Company Profiles
14.1 Business Overview
14.2 Product Profiles
14.3 SWOT Profiles
14.5 Recent Developments
14.6 Financial Profile
List of Companies
Archer-Daniels-Midland Company (ADM)
Cargill Inc
Carmi Flavour and Fragrance
Geo Specialty Chemicals
GPT Pharma
Keva Flavours Pvt. Ltd
Roquette Freres
Royal DSM N.V.
Sensient Technologies Corp
Symrise AG
15. Methodology and Data Sources
15.1 Customization Offerings
15.2 Subscription Services
15.3 Related Reports
15.4 Publisher Expertise
LIST OF TABLES
Table 1 Market Segmentation Analysis
Table 2 Global Flavor Masking Food Additives Market Share of Leading Companies, 2023
Table 3 Product Offerings of Leading Companies
Table 4 Low Growth Scenario Forecasts
Table 5 Reference Case Growth Scenario
Table 6 High Growth Case Scenario
Table 7 Global Flavor Masking Food Additives Revenue (USD Million) And CAGR (%) By Type (2021-2032)
Table 8 Global Flavor Masking Food Additives Revenue (USD Million) And CAGR (%) By Application (2021-2032)
Table 9 Global Flavor Masking Food Additives Revenue (USD Million) And CAGR (%) By Product (2021-2032)
Table 10 Global Flavor Masking Food Additives Market Revenue (USD Million) By Regions (2021-2032)
Table 11 Global Flavor Masking Food Additives Market Share (%) By Regions (2021-2032)
Table 12 North America Flavor Masking Food Additives Revenue (USD Million) By Country (2021-2032)
Table 13 Europe Flavor Masking Food Additives Revenue (USD Million) By Country (2021-2032)
Table 14 Asia Pacific Flavor Masking Food Additives Revenue (USD Million) By Country (2021-2032)
Table 15 South America Flavor Masking Food Additives Revenue (USD Million) By Country (2021-2032)
Table 16 Middle East and Africa Flavor Masking Food Additives Revenue (USD Million) By Region (2021-2032)
Table 17 North America Flavor Masking Food Additives Revenue (USD Million) By Type (2021-2032)
Table 18 North America Flavor Masking Food Additives Revenue (USD Million) By Application (2021-2032)
Table 19 North America Flavor Masking Food Additives Revenue (USD Million) By Product (2021-2032)
Table 20 Europe Flavor Masking Food Additives Revenue (USD Million) By Type (2021-2032)
Table 21 Europe Flavor Masking Food Additives Revenue (USD Million) By Application (2021-2032)
Table 22 Europe Flavor Masking Food Additives Revenue (USD Million) By Product (2021-2032)
Table 23 Asia Pacific Flavor Masking Food Additives Revenue (USD Million) By Type (2021-2032)
Table 24 Asia Pacific Flavor Masking Food Additives Revenue (USD Million) By Application (2021-2032)
Table 25 Asia Pacific Flavor Masking Food Additives Revenue (USD Million) By Product (2021-2032)
Table 26 South America Flavor Masking Food Additives Revenue (USD Million) By Type (2021-2032)
Table 27 South America Flavor Masking Food Additives Revenue (USD Million) By Application (2021-2032)
Table 28 South America Flavor Masking Food Additives Revenue (USD Million) By Product (2021-2032)
Table 29 Middle East and Africa Flavor Masking Food Additives Revenue (USD Million) By Type (2021-2032)
Table 30 Middle East and Africa Flavor Masking Food Additives Revenue (USD Million) By Application (2021-2032)
Table 31 Middle East and Africa Flavor Masking Food Additives Revenue (USD Million) By Product (2021-2032)
LIST OF FIGURES
Figure 1. Market Scope
Figure 2. Pricing Forecasts Per Unit, 2023- 2032
Figure 3. Porter’s Five Forces
Figure 4. Global Flavor Masking Food Additives Market Revenue (USD Million) By Regions (2021-2032)
Figure 5. Global Flavor Masking Food Additives Market Share (%) By Regions (2023)
Figure 6. North America Flavor Masking Food Additives Revenue (USD Million) By Country (2021-2032)
Figure 7. United States Flavor Masking Food Additives Revenue (USD Million) By Country (2021-2032)
Figure 8. Canada Flavor Masking Food Additives Revenue (USD Million) By Country (2021-2032)
Figure 9. Mexico Flavor Masking Food Additives Revenue (USD Million) By Country (2021-2032)
Figure 10. Europe Flavor Masking Food Additives Revenue (USD Million) By Country (2021-2032)
Figure 11. Germany Flavor Masking Food Additives Revenue (USD Million) By Country (2021-2032)
Figure 12. France Flavor Masking Food Additives Revenue (USD Million) By Country (2021-2032)
Figure 13. United Kingdom Flavor Masking Food Additives Revenue (USD Million) By Country (2021-2032)
Figure 14. Spain Flavor Masking Food Additives Revenue (USD Million) By Country (2021-2032)
Figure 15. Italy Flavor Masking Food Additives Revenue (USD Million) By Country (2021-2032)
Figure 16. Russia Flavor Masking Food Additives Revenue (USD Million) By Country (2021-2032)
Figure 17. Rest of Europe Flavor Masking Food Additives Revenue (USD Million) By Country (2021-2032)
Figure 11. Asia Pacific Flavor Masking Food Additives Revenue (USD Million) By Country (2021-2032)
Figure 12. China Flavor Masking Food Additives Revenue (USD Million) By Country (2021-2032)
Figure 13. Japan Flavor Masking Food Additives Revenue (USD Million) By Country (2021-2032)
Figure 14. India Flavor Masking Food Additives Revenue (USD Million) By Country (2021-2032)
Figure 15. South Korea Flavor Masking Food Additives Revenue (USD Million) By Country (2021-2032)
Figure 16. Australia Flavor Masking Food Additives Revenue (USD Million) By Country (2021-2032)
Figure 17. South East Asia Flavor Masking Food Additives Revenue (USD Million) By Country (2021-2032)
Figure 18. South America Flavor Masking Food Additives Revenue (USD Million) By Country (2021-2032)
Figure 19. Brazil Flavor Masking Food Additives Revenue (USD Million) By Country (2021-2032)
Figure 20. Argentina Flavor Masking Food Additives Revenue (USD Million) By Country (2021-2032)
Figure 21. Rest of Asia Pacific Flavor Masking Food Additives Revenue (USD Million) By Country (2021-2032)
Figure 22. Middle East and Africa Flavor Masking Food Additives Revenue (USD Million) By Region (2021-2032)
Figure 23. Saudi Arabia Flavor Masking Food Additives Revenue (USD Million) By Region (2021-2032)
Figure 24. The UAE Flavor Masking Food Additives Revenue (USD Million) By Region (2021-2032)
Figure 25. Rest of Middle East Flavor Masking Food Additives Revenue (USD Million) By Region (2021-2032)
Figure 26. South Africa Flavor Masking Food Additives Revenue (USD Million) By Region (2021-2032)
Figure 27. Africa Flavor Masking Food Additives Revenue (USD Million) By Region (2021-2032)
Figure 28. North America Flavor Masking Food Additives Revenue (USD Million) By Type (2021-2032)
Figure 29. North America Flavor Masking Food Additives Revenue (USD Million) By Application (2021-2032)
Figure 30. North America Flavor Masking Food Additives Revenue (USD Million) By Product (2021-2032)
Figure 31. Europe Flavor Masking Food Additives Revenue (USD Million) By Type (2021-2032)
Figure 32. Europe Flavor Masking Food Additives Revenue (USD Million) By Application (2021-2032)
Figure 33. Europe Flavor Masking Food Additives Revenue (USD Million) By Product (2021-2032)
Figure 34. Asia Pacific Flavor Masking Food Additives Revenue (USD Million) By Type (2021-2032)
Figure 35. Asia Pacific Flavor Masking Food Additives Revenue (USD Million) By Application (2021-2032)
Figure 36. Asia Pacific Flavor Masking Food Additives Revenue (USD Million) By Product (2021-2032)
Figure 37. South America Flavor Masking Food Additives Revenue (USD Million) By Type (2021-2032)
Figure 38. South America Flavor Masking Food Additives Revenue (USD Million) By Application (2021-2032)
Figure 39. South America Flavor Masking Food Additives Revenue (USD Million) By Product (2021-2032)
Figure 40. Middle East and Africa Flavor Masking Food Additives Revenue (USD Million) By Type (2021-2032)
Figure 41. Middle East and Africa Flavor Masking Food Additives Revenue (USD Million) By Application (2021-2032)
Figure 42. Middle East and Africa Flavor Masking Food Additives Revenue (USD Million) By Product (2021-2032)
By Type
Salt Flavor
Fat Flavor
Bitter Flavor
Others
By Application
Food & Beverages
Pharmaceuticals
Nutraceuticals
Others
Countries Analyzed
North America (US, Canada, Mexico)
Europe (Germany, UK, France, Spain, Italy, Russia, Rest of Europe)
Asia Pacific (China, India, Japan, South Korea, Australia, South East Asia, Rest of Asia)
South America (Brazil, Argentina, Rest of South America)
Middle East and Africa (Saudi Arabia, UAE, Rest of Middle East, South Africa, Egypt, Rest of Africa)
