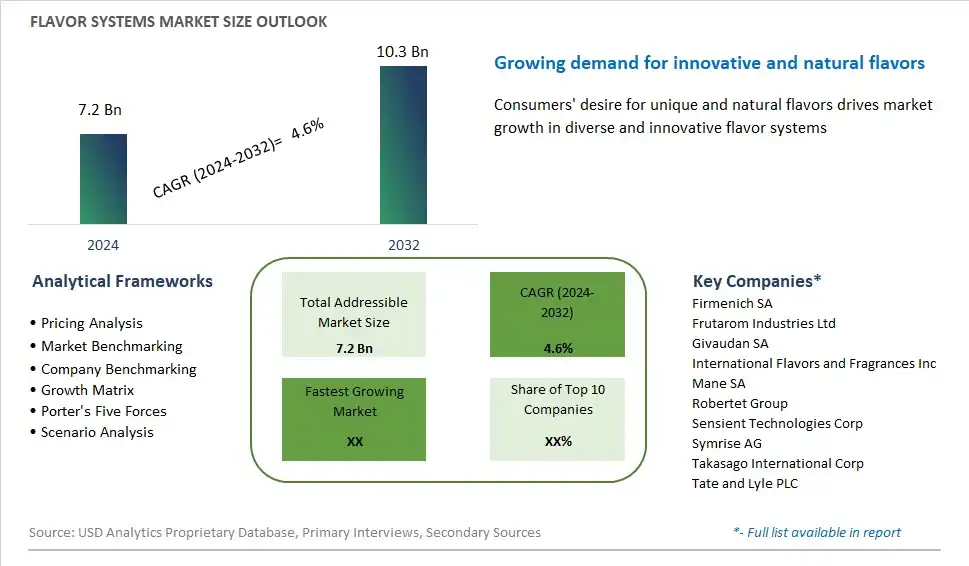
Global Flavor Systems Market Size is valued at $7.2 Billion in 2024 and is forecast to register a growth rate (CAGR) of 4.6% to reach $10.3 Billion by 2032.
The global Flavor Systems Market Comprehensive Study analyzes and forecasts the market size across 6 regions and 24 countries for diverse segments -By Type (Brown, Dairy, Herbs and Botanicals, Fruits and Vegetables, Others), By Source (Nature-Identical Flavors, Artificial Flavors, Natural Flavors), By Form (Liquid, Dry), By Application (Beverages, Dairy and Frozen Desserts, Bakery and Confectionery Products, Savories and Snacks)
An Introduction to Flavor Systems Market
Flavor systems are complex formulations of natural and artificial flavor compounds, enhancers, and modifiers designed to replicate or enhance the taste, aroma, and mouthfeel of foods and beverages in 2024. These systems are used by food and beverage manufacturers to create authentic, consistent, and appealing flavor profiles that meet consumer expectations and market trends. Whether developing savory seasonings, sweet syrups, or fruity beverage concentrates, flavor systems play a crucial role in product development, differentiation, and sensory optimization. With advancements in flavor science, ingredient technology, and consumer insights, flavor systems offer a diverse range of options, including single-source flavors, custom blends, and flavor masking agents, to meet the diverse needs and preferences of manufacturers and consumers. As consumer demand for natural, clean-label, and exotic flavors grows, the market for flavor systems is expected to expand, driven by innovation in flavor formulation, encapsulation, and delivery systems that enhance taste, aroma, and overall sensory experiences in food and beverage products.
Flavor Systems Competitive Landscape
The market report analyses the leading companies in the industry including Firmenich SA, Frutarom Industries Ltd, Givaudan SA, International Flavors and Fragrances Inc, Mane SA, Robertet Group, Sensient Technologies Corp, Symrise AG, Takasago International Corp, Tate and Lyle PLC, and Others.
Flavor Systems Market Dynamics
Flavor Systems Market Trend: Demand for Natural and Clean Label Ingredients
One prominent trend in the flavor systems market is the increasing demand for natural and clean label ingredients. Consumers are becoming more conscious about their food choices, seeking products made with ingredients perceived as natural, wholesome, and free from artificial additives. This trend is driving the food and beverage industry to reformulate products with natural flavoring ingredients such as plant extracts, fruit essences, and botanicals, while avoiding synthetic additives like artificial flavors, colors, and preservatives. As a result, flavor system manufacturers are focusing on developing and offering clean label solutions that meet consumer preferences for natural, transparent, and healthier food and beverage options.
Market Driver: Innovation and Product Differentiation in Food and Beverage Industry
A key driver fueling the growth of the flavor systems market is the continuous innovation and product differentiation efforts within the food and beverage industry. In today's highly competitive market landscape, food and beverage manufacturers are constantly seeking ways to differentiate their products and create unique sensory experiences to captivate consumers' taste preferences. Flavor systems play a critical role in this process by enabling manufacturers to develop distinctive flavor profiles, create novel taste sensations, and enhance product appeal. Whether it's introducing new exotic flavors, recreating nostalgic tastes, or catering to specific dietary preferences such as vegan or gluten-free, flavor systems offer the versatility and flexibility needed to innovate and stay ahead in the dynamic food and beverage market.
Market Opportunity: Expansion into Functional and Health-focused Ingredients
An opportunity within the flavor systems market lies in the expansion into functional and health-focused ingredients. With the growing consumer interest in health and wellness, there is a rising demand for food and beverage products that offer additional nutritional benefits beyond basic sustenance. Flavor system manufacturers can capitalize on this trend by incorporating functional ingredients such as vitamins, antioxidants, probiotics, and botanical extracts into their flavor formulations. By offering flavor systems that not only enhance taste but also provide functional health benefits, manufacturers can cater to the increasing demand for functional foods and beverages targeted towards specific health concerns such as immune support, gut health, and stress relief. This expansion into functional ingredients presents an opportunity for flavor system companies to diversify their product portfolios, tap into new market segments, and meet evolving consumer preferences for healthier and more nutritious food and beverage options.
Flavor Systems Market Share Analysis: Fruits and Vegetables Segment held the dominant market share in 2024
In the Flavor Systems market segmented by Type, the Fruits and Vegetables segment is the largest category. This dominance is attributed to the widespread use of fruit and vegetable flavors across various industries, including food and beverages, cosmetics, pharmaceuticals, and personal care. Fruits and vegetables offer a diverse range of flavors, aromas, and natural extracts, making them versatile ingredients for enhancing the taste, aroma, and nutritional profile of products. Further, the growing consumer preference for natural and clean label ingredients drives the demand for fruit and vegetable-based flavor systems. Additionally, the rising popularity of healthy and organic food products further amplifies the adoption of fruit and vegetable flavors. Furthermore, advancements in flavor encapsulation and extraction technologies enable manufacturers to create authentic and stable fruit and vegetable flavors, catering to evolving consumer preferences. As industries continue to innovate and diversify product offerings, the Fruits and Vegetables segment maintains its leadership position in the Flavor Systems market, driven by its wide-ranging applications and consumer appeal.
Flavor Systems Market Share Analysis: Natural Flavors Segment market is poised to register the fastest growth rae over the forecast period to 2032
In the Flavor Systems market segmented by Source, the Natural Flavors segment is the fastest-growing category. This accelerated growth is propelled by increasing consumer awareness and demand for clean label and natural products. Natural flavors, derived from plant and animal sources, are perceived as healthier and safer alternatives to artificial and nature-identical flavors, aligning with the clean label trend. Further, the preference for authentic and minimally processed ingredients drives the adoption of natural flavors across various industries, including food and beverages, cosmetics, and personal care. Additionally, stringent regulations and labeling requirements related to artificial additives and synthetic flavors further incentivize manufacturers to shift towards natural flavor solutions. Furthermore, the growing interest in ethnic and exotic flavor profiles, coupled with advancements in extraction and flavor enhancement technologies, contribute to the rapid growth of the Natural Flavors segment. As consumer preferences continue to evolve towards healthier and more natural options, the Natural Flavors segment is poised for sustained expansion, underscoring its significance in driving growth and innovation within the Flavor Systems market.
Flavor Systems Market Share Analysis: Liquid Form held the dominant market share in 2024
In the Flavor Systems market segmented by Form, the Liquid segment is the largest category. This dominance is attributed to several factors, including ease of incorporation, versatility, and superior sensory attributes offered by liquid flavor systems. Liquid flavors are preferred for their ability to seamlessly blend with various food and beverage matrices, allowing for precise dosage and consistent flavor delivery. Further, liquid flavor systems offer advantages such as rapid dispersion, enhanced solubility, and better stability compared to dry forms, making them ideal for a wide range of applications. Additionally, liquid flavors are favored in industries such as beverages, dairy, and confectionery, where uniform distribution and intense flavor profiles are essential for product differentiation and consumer satisfaction. Furthermore, technological advancements in liquid flavor encapsulation and emulsification techniques further bolster the dominance of the Liquid segment in the Flavor Systems market. As industries continue to innovate and cater to evolving consumer preferences, the Liquid Form segment maintains its leadership position, driving growth and innovation within the Flavor Systems market landscape.
Flavor Systems Market Segmentation
By Type
Brown
Dairy
Herbs and Botanicals
Fruits and Vegetables
Others
By Source
Nature-Identical Flavors
Artificial Flavors
Natural Flavors
By Form
Liquid
Dry
By Application
Beverages
Dairy and Frozen Desserts
Bakery and Confectionery Products
Savories and Snacks
Countries Analyzed
North America (US, Canada, Mexico)
Europe (Germany, UK, France, Spain, Italy, Russia, Rest of Europe)
Asia Pacific (China, India, Japan, South Korea, Australia, South East Asia, Rest of Asia)
South America (Brazil, Argentina, Rest of South America)
Middle East and Africa (Saudi Arabia, UAE, Rest of Middle East, South Africa, Egypt, Rest of Africa)
Flavor Systems Companies Profiled in the Study
Firmenich SA
Frutarom Industries Ltd
Givaudan SA
International Flavors and Fragrances Inc
Mane SA
Robertet Group
Sensient Technologies Corp
Symrise AG
Takasago International Corp
Tate and Lyle PLC
*- List Not Exhaustive
Chapter 1. TABLE OF CONTENTS
Chapter 2. Introduction to Flavor Systems Market
2.1. Market Overview
2.2. Key Statistics and Report Highlights
2.3. Scope of the Comprehensive Study
2.3.1. Market Definition
2.3.2 Countries and Regions Covered
2.3.3 Research Objective
2.3.4 Units, Currency, and Conversions
2.3.5 Industry Value Chain
2.4. Key Market Segments
2.5. Key Companies
2.6. Study Period
Chapter 3. Strategic Analysis Review
3.1. Flavor Systems Pricing Analysis and Forecast
3.2. Porter’s Five Forces
3.3. Market Ecosystem
3.4. SWOT Analysis
3.5. Regulatory Scenario
3.3. Effects of Inflation, Russia-Ukraine War, moderating economic growth, and other macroeconomic factors
Chapter 4. Competitive Landscape
4.1. Market Share Analysis
4.1.1. Global Flavor Systems Market Share by Company, 2023
4.1.2. Product Offerings of Leading Flavor Systems Companies
4.2. Market Entropy
4.2.1. New Product Launches in the Industry
4.2.2. Mergers, Acquisitions, Joint ventures, and Partnerships
4.3. Key Strategies and Best Practices
Chapter 5. Global Market Projections: Best, Reference, and Low Case Scenarios
5.1. Growth Analysis- Case Scenario Definitions
5.2. Low Growth Case Scenario Forecasts
5.3. Reference Growth Case Scenario Forecasts
5.4. High Growth Case Scenario Forecasts
Chapter 6. Market Dynamics
6.1. Flavor Systems Market Drivers
6.2. Flavor Systems Market Challenges
6.6. Flavor Systems Market Opportunities
6.4. Flavor Systems Market Trends
Chapter 7. Global Flavor Systems Market Outlook Trends
7.1. Global Flavor Systems Revenue (USD Million) and CAGR (%) by Type (2021-2032)
7.2. Global Flavor Systems Revenue (USD Million) and CAGR (%) by Application (2021-2032)
7.3. Global Flavor Systems Revenue (USD Million) and CAGR (%) by Product (2021-2032)
By Type
Brown
Dairy
Herbs and Botanicals
Fruits and Vegetables
Others
By Source
Nature-Identical Flavors
Artificial Flavors
Natural Flavors
By Form
Liquid
Dry
By Application
Beverages
Dairy and Frozen Desserts
Bakery and Confectionery Products
Savories and Snacks
Chapter 8. Global Flavor Systems Regional Analysis and Outlook
8.1. Global Flavor Systems Revenue (USD Million) By Regions (2021- 2032)
8.2. North America Flavor Systems Revenue (USD Million) by Country (2021-2032)
8.2.1. United States Flavor Systems Regional Analysis and Outlook
8.2.2. Canada Flavor Systems Regional Analysis and Outlook
8.2.3. Mexico Flavor Systems Regional Analysis and Outlook
8.3. Europe Flavor Systems Revenue (USD Million), by Country (2021-2032)
8.3.1. Germany Flavor Systems Regional Analysis and Outlook
8.3.2. France Flavor Systems Regional Analysis and Outlook
8.3.3. United Kingdom Flavor Systems Regional Analysis and Outlook
8.3.4. Spain Flavor Systems Regional Analysis and Outlook
8.3.5. Italy Flavor Systems Regional Analysis and Outlook
8.3.6. Russia Flavor Systems Regional Analysis and Outlook
8.3.7. Rest of Europe Flavor Systems Regional Analysis and Outlook
8.4. Asia Pacific Flavor Systems Revenue (USD Million) by Country (2021-2032)
8.4.1. China Flavor Systems Regional Analysis and Outlook
8.4.2. Japan Flavor Systems Regional Analysis and Outlook
8.4.3. India Flavor Systems Regional Analysis and Outlook
8.4.4. South Korea Flavor Systems Regional Analysis and Outlook
8.4.5. Australia Flavor Systems Regional Analysis and Outlook
8.4.6. South East Asia Flavor Systems Regional Analysis and Outlook
8.4.7. Rest of Asia Pacific Flavor Systems Regional Analysis and Outlook
8.5. South America Flavor Systems Revenue (USD Million), by Country (2021-2032)
8.5.1. Brazil Flavor Systems Regional Analysis and Outlook
8.5.2. Argentina Flavor Systems Regional Analysis and Outlook
8.5.3. Rest of South America Flavor Systems Regional Analysis and Outlook
8.6. Middle East and Africa Flavor Systems Revenue (USD Million) by Country (2021-2032)
8.6.1. Middle East Flavor Systems Regional Analysis and Outlook
8.6.2. Africa Flavor Systems Regional Analysis and Outlook
Chapter 9. North America Flavor Systems Analysis and Outlook
9.1. North America Flavor Systems Revenue (USD Million) by Segments (2021-2032)
9.1.1. North America Flavor Systems Revenue (USD Million) by Type (2021-2032)
9.1.2. North America Flavor Systems Revenue (USD Million) by Application (2021-2032)
9.1.3. North America Flavor Systems Revenue (USD Million) by Product (2021-2032)
By Type
Brown
Dairy
Herbs and Botanicals
Fruits and Vegetables
Others
By Source
Nature-Identical Flavors
Artificial Flavors
Natural Flavors
By Form
Liquid
Dry
By Application
Beverages
Dairy and Frozen Desserts
Bakery and Confectionery Products
Savories and Snacks
Chapter 10. Europe Flavor Systems Analysis and Outlook
10.1. Europe Flavor Systems Revenue (USD Million), by Segments (USD Million) (2021-2032)
10.1.1. Europe Flavor Systems Revenue (USD Million) by Type (2021-2032)
10.1.2. Europe Flavor Systems Revenue (USD Million) by Application (2021-2032)
10.1.3. Europe Flavor Systems Revenue (USD Million) by Product (2021-2032)
By Type
Brown
Dairy
Herbs and Botanicals
Fruits and Vegetables
Others
By Source
Nature-Identical Flavors
Artificial Flavors
Natural Flavors
By Form
Liquid
Dry
By Application
Beverages
Dairy and Frozen Desserts
Bakery and Confectionery Products
Savories and Snacks
Chapter 11. Asia Pacific Flavor Systems Analysis and Outlook
11.1. Asia Pacific Flavor Systems Revenue (USD Million), and Revenue (USD Million) by Segments (2021-2032)
11.1.1. Asia Pacific Flavor Systems Revenue (USD Million) by Type (2021-2032)
11.1.2. Asia Pacific Flavor Systems Revenue (USD Million) by Application (2021-2032)
11.1.3. Asia Pacific Flavor Systems Revenue (USD Million) by Product (2021-2032)
By Type
Brown
Dairy
Herbs and Botanicals
Fruits and Vegetables
Others
By Source
Nature-Identical Flavors
Artificial Flavors
Natural Flavors
By Form
Liquid
Dry
By Application
Beverages
Dairy and Frozen Desserts
Bakery and Confectionery Products
Savories and Snacks
Chapter 12. South America Flavor Systems Analysis and Outlook
12.1. South America Flavor Systems Revenue (USD Million), by Segments (2021-2032)
12.1.1. South America Flavor Systems Revenue (USD Million) by Type (2021-2032)
12.1.2. South America Flavor Systems Revenue (USD Million) by Application (2021-2032)
12.1.3. South America Flavor Systems Revenue (USD Million) by Product (2021-2032)
By Type
Brown
Dairy
Herbs and Botanicals
Fruits and Vegetables
Others
By Source
Nature-Identical Flavors
Artificial Flavors
Natural Flavors
By Form
Liquid
Dry
By Application
Beverages
Dairy and Frozen Desserts
Bakery and Confectionery Products
Savories and Snacks
Chapter 13. Middle East and Africa Flavor Systems Analysis and Outlook
13.1. Middle East and Africa Flavor Systems Revenue (USD Million), by Segments (2021-2032)
13.1.1. Middle East and Africa Flavor Systems Revenue (USD Million) by Type (2021-2032)
13.1.2. Middle East and Africa Flavor Systems Revenue (USD Million) by Application (2021-2032)
13.1.3. Middle East and Africa Flavor Systems Revenue (USD Million) by Product (2021-2032)
By Type
Brown
Dairy
Herbs and Botanicals
Fruits and Vegetables
Others
By Source
Nature-Identical Flavors
Artificial Flavors
Natural Flavors
By Form
Liquid
Dry
By Application
Beverages
Dairy and Frozen Desserts
Bakery and Confectionery Products
Savories and Snacks
Chapter 14. Flavor Systems Company Profiles
14.1 Business Overview
14.2 Product Profiles
14.3 SWOT Profiles
14.5 Recent Developments
14.6 Financial Profile
List of Companies
Firmenich SA
Frutarom Industries Ltd
Givaudan SA
International Flavors and Fragrances Inc
Mane SA
Robertet Group
Sensient Technologies Corp
Symrise AG
Takasago International Corp
Tate and Lyle PLC
15. Methodology and Data Sources
15.1 Customization Offerings
15.2 Subscription Services
15.3 Related Reports
15.4 Publisher Expertise
LIST OF TABLES
Table 1 Market Segmentation Analysis
Table 2 Global Flavor Systems Market Share of Leading Companies, 2023
Table 3 Product Offerings of Leading Companies
Table 4 Low Growth Scenario Forecasts
Table 5 Reference Case Growth Scenario
Table 6 High Growth Case Scenario
Table 7 Global Flavor Systems Revenue (USD Million) And CAGR (%) By Type (2021-2032)
Table 8 Global Flavor Systems Revenue (USD Million) And CAGR (%) By Application (2021-2032)
Table 9 Global Flavor Systems Revenue (USD Million) And CAGR (%) By Product (2021-2032)
Table 10 Global Flavor Systems Market Revenue (USD Million) By Regions (2021-2032)
Table 11 Global Flavor Systems Market Share (%) By Regions (2021-2032)
Table 12 North America Flavor Systems Revenue (USD Million) By Country (2021-2032)
Table 13 Europe Flavor Systems Revenue (USD Million) By Country (2021-2032)
Table 14 Asia Pacific Flavor Systems Revenue (USD Million) By Country (2021-2032)
Table 15 South America Flavor Systems Revenue (USD Million) By Country (2021-2032)
Table 16 Middle East and Africa Flavor Systems Revenue (USD Million) By Region (2021-2032)
Table 17 North America Flavor Systems Revenue (USD Million) By Type (2021-2032)
Table 18 North America Flavor Systems Revenue (USD Million) By Application (2021-2032)
Table 19 North America Flavor Systems Revenue (USD Million) By Product (2021-2032)
Table 20 Europe Flavor Systems Revenue (USD Million) By Type (2021-2032)
Table 21 Europe Flavor Systems Revenue (USD Million) By Application (2021-2032)
Table 22 Europe Flavor Systems Revenue (USD Million) By Product (2021-2032)
Table 23 Asia Pacific Flavor Systems Revenue (USD Million) By Type (2021-2032)
Table 24 Asia Pacific Flavor Systems Revenue (USD Million) By Application (2021-2032)
Table 25 Asia Pacific Flavor Systems Revenue (USD Million) By Product (2021-2032)
Table 26 South America Flavor Systems Revenue (USD Million) By Type (2021-2032)
Table 27 South America Flavor Systems Revenue (USD Million) By Application (2021-2032)
Table 28 South America Flavor Systems Revenue (USD Million) By Product (2021-2032)
Table 29 Middle East and Africa Flavor Systems Revenue (USD Million) By Type (2021-2032)
Table 30 Middle East and Africa Flavor Systems Revenue (USD Million) By Application (2021-2032)
Table 31 Middle East and Africa Flavor Systems Revenue (USD Million) By Product (2021-2032)
LIST OF FIGURES
Figure 1. Market Scope
Figure 2. Pricing Forecasts Per Unit, 2023- 2032
Figure 3. Porter’s Five Forces
Figure 4. Global Flavor Systems Market Revenue (USD Million) By Regions (2021-2032)
Figure 5. Global Flavor Systems Market Share (%) By Regions (2023)
Figure 6. North America Flavor Systems Revenue (USD Million) By Country (2021-2032)
Figure 7. United States Flavor Systems Revenue (USD Million) By Country (2021-2032)
Figure 8. Canada Flavor Systems Revenue (USD Million) By Country (2021-2032)
Figure 9. Mexico Flavor Systems Revenue (USD Million) By Country (2021-2032)
Figure 10. Europe Flavor Systems Revenue (USD Million) By Country (2021-2032)
Figure 11. Germany Flavor Systems Revenue (USD Million) By Country (2021-2032)
Figure 12. France Flavor Systems Revenue (USD Million) By Country (2021-2032)
Figure 13. United Kingdom Flavor Systems Revenue (USD Million) By Country (2021-2032)
Figure 14. Spain Flavor Systems Revenue (USD Million) By Country (2021-2032)
Figure 15. Italy Flavor Systems Revenue (USD Million) By Country (2021-2032)
Figure 16. Russia Flavor Systems Revenue (USD Million) By Country (2021-2032)
Figure 17. Rest of Europe Flavor Systems Revenue (USD Million) By Country (2021-2032)
Figure 11. Asia Pacific Flavor Systems Revenue (USD Million) By Country (2021-2032)
Figure 12. China Flavor Systems Revenue (USD Million) By Country (2021-2032)
Figure 13. Japan Flavor Systems Revenue (USD Million) By Country (2021-2032)
Figure 14. India Flavor Systems Revenue (USD Million) By Country (2021-2032)
Figure 15. South Korea Flavor Systems Revenue (USD Million) By Country (2021-2032)
Figure 16. Australia Flavor Systems Revenue (USD Million) By Country (2021-2032)
Figure 17. South East Asia Flavor Systems Revenue (USD Million) By Country (2021-2032)
Figure 18. South America Flavor Systems Revenue (USD Million) By Country (2021-2032)
Figure 19. Brazil Flavor Systems Revenue (USD Million) By Country (2021-2032)
Figure 20. Argentina Flavor Systems Revenue (USD Million) By Country (2021-2032)
Figure 21. Rest of Asia Pacific Flavor Systems Revenue (USD Million) By Country (2021-2032)
Figure 22. Middle East and Africa Flavor Systems Revenue (USD Million) By Region (2021-2032)
Figure 23. Saudi Arabia Flavor Systems Revenue (USD Million) By Region (2021-2032)
Figure 24. The UAE Flavor Systems Revenue (USD Million) By Region (2021-2032)
Figure 25. Rest of Middle East Flavor Systems Revenue (USD Million) By Region (2021-2032)
Figure 26. South Africa Flavor Systems Revenue (USD Million) By Region (2021-2032)
Figure 27. Africa Flavor Systems Revenue (USD Million) By Region (2021-2032)
Figure 28. North America Flavor Systems Revenue (USD Million) By Type (2021-2032)
Figure 29. North America Flavor Systems Revenue (USD Million) By Application (2021-2032)
Figure 30. North America Flavor Systems Revenue (USD Million) By Product (2021-2032)
Figure 31. Europe Flavor Systems Revenue (USD Million) By Type (2021-2032)
Figure 32. Europe Flavor Systems Revenue (USD Million) By Application (2021-2032)
Figure 33. Europe Flavor Systems Revenue (USD Million) By Product (2021-2032)
Figure 34. Asia Pacific Flavor Systems Revenue (USD Million) By Type (2021-2032)
Figure 35. Asia Pacific Flavor Systems Revenue (USD Million) By Application (2021-2032)
Figure 36. Asia Pacific Flavor Systems Revenue (USD Million) By Product (2021-2032)
Figure 37. South America Flavor Systems Revenue (USD Million) By Type (2021-2032)
Figure 38. South America Flavor Systems Revenue (USD Million) By Application (2021-2032)
Figure 39. South America Flavor Systems Revenue (USD Million) By Product (2021-2032)
Figure 40. Middle East and Africa Flavor Systems Revenue (USD Million) By Type (2021-2032)
Figure 41. Middle East and Africa Flavor Systems Revenue (USD Million) By Application (2021-2032)
Figure 42. Middle East and Africa Flavor Systems Revenue (USD Million) By Product (2021-2032)
By Type
Brown
Dairy
Herbs and Botanicals
Fruits and Vegetables
Others
By Source
Nature-Identical Flavors
Artificial Flavors
Natural Flavors
By Form
Liquid
Dry
By Application
Beverages
Dairy and Frozen Desserts
Bakery and Confectionery Products
Savories and Snacks
Countries Analyzed
North America (US, Canada, Mexico)
Europe (Germany, UK, France, Spain, Italy, Russia, Rest of Europe)
Asia Pacific (China, India, Japan, South Korea, Australia, South East Asia, Rest of Asia)
South America (Brazil, Argentina, Rest of South America)
Middle East and Africa (Saudi Arabia, UAE, Rest of Middle East, South Africa, Egypt, Rest of Africa)
