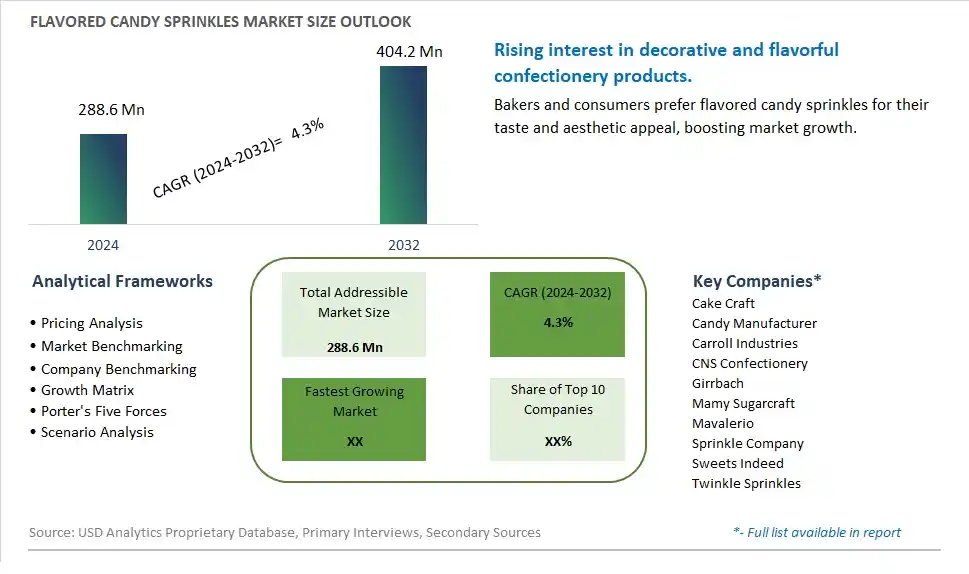
Global Flavored Candy Sprinkles Market Size is valued at $288.6 Million in 2024 and is forecast to register a growth rate (CAGR) of 4.3% to reach $404.2 Million by 2032.
The global Flavored Candy Sprinkles Market Comprehensive Study analyzes and forecasts the market size across 6 regions and 24 countries for diverse segments -By Type (Sequins, Needles, Beads, Others), By Application (Cakes, Ice Creams, Others)
An Introduction to Flavored Candy Sprinkles Market
The Flavored Candy Sprinkles market in 2024 is experiencing significant growth, driven by the increasing demand for decorative and flavor-enhancing confectionery toppings. Flavored candy sprinkles, used to add texture, color, and taste to desserts, baked goods, and ice creams, are popular among consumers of all ages. The market benefits from advancements in confectionery manufacturing technologies, the growing trend of home baking and DIY dessert decoration, and the expansion of the global confectionery market. Additionally, the rising focus on innovative flavors and natural ingredients is contributing to market growth.
Flavored Candy Sprinkles Competitive Landscape
The market report analyses the leading companies in the industry including Cake Craft, Candy Manufacturer, Carroll Industries, CNS Confectionery, Girrbach, Mamy Sugarcraft, Mavalerio, Sprinkle Company, Sweets Indeed, Twinkle Sprinkles, and Others.
Flavored Candy Sprinkles Market Dynamics
Flavored Candy Sprinkles Market Trend: Increasing Demand for Premium and Novelty Sprinkles
The flavored candy sprinkles market is experiencing a significant trend towards increasing demand for premium and novelty sprinkles. Consumers, particularly in the baking and confectionery segments, are seeking unique and visually appealing products that enhance the aesthetic and taste of their creations. This trend is driven by the rise of social media platforms like Instagram and Pinterest, where visually striking and creatively decorated foods gain significant attention. As a result, there is a growing market for high-quality, gourmet sprinkles with innovative flavors and designs that cater to both home bakers and professional chefs looking to elevate their culinary presentations.
Flavored Candy Sprinkles Market Driver: Growing Popularity of Home Baking and DIY Food Decorations
The growing popularity of home baking and DIY food decorations is a major driver for the flavored candy sprinkles market. The COVID-19 pandemic has fueled a surge in home baking as people spent more time at home and sought creative and enjoyable activities. This trend has continued, with many consumers discovering a lasting passion for baking and decorating their own treats. Flavored candy sprinkles, which add both visual appeal and taste, are in high demand among these home bakers who want to personalize and enhance their homemade desserts. Additionally, baking shows and online tutorials have further inspired consumers to experiment with decorative elements, boosting the demand for a wide variety of sprinkles.
Flavored Candy Sprinkles Market Opportunity: Expansion into Health-Conscious and Specialty Diet Markets
There is a significant opportunity for growth in the flavored candy sprinkles market through expansion into health-conscious and specialty diet markets. Companies can innovate by developing sprinkles that cater to specific dietary preferences and health trends, such as organic, gluten-free, low-sugar, and vegan options. By using natural colors and flavors, manufacturers can appeal to consumers who prioritize clean label products and are looking to indulge in healthier ways. Additionally, introducing functional sprinkles enriched with vitamins, minerals, or superfoods can attract health-conscious consumers seeking to add nutritional benefits to their treats. By addressing these niche markets, businesses can differentiate their products, capture new consumer segments, and drive market expansion.
Flavored Candy Sprinkles Market Share Analysis: Sequins segment generated the highest revenue share in the industry
Within the Flavored Candy Sprinkles Market, the largest segment is Sequins. Sequins are widely used as decorative elements in various confectionery products due to their versatility and visual appeal. They come in different shapes, sizes, and colors, offering decorators and consumers options to enhance the aesthetic appeal of cakes, cupcakes, cookies, and other baked goods. Sequins are favored for their ability to add sparkle and texture, making them popular in both home baking and professional bakery settings. Their ease of application and ability to complement different flavors and themes contribute to their widespread use across the confectionery industry.
Flavored Candy Sprinkles Market Share Analysis: Ice Creams is the fastest growing segment over the forecast period to 2032
The fastest-growing segment in the Flavored Candy Sprinkles Market by 2032 is Ice Creams. Flavored candy sprinkles are increasingly used to adorn ice creams, enhancing their visual appeal and adding texture to the creamy base. Ice cream manufacturers and retailers are constantly innovating to attract consumers with new flavors and exciting visual presentations. Sprinkles offer a simple yet effective way to customize ice cream products, catering to diverse consumer preferences and seasonal trends. The growing popularity of gourmet and artisanal ice creams further drives the demand for flavored candy sprinkles, as they provide opportunities for creative and Instagram-worthy desserts that appeal to a broad audience.
Flavored Candy Sprinkles Market Segmentation
By Type
Sequins
Needles
Beads
Others
By Application
Cakes
Ice Creams
Others
Countries Analyzed
North America (US, Canada, Mexico)
Europe (Germany, UK, France, Spain, Italy, Russia, Rest of Europe)
Asia Pacific (China, India, Japan, South Korea, Australia, South East Asia, Rest of Asia)
South America (Brazil, Argentina, Rest of South America)
Middle East and Africa (Saudi Arabia, UAE, Rest of Middle East, South Africa, Egypt, Rest of Africa)
Flavored Candy Sprinkles Companies Profiled in the Study
Cake Craft
Candy Manufacturer
Carroll Industries
CNS Confectionery
Girrbach
Mamy Sugarcraft
Mavalerio
Sprinkle Company
Sweets Indeed
Twinkle Sprinkles
*- List Not Exhaustive
Chapter 1. TABLE OF CONTENTS
Chapter 2. Introduction to Flavored Candy Sprinkles Market
2.1. Market Overview
2.2. Key Statistics and Report Highlights
2.3. Scope of the Comprehensive Study
2.3.1. Market Definition
2.3.2 Countries and Regions Covered
2.3.3 Research Objective
2.3.4 Units, Currency, and Conversions
2.3.5 Industry Value Chain
2.4. Key Market Segments
2.5. Key Companies
2.6. Study Period
Chapter 3. Strategic Analysis Review
3.1. Flavored Candy Sprinkles Pricing Analysis and Forecast
3.2. Porter’s Five Forces
3.3. Market Ecosystem
3.4. SWOT Analysis
3.5. Regulatory Scenario
3.3. Effects of Inflation, Russia-Ukraine War, moderating economic growth, and other macroeconomic factors
Chapter 4. Competitive Landscape
4.1. Market Share Analysis
4.1.1. Global Flavored Candy Sprinkles Market Share by Company, 2023
4.1.2. Product Offerings of Leading Flavored Candy Sprinkles Companies
4.2. Market Entropy
4.2.1. New Product Launches in the Industry
4.2.2. Mergers, Acquisitions, Joint ventures, and Partnerships
4.3. Key Strategies and Best Practices
Chapter 5. Global Market Projections: Best, Reference, and Low Case Scenarios
5.1. Growth Analysis- Case Scenario Definitions
5.2. Low Growth Case Scenario Forecasts
5.3. Reference Growth Case Scenario Forecasts
5.4. High Growth Case Scenario Forecasts
Chapter 6. Market Dynamics
6.1. Flavored Candy Sprinkles Market Drivers
6.2. Flavored Candy Sprinkles Market Challenges
6.6. Flavored Candy Sprinkles Market Opportunities
6.4. Flavored Candy Sprinkles Market Trends
Chapter 7. Global Flavored Candy Sprinkles Market Outlook Trends
7.1. Global Flavored Candy Sprinkles Revenue (USD Million) and CAGR (%) by Type (2021-2032)
7.2. Global Flavored Candy Sprinkles Revenue (USD Million) and CAGR (%) by Application (2021-2032)
7.3. Global Flavored Candy Sprinkles Revenue (USD Million) and CAGR (%) by Product (2021-2032)
By Type
Sequins
Needles
Beads
Others
By Application
Cakes
Ice Creams
Others
Chapter 8. Global Flavored Candy Sprinkles Regional Analysis and Outlook
8.1. Global Flavored Candy Sprinkles Revenue (USD Million) By Regions (2021- 2032)
8.2. North America Flavored Candy Sprinkles Revenue (USD Million) by Country (2021-2032)
8.2.1. United States Flavored Candy Sprinkles Regional Analysis and Outlook
8.2.2. Canada Flavored Candy Sprinkles Regional Analysis and Outlook
8.2.3. Mexico Flavored Candy Sprinkles Regional Analysis and Outlook
8.3. Europe Flavored Candy Sprinkles Revenue (USD Million), by Country (2021-2032)
8.3.1. Germany Flavored Candy Sprinkles Regional Analysis and Outlook
8.3.2. France Flavored Candy Sprinkles Regional Analysis and Outlook
8.3.3. United Kingdom Flavored Candy Sprinkles Regional Analysis and Outlook
8.3.4. Spain Flavored Candy Sprinkles Regional Analysis and Outlook
8.3.5. Italy Flavored Candy Sprinkles Regional Analysis and Outlook
8.3.6. Russia Flavored Candy Sprinkles Regional Analysis and Outlook
8.3.7. Rest of Europe Flavored Candy Sprinkles Regional Analysis and Outlook
8.4. Asia Pacific Flavored Candy Sprinkles Revenue (USD Million) by Country (2021-2032)
8.4.1. China Flavored Candy Sprinkles Regional Analysis and Outlook
8.4.2. Japan Flavored Candy Sprinkles Regional Analysis and Outlook
8.4.3. India Flavored Candy Sprinkles Regional Analysis and Outlook
8.4.4. South Korea Flavored Candy Sprinkles Regional Analysis and Outlook
8.4.5. Australia Flavored Candy Sprinkles Regional Analysis and Outlook
8.4.6. South East Asia Flavored Candy Sprinkles Regional Analysis and Outlook
8.4.7. Rest of Asia Pacific Flavored Candy Sprinkles Regional Analysis and Outlook
8.5. South America Flavored Candy Sprinkles Revenue (USD Million), by Country (2021-2032)
8.5.1. Brazil Flavored Candy Sprinkles Regional Analysis and Outlook
8.5.2. Argentina Flavored Candy Sprinkles Regional Analysis and Outlook
8.5.3. Rest of South America Flavored Candy Sprinkles Regional Analysis and Outlook
8.6. Middle East and Africa Flavored Candy Sprinkles Revenue (USD Million) by Country (2021-2032)
8.6.1. Middle East Flavored Candy Sprinkles Regional Analysis and Outlook
8.6.2. Africa Flavored Candy Sprinkles Regional Analysis and Outlook
Chapter 9. North America Flavored Candy Sprinkles Analysis and Outlook
9.1. North America Flavored Candy Sprinkles Revenue (USD Million) by Segments (2021-2032)
9.1.1. North America Flavored Candy Sprinkles Revenue (USD Million) by Type (2021-2032)
9.1.2. North America Flavored Candy Sprinkles Revenue (USD Million) by Application (2021-2032)
9.1.3. North America Flavored Candy Sprinkles Revenue (USD Million) by Product (2021-2032)
By Type
Sequins
Needles
Beads
Others
By Application
Cakes
Ice Creams
Others
Chapter 10. Europe Flavored Candy Sprinkles Analysis and Outlook
10.1. Europe Flavored Candy Sprinkles Revenue (USD Million), by Segments (USD Million) (2021-2032)
10.1.1. Europe Flavored Candy Sprinkles Revenue (USD Million) by Type (2021-2032)
10.1.2. Europe Flavored Candy Sprinkles Revenue (USD Million) by Application (2021-2032)
10.1.3. Europe Flavored Candy Sprinkles Revenue (USD Million) by Product (2021-2032)
By Type
Sequins
Needles
Beads
Others
By Application
Cakes
Ice Creams
Others
Chapter 11. Asia Pacific Flavored Candy Sprinkles Analysis and Outlook
11.1. Asia Pacific Flavored Candy Sprinkles Revenue (USD Million), and Revenue (USD Million) by Segments (2021-2032)
11.1.1. Asia Pacific Flavored Candy Sprinkles Revenue (USD Million) by Type (2021-2032)
11.1.2. Asia Pacific Flavored Candy Sprinkles Revenue (USD Million) by Application (2021-2032)
11.1.3. Asia Pacific Flavored Candy Sprinkles Revenue (USD Million) by Product (2021-2032)
By Type
Sequins
Needles
Beads
Others
By Application
Cakes
Ice Creams
Others
Chapter 12. South America Flavored Candy Sprinkles Analysis and Outlook
12.1. South America Flavored Candy Sprinkles Revenue (USD Million), by Segments (2021-2032)
12.1.1. South America Flavored Candy Sprinkles Revenue (USD Million) by Type (2021-2032)
12.1.2. South America Flavored Candy Sprinkles Revenue (USD Million) by Application (2021-2032)
12.1.3. South America Flavored Candy Sprinkles Revenue (USD Million) by Product (2021-2032)
By Type
Sequins
Needles
Beads
Others
By Application
Cakes
Ice Creams
Others
Chapter 13. Middle East and Africa Flavored Candy Sprinkles Analysis and Outlook
13.1. Middle East and Africa Flavored Candy Sprinkles Revenue (USD Million), by Segments (2021-2032)
13.1.1. Middle East and Africa Flavored Candy Sprinkles Revenue (USD Million) by Type (2021-2032)
13.1.2. Middle East and Africa Flavored Candy Sprinkles Revenue (USD Million) by Application (2021-2032)
13.1.3. Middle East and Africa Flavored Candy Sprinkles Revenue (USD Million) by Product (2021-2032)
By Type
Sequins
Needles
Beads
Others
By Application
Cakes
Ice Creams
Others
Chapter 14. Flavored Candy Sprinkles Company Profiles
14.1 Business Overview
14.2 Product Profiles
14.3 SWOT Profiles
14.5 Recent Developments
14.6 Financial Profile
List of Companies
Cake Craft
Candy Manufacturer
Carroll Industries
CNS Confectionery
Girrbach
Mamy Sugarcraft
Mavalerio
Sprinkle Company
Sweets Indeed
Twinkle Sprinkles
15. Methodology and Data Sources
15.1 Customization Offerings
15.2 Subscription Services
15.3 Related Reports
15.4 Publisher Expertise
LIST OF TABLES
Table 1 Market Segmentation Analysis
Table 2 Global Flavored Candy Sprinkles Market Share of Leading Companies, 2023
Table 3 Product Offerings of Leading Companies
Table 4 Low Growth Scenario Forecasts
Table 5 Reference Case Growth Scenario
Table 6 High Growth Case Scenario
Table 7 Global Flavored Candy Sprinkles Revenue (USD Million) And CAGR (%) By Type (2021-2032)
Table 8 Global Flavored Candy Sprinkles Revenue (USD Million) And CAGR (%) By Application (2021-2032)
Table 9 Global Flavored Candy Sprinkles Revenue (USD Million) And CAGR (%) By Product (2021-2032)
Table 10 Global Flavored Candy Sprinkles Market Revenue (USD Million) By Regions (2021-2032)
Table 11 Global Flavored Candy Sprinkles Market Share (%) By Regions (2021-2032)
Table 12 North America Flavored Candy Sprinkles Revenue (USD Million) By Country (2021-2032)
Table 13 Europe Flavored Candy Sprinkles Revenue (USD Million) By Country (2021-2032)
Table 14 Asia Pacific Flavored Candy Sprinkles Revenue (USD Million) By Country (2021-2032)
Table 15 South America Flavored Candy Sprinkles Revenue (USD Million) By Country (2021-2032)
Table 16 Middle East and Africa Flavored Candy Sprinkles Revenue (USD Million) By Region (2021-2032)
Table 17 North America Flavored Candy Sprinkles Revenue (USD Million) By Type (2021-2032)
Table 18 North America Flavored Candy Sprinkles Revenue (USD Million) By Application (2021-2032)
Table 19 North America Flavored Candy Sprinkles Revenue (USD Million) By Product (2021-2032)
Table 20 Europe Flavored Candy Sprinkles Revenue (USD Million) By Type (2021-2032)
Table 21 Europe Flavored Candy Sprinkles Revenue (USD Million) By Application (2021-2032)
Table 22 Europe Flavored Candy Sprinkles Revenue (USD Million) By Product (2021-2032)
Table 23 Asia Pacific Flavored Candy Sprinkles Revenue (USD Million) By Type (2021-2032)
Table 24 Asia Pacific Flavored Candy Sprinkles Revenue (USD Million) By Application (2021-2032)
Table 25 Asia Pacific Flavored Candy Sprinkles Revenue (USD Million) By Product (2021-2032)
Table 26 South America Flavored Candy Sprinkles Revenue (USD Million) By Type (2021-2032)
Table 27 South America Flavored Candy Sprinkles Revenue (USD Million) By Application (2021-2032)
Table 28 South America Flavored Candy Sprinkles Revenue (USD Million) By Product (2021-2032)
Table 29 Middle East and Africa Flavored Candy Sprinkles Revenue (USD Million) By Type (2021-2032)
Table 30 Middle East and Africa Flavored Candy Sprinkles Revenue (USD Million) By Application (2021-2032)
Table 31 Middle East and Africa Flavored Candy Sprinkles Revenue (USD Million) By Product (2021-2032)
LIST OF FIGURES
Figure 1. Market Scope
Figure 2. Pricing Forecasts Per Unit, 2023- 2032
Figure 3. Porter’s Five Forces
Figure 4. Global Flavored Candy Sprinkles Market Revenue (USD Million) By Regions (2021-2032)
Figure 5. Global Flavored Candy Sprinkles Market Share (%) By Regions (2023)
Figure 6. North America Flavored Candy Sprinkles Revenue (USD Million) By Country (2021-2032)
Figure 7. United States Flavored Candy Sprinkles Revenue (USD Million) By Country (2021-2032)
Figure 8. Canada Flavored Candy Sprinkles Revenue (USD Million) By Country (2021-2032)
Figure 9. Mexico Flavored Candy Sprinkles Revenue (USD Million) By Country (2021-2032)
Figure 10. Europe Flavored Candy Sprinkles Revenue (USD Million) By Country (2021-2032)
Figure 11. Germany Flavored Candy Sprinkles Revenue (USD Million) By Country (2021-2032)
Figure 12. France Flavored Candy Sprinkles Revenue (USD Million) By Country (2021-2032)
Figure 13. United Kingdom Flavored Candy Sprinkles Revenue (USD Million) By Country (2021-2032)
Figure 14. Spain Flavored Candy Sprinkles Revenue (USD Million) By Country (2021-2032)
Figure 15. Italy Flavored Candy Sprinkles Revenue (USD Million) By Country (2021-2032)
Figure 16. Russia Flavored Candy Sprinkles Revenue (USD Million) By Country (2021-2032)
Figure 17. Rest of Europe Flavored Candy Sprinkles Revenue (USD Million) By Country (2021-2032)
Figure 11. Asia Pacific Flavored Candy Sprinkles Revenue (USD Million) By Country (2021-2032)
Figure 12. China Flavored Candy Sprinkles Revenue (USD Million) By Country (2021-2032)
Figure 13. Japan Flavored Candy Sprinkles Revenue (USD Million) By Country (2021-2032)
Figure 14. India Flavored Candy Sprinkles Revenue (USD Million) By Country (2021-2032)
Figure 15. South Korea Flavored Candy Sprinkles Revenue (USD Million) By Country (2021-2032)
Figure 16. Australia Flavored Candy Sprinkles Revenue (USD Million) By Country (2021-2032)
Figure 17. South East Asia Flavored Candy Sprinkles Revenue (USD Million) By Country (2021-2032)
Figure 18. South America Flavored Candy Sprinkles Revenue (USD Million) By Country (2021-2032)
Figure 19. Brazil Flavored Candy Sprinkles Revenue (USD Million) By Country (2021-2032)
Figure 20. Argentina Flavored Candy Sprinkles Revenue (USD Million) By Country (2021-2032)
Figure 21. Rest of Asia Pacific Flavored Candy Sprinkles Revenue (USD Million) By Country (2021-2032)
Figure 22. Middle East and Africa Flavored Candy Sprinkles Revenue (USD Million) By Region (2021-2032)
Figure 23. Saudi Arabia Flavored Candy Sprinkles Revenue (USD Million) By Region (2021-2032)
Figure 24. The UAE Flavored Candy Sprinkles Revenue (USD Million) By Region (2021-2032)
Figure 25. Rest of Middle East Flavored Candy Sprinkles Revenue (USD Million) By Region (2021-2032)
Figure 26. South Africa Flavored Candy Sprinkles Revenue (USD Million) By Region (2021-2032)
Figure 27. Africa Flavored Candy Sprinkles Revenue (USD Million) By Region (2021-2032)
Figure 28. North America Flavored Candy Sprinkles Revenue (USD Million) By Type (2021-2032)
Figure 29. North America Flavored Candy Sprinkles Revenue (USD Million) By Application (2021-2032)
Figure 30. North America Flavored Candy Sprinkles Revenue (USD Million) By Product (2021-2032)
Figure 31. Europe Flavored Candy Sprinkles Revenue (USD Million) By Type (2021-2032)
Figure 32. Europe Flavored Candy Sprinkles Revenue (USD Million) By Application (2021-2032)
Figure 33. Europe Flavored Candy Sprinkles Revenue (USD Million) By Product (2021-2032)
Figure 34. Asia Pacific Flavored Candy Sprinkles Revenue (USD Million) By Type (2021-2032)
Figure 35. Asia Pacific Flavored Candy Sprinkles Revenue (USD Million) By Application (2021-2032)
Figure 36. Asia Pacific Flavored Candy Sprinkles Revenue (USD Million) By Product (2021-2032)
Figure 37. South America Flavored Candy Sprinkles Revenue (USD Million) By Type (2021-2032)
Figure 38. South America Flavored Candy Sprinkles Revenue (USD Million) By Application (2021-2032)
Figure 39. South America Flavored Candy Sprinkles Revenue (USD Million) By Product (2021-2032)
Figure 40. Middle East and Africa Flavored Candy Sprinkles Revenue (USD Million) By Type (2021-2032)
Figure 41. Middle East and Africa Flavored Candy Sprinkles Revenue (USD Million) By Application (2021-2032)
Figure 42. Middle East and Africa Flavored Candy Sprinkles Revenue (USD Million) By Product (2021-2032)
By Type
Sequins
Needles
Beads
Others
By Application
Cakes
Ice Creams
Others
Countries Analyzed
North America (US, Canada, Mexico)
Europe (Germany, UK, France, Spain, Italy, Russia, Rest of Europe)
Asia Pacific (China, India, Japan, South Korea, Australia, South East Asia, Rest of Asia)
South America (Brazil, Argentina, Rest of South America)
Middle East and Africa (Saudi Arabia, UAE, Rest of Middle East, South Africa, Egypt, Rest of Africa)
