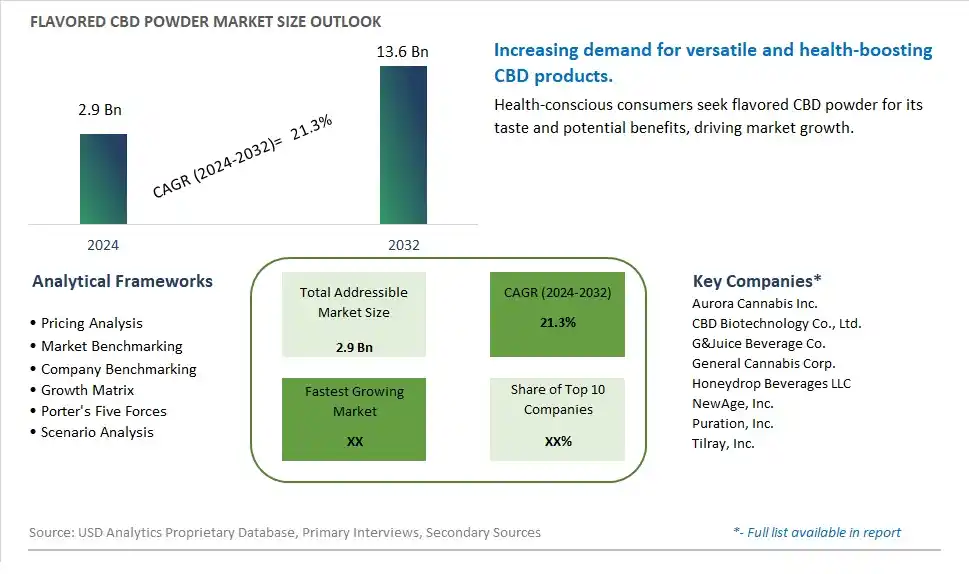
Global Flavored CBD Powder Market Size is valued at $2.9 Billion in 2024 and is forecast to register a growth rate (CAGR) of 21.3% to reach $13.6 Billion by 2032.
The global Flavored CBD Powder Market Comprehensive Study analyzes and forecasts the market size across 6 regions and 24 countries for diverse segments -By Product (Alcoholic, Non-Alcoholic), By Type (Organic, Conventional), By CBD (Hemp-Derived, Marijuana-Derived, Synthetic)
An Introduction to Flavored CBD Powder Market
In 2024, the Flavored CBD Powder market is thriving, fueled by the rising demand for cannabidiol (CBD) products with enhanced taste and versatility. Flavored CBD powders, used in beverages, foods, and supplements, offer the benefits of CBD with pleasant flavors that appeal to a wide range of consumers. The market benefits from advancements in CBD extraction and formulation technologies, the growing trend of health and wellness, and the expansion of the functional food and beverage sectors. Additionally, the increasing awareness of the therapeutic benefits of CBD is driving market growth.
Flavored CBD Powder Competitive Landscape
The market report analyses the leading companies in the industry including Aurora Cannabis Inc., CBD Biotechnology Co., Ltd., G&Juice Beverage Co., General Cannabis Corp., Honeydrop Beverages LLC, NewAge, Inc., Puration, Inc., Tilray, Inc., and Others.
Flavored CBD Powder Market Dynamics
Flavored CBD Powder Market Trend: Increasing Popularity of Wellness and Functional Beverages
The flavored CBD powder market is experiencing a significant trend towards the increasing popularity of wellness and functional beverages. Consumers are increasingly incorporating CBD into their daily routines for its potential health benefits, including stress relief, improved sleep, and pain management. Flavored CBD powder, which can be easily mixed into drinks like smoothies, teas, and water, is becoming a favored option for those seeking convenient and enjoyable ways to consume CBD. This trend is driven by the growing awareness and acceptance of CBD as a wellness supplement, along with the desire for customizable and palatable health solutions.
Flavored CBD Powder Market Driver: Rising Demand for Natural and Plant-Based Products
The rising demand for natural and plant-based products is a major driver for the flavored CBD powder market. As consumers become more health-conscious and environmentally aware, they are seeking out products derived from natural sources that align with their wellness goals and ethical values. CBD, a naturally occurring compound found in hemp, fits well within this demand for plant-based health solutions. The trend towards clean label products, free from artificial additives and chemicals, is also boosting the appeal of flavored CBD powders, which offer a natural alternative to synthetic supplements.
Flavored CBD Powder Market Opportunity: Innovation in Flavor Profiles and Functional Blends
There is a significant opportunity for growth in the flavored CBD powder market through innovation in flavor profiles and functional blends. Companies can develop unique and appealing flavors that cater to diverse consumer tastes, such as tropical fruits, berries, and herbs. Additionally, creating functional blends that combine CBD with other beneficial ingredients like adaptogens, vitamins, and minerals can enhance the product's appeal to health-conscious consumers looking for multi-functional wellness solutions. By offering a variety of flavors and health benefits, manufacturers can attract a broader audience, differentiate their products in a competitive market, and drive consumer loyalty and market expansion.
Flavored CBD Powder Market Share Analysis: Non-Alcoholic segment generated the highest revenue share in the industry
In the Flavored CBD Powder Market, the largest segment by product type is Non-Alcoholic. This segment includes CBD-infused powders designed for incorporation into various non-alcoholic beverages, such as smoothies, juices, and health drinks. Non-alcoholic CBD powders are favored by health-conscious consumers seeking alternative wellness products that offer the potential benefits of CBD without the intoxicating effects of alcohol. They cater to a growing market of individuals interested in functional beverages that promote relaxation, stress relief, and overall well-being. The versatility of non-alcoholic CBD powders allows them to be easily integrated into daily routines, contributing to their popularity across diverse consumer demographics.
Flavored CBD Powder Market Share Analysis: Organic is the fastest growing segment over the forecast period to 2032
The fastest-growing segment in the Flavored CBD Powder Market to 2032 is Organic. Organic CBD powders are gaining traction due to increasing consumer preference for natural and sustainably sourced ingredients. Organic certifications ensure that CBD powders are produced without synthetic pesticides, herbicides, or genetically modified organisms (GMOs), aligning with the clean label trend in food and beverage products. Consumers perceive organic CBD powders as safer and healthier options, making them willing to pay premium prices for products that prioritize environmental sustainability and ethical farming practices. The organic segment benefits from heightened consumer awareness about health and wellness, driving demand for products that offer natural benefits without compromising on quality or purity.
Flavored CBD Powder Market Share Analysis: Hemp-Derived segment generated the highest revenue share in the industry
In the Flavored CBD Powder Market, the largest segment by CBD source is Hemp-Derived. Hemp-derived CBD powders dominate the market due to several regulatory advantages and consumer preferences. Hemp-derived CBD is legally permitted under the 2018 Farm Bill in the United States and similar regulations in other regions, making it widely accessible for both manufacturers and consumers. It contains minimal levels of THC (tetrahydrocannabinol), the psychoactive compound found in marijuana, ensuring compliance with legal limits and catering to health-conscious consumers seeking CBD products without the intoxicating effects. Hemp-derived CBD powders are popular in wellness products and dietary supplements, offering potential health benefits such as pain relief, anxiety reduction, and anti-inflammatory properties. This segment benefits from the growing acceptance and normalization of CBD-based products in mainstream markets, driving its dominance in the flavored CBD powder industry.
Flavored CBD Powder Market Share Analysis: Synthetic is the fastest growing segment over the forecast period to 2032
The fastest-growing segment in the Flavored CBD Powder Market to 2032 is Synthetic. Synthetic CBD powders are gaining traction due to advancements in pharmaceutical and biotechnology sectors that enable the production of cannabinoids through synthetic means. Synthetic CBD offers precise control over purity and cannabinoid composition, appealing to pharmaceutical companies for drug development and clinical research purposes. It also addresses concerns related to consistency, quality, and scalability in CBD production, overcoming challenges associated with natural sourcing and regulatory complexities. While still a niche segment, synthetic CBD powders are anticipated to grow rapidly as research expands into cannabinoid-based therapies and novel applications in pharmaceutical formulations.
Flavored CBD Powder Market Segmentation
By Product
Alcoholic
Non-Alcoholic
By Type
Organic
Conventional
By CBD
Hemp-Derived
Marijuana-Derived
Synthetic
Countries Analyzed
North America (US, Canada, Mexico)
Europe (Germany, UK, France, Spain, Italy, Russia, Rest of Europe)
Asia Pacific (China, India, Japan, South Korea, Australia, South East Asia, Rest of Asia)
South America (Brazil, Argentina, Rest of South America)
Middle East and Africa (Saudi Arabia, UAE, Rest of Middle East, South Africa, Egypt, Rest of Africa)
Flavored CBD Powder Companies Profiled in the Study
Aurora Cannabis Inc.
CBD Biotechnology Co., Ltd.
G&Juice Beverage Co.
General Cannabis Corp.
Honeydrop Beverages LLC
NewAge, Inc.
Puration, Inc.
Tilray, Inc.
*- List Not Exhaustive
Chapter 1. TABLE OF CONTENTS
Chapter 2. Introduction to Flavored CBD Powder Market
2.1. Market Overview
2.2. Key Statistics and Report Highlights
2.3. Scope of the Comprehensive Study
2.3.1. Market Definition
2.3.2 Countries and Regions Covered
2.3.3 Research Objective
2.3.4 Units, Currency, and Conversions
2.3.5 Industry Value Chain
2.4. Key Market Segments
2.5. Key Companies
2.6. Study Period
Chapter 3. Strategic Analysis Review
3.1. Flavored CBD Powder Pricing Analysis and Forecast
3.2. Porter’s Five Forces
3.3. Market Ecosystem
3.4. SWOT Analysis
3.5. Regulatory Scenario
3.3. Effects of Inflation, Russia-Ukraine War, moderating economic growth, and other macroeconomic factors
Chapter 4. Competitive Landscape
4.1. Market Share Analysis
4.1.1. Global Flavored CBD Powder Market Share by Company, 2023
4.1.2. Product Offerings of Leading Flavored CBD Powder Companies
4.2. Market Entropy
4.2.1. New Product Launches in the Industry
4.2.2. Mergers, Acquisitions, Joint ventures, and Partnerships
4.3. Key Strategies and Best Practices
Chapter 5. Global Market Projections: Best, Reference, and Low Case Scenarios
5.1. Growth Analysis- Case Scenario Definitions
5.2. Low Growth Case Scenario Forecasts
5.3. Reference Growth Case Scenario Forecasts
5.4. High Growth Case Scenario Forecasts
Chapter 6. Market Dynamics
6.1. Flavored CBD Powder Market Drivers
6.2. Flavored CBD Powder Market Challenges
6.6. Flavored CBD Powder Market Opportunities
6.4. Flavored CBD Powder Market Trends
Chapter 7. Global Flavored CBD Powder Market Outlook Trends
7.1. Global Flavored CBD Powder Revenue (USD Million) and CAGR (%) by Type (2021-2032)
7.2. Global Flavored CBD Powder Revenue (USD Million) and CAGR (%) by Application (2021-2032)
7.3. Global Flavored CBD Powder Revenue (USD Million) and CAGR (%) by Product (2021-2032)
By Product
Alcoholic
Non-Alcoholic
By Type
Organic
Conventional
By CBD
Hemp-Derived
Marijuana-Derived
Synthetic
Chapter 8. Global Flavored CBD Powder Regional Analysis and Outlook
8.1. Global Flavored CBD Powder Revenue (USD Million) By Regions (2021- 2032)
8.2. North America Flavored CBD Powder Revenue (USD Million) by Country (2021-2032)
8.2.1. United States Flavored CBD Powder Regional Analysis and Outlook
8.2.2. Canada Flavored CBD Powder Regional Analysis and Outlook
8.2.3. Mexico Flavored CBD Powder Regional Analysis and Outlook
8.3. Europe Flavored CBD Powder Revenue (USD Million), by Country (2021-2032)
8.3.1. Germany Flavored CBD Powder Regional Analysis and Outlook
8.3.2. France Flavored CBD Powder Regional Analysis and Outlook
8.3.3. United Kingdom Flavored CBD Powder Regional Analysis and Outlook
8.3.4. Spain Flavored CBD Powder Regional Analysis and Outlook
8.3.5. Italy Flavored CBD Powder Regional Analysis and Outlook
8.3.6. Russia Flavored CBD Powder Regional Analysis and Outlook
8.3.7. Rest of Europe Flavored CBD Powder Regional Analysis and Outlook
8.4. Asia Pacific Flavored CBD Powder Revenue (USD Million) by Country (2021-2032)
8.4.1. China Flavored CBD Powder Regional Analysis and Outlook
8.4.2. Japan Flavored CBD Powder Regional Analysis and Outlook
8.4.3. India Flavored CBD Powder Regional Analysis and Outlook
8.4.4. South Korea Flavored CBD Powder Regional Analysis and Outlook
8.4.5. Australia Flavored CBD Powder Regional Analysis and Outlook
8.4.6. South East Asia Flavored CBD Powder Regional Analysis and Outlook
8.4.7. Rest of Asia Pacific Flavored CBD Powder Regional Analysis and Outlook
8.5. South America Flavored CBD Powder Revenue (USD Million), by Country (2021-2032)
8.5.1. Brazil Flavored CBD Powder Regional Analysis and Outlook
8.5.2. Argentina Flavored CBD Powder Regional Analysis and Outlook
8.5.3. Rest of South America Flavored CBD Powder Regional Analysis and Outlook
8.6. Middle East and Africa Flavored CBD Powder Revenue (USD Million) by Country (2021-2032)
8.6.1. Middle East Flavored CBD Powder Regional Analysis and Outlook
8.6.2. Africa Flavored CBD Powder Regional Analysis and Outlook
Chapter 9. North America Flavored CBD Powder Analysis and Outlook
9.1. North America Flavored CBD Powder Revenue (USD Million) by Segments (2021-2032)
9.1.1. North America Flavored CBD Powder Revenue (USD Million) by Type (2021-2032)
9.1.2. North America Flavored CBD Powder Revenue (USD Million) by Application (2021-2032)
9.1.3. North America Flavored CBD Powder Revenue (USD Million) by Product (2021-2032)
By Product
Alcoholic
Non-Alcoholic
By Type
Organic
Conventional
By CBD
Hemp-Derived
Marijuana-Derived
Synthetic
Chapter 10. Europe Flavored CBD Powder Analysis and Outlook
10.1. Europe Flavored CBD Powder Revenue (USD Million), by Segments (USD Million) (2021-2032)
10.1.1. Europe Flavored CBD Powder Revenue (USD Million) by Type (2021-2032)
10.1.2. Europe Flavored CBD Powder Revenue (USD Million) by Application (2021-2032)
10.1.3. Europe Flavored CBD Powder Revenue (USD Million) by Product (2021-2032)
By Product
Alcoholic
Non-Alcoholic
By Type
Organic
Conventional
By CBD
Hemp-Derived
Marijuana-Derived
Synthetic
Chapter 11. Asia Pacific Flavored CBD Powder Analysis and Outlook
11.1. Asia Pacific Flavored CBD Powder Revenue (USD Million), and Revenue (USD Million) by Segments (2021-2032)
11.1.1. Asia Pacific Flavored CBD Powder Revenue (USD Million) by Type (2021-2032)
11.1.2. Asia Pacific Flavored CBD Powder Revenue (USD Million) by Application (2021-2032)
11.1.3. Asia Pacific Flavored CBD Powder Revenue (USD Million) by Product (2021-2032)
By Product
Alcoholic
Non-Alcoholic
By Type
Organic
Conventional
By CBD
Hemp-Derived
Marijuana-Derived
Synthetic
Chapter 12. South America Flavored CBD Powder Analysis and Outlook
12.1. South America Flavored CBD Powder Revenue (USD Million), by Segments (2021-2032)
12.1.1. South America Flavored CBD Powder Revenue (USD Million) by Type (2021-2032)
12.1.2. South America Flavored CBD Powder Revenue (USD Million) by Application (2021-2032)
12.1.3. South America Flavored CBD Powder Revenue (USD Million) by Product (2021-2032)
By Product
Alcoholic
Non-Alcoholic
By Type
Organic
Conventional
By CBD
Hemp-Derived
Marijuana-Derived
Synthetic
Chapter 13. Middle East and Africa Flavored CBD Powder Analysis and Outlook
13.1. Middle East and Africa Flavored CBD Powder Revenue (USD Million), by Segments (2021-2032)
13.1.1. Middle East and Africa Flavored CBD Powder Revenue (USD Million) by Type (2021-2032)
13.1.2. Middle East and Africa Flavored CBD Powder Revenue (USD Million) by Application (2021-2032)
13.1.3. Middle East and Africa Flavored CBD Powder Revenue (USD Million) by Product (2021-2032)
By Product
Alcoholic
Non-Alcoholic
By Type
Organic
Conventional
By CBD
Hemp-Derived
Marijuana-Derived
Synthetic
Chapter 14. Flavored CBD Powder Company Profiles
14.1 Business Overview
14.2 Product Profiles
14.3 SWOT Profiles
14.5 Recent Developments
14.6 Financial Profile
List of Companies
Aurora Cannabis Inc.
CBD Biotechnology Co., Ltd.
G&Juice Beverage Co.
General Cannabis Corp.
Honeydrop Beverages LLC
NewAge, Inc.
Puration, Inc.
Tilray, Inc.
15. Methodology and Data Sources
15.1 Customization Offerings
15.2 Subscription Services
15.3 Related Reports
15.4 Publisher Expertise
LIST OF TABLES
Table 1 Market Segmentation Analysis
Table 2 Global Flavored CBD Powder Market Share of Leading Companies, 2023
Table 3 Product Offerings of Leading Companies
Table 4 Low Growth Scenario Forecasts
Table 5 Reference Case Growth Scenario
Table 6 High Growth Case Scenario
Table 7 Global Flavored CBD Powder Revenue (USD Million) And CAGR (%) By Type (2021-2032)
Table 8 Global Flavored CBD Powder Revenue (USD Million) And CAGR (%) By Application (2021-2032)
Table 9 Global Flavored CBD Powder Revenue (USD Million) And CAGR (%) By Product (2021-2032)
Table 10 Global Flavored CBD Powder Market Revenue (USD Million) By Regions (2021-2032)
Table 11 Global Flavored CBD Powder Market Share (%) By Regions (2021-2032)
Table 12 North America Flavored CBD Powder Revenue (USD Million) By Country (2021-2032)
Table 13 Europe Flavored CBD Powder Revenue (USD Million) By Country (2021-2032)
Table 14 Asia Pacific Flavored CBD Powder Revenue (USD Million) By Country (2021-2032)
Table 15 South America Flavored CBD Powder Revenue (USD Million) By Country (2021-2032)
Table 16 Middle East and Africa Flavored CBD Powder Revenue (USD Million) By Region (2021-2032)
Table 17 North America Flavored CBD Powder Revenue (USD Million) By Type (2021-2032)
Table 18 North America Flavored CBD Powder Revenue (USD Million) By Application (2021-2032)
Table 19 North America Flavored CBD Powder Revenue (USD Million) By Product (2021-2032)
Table 20 Europe Flavored CBD Powder Revenue (USD Million) By Type (2021-2032)
Table 21 Europe Flavored CBD Powder Revenue (USD Million) By Application (2021-2032)
Table 22 Europe Flavored CBD Powder Revenue (USD Million) By Product (2021-2032)
Table 23 Asia Pacific Flavored CBD Powder Revenue (USD Million) By Type (2021-2032)
Table 24 Asia Pacific Flavored CBD Powder Revenue (USD Million) By Application (2021-2032)
Table 25 Asia Pacific Flavored CBD Powder Revenue (USD Million) By Product (2021-2032)
Table 26 South America Flavored CBD Powder Revenue (USD Million) By Type (2021-2032)
Table 27 South America Flavored CBD Powder Revenue (USD Million) By Application (2021-2032)
Table 28 South America Flavored CBD Powder Revenue (USD Million) By Product (2021-2032)
Table 29 Middle East and Africa Flavored CBD Powder Revenue (USD Million) By Type (2021-2032)
Table 30 Middle East and Africa Flavored CBD Powder Revenue (USD Million) By Application (2021-2032)
Table 31 Middle East and Africa Flavored CBD Powder Revenue (USD Million) By Product (2021-2032)
LIST OF FIGURES
Figure 1. Market Scope
Figure 2. Pricing Forecasts Per Unit, 2023- 2032
Figure 3. Porter’s Five Forces
Figure 4. Global Flavored CBD Powder Market Revenue (USD Million) By Regions (2021-2032)
Figure 5. Global Flavored CBD Powder Market Share (%) By Regions (2023)
Figure 6. North America Flavored CBD Powder Revenue (USD Million) By Country (2021-2032)
Figure 7. United States Flavored CBD Powder Revenue (USD Million) By Country (2021-2032)
Figure 8. Canada Flavored CBD Powder Revenue (USD Million) By Country (2021-2032)
Figure 9. Mexico Flavored CBD Powder Revenue (USD Million) By Country (2021-2032)
Figure 10. Europe Flavored CBD Powder Revenue (USD Million) By Country (2021-2032)
Figure 11. Germany Flavored CBD Powder Revenue (USD Million) By Country (2021-2032)
Figure 12. France Flavored CBD Powder Revenue (USD Million) By Country (2021-2032)
Figure 13. United Kingdom Flavored CBD Powder Revenue (USD Million) By Country (2021-2032)
Figure 14. Spain Flavored CBD Powder Revenue (USD Million) By Country (2021-2032)
Figure 15. Italy Flavored CBD Powder Revenue (USD Million) By Country (2021-2032)
Figure 16. Russia Flavored CBD Powder Revenue (USD Million) By Country (2021-2032)
Figure 17. Rest of Europe Flavored CBD Powder Revenue (USD Million) By Country (2021-2032)
Figure 11. Asia Pacific Flavored CBD Powder Revenue (USD Million) By Country (2021-2032)
Figure 12. China Flavored CBD Powder Revenue (USD Million) By Country (2021-2032)
Figure 13. Japan Flavored CBD Powder Revenue (USD Million) By Country (2021-2032)
Figure 14. India Flavored CBD Powder Revenue (USD Million) By Country (2021-2032)
Figure 15. South Korea Flavored CBD Powder Revenue (USD Million) By Country (2021-2032)
Figure 16. Australia Flavored CBD Powder Revenue (USD Million) By Country (2021-2032)
Figure 17. South East Asia Flavored CBD Powder Revenue (USD Million) By Country (2021-2032)
Figure 18. South America Flavored CBD Powder Revenue (USD Million) By Country (2021-2032)
Figure 19. Brazil Flavored CBD Powder Revenue (USD Million) By Country (2021-2032)
Figure 20. Argentina Flavored CBD Powder Revenue (USD Million) By Country (2021-2032)
Figure 21. Rest of Asia Pacific Flavored CBD Powder Revenue (USD Million) By Country (2021-2032)
Figure 22. Middle East and Africa Flavored CBD Powder Revenue (USD Million) By Region (2021-2032)
Figure 23. Saudi Arabia Flavored CBD Powder Revenue (USD Million) By Region (2021-2032)
Figure 24. The UAE Flavored CBD Powder Revenue (USD Million) By Region (2021-2032)
Figure 25. Rest of Middle East Flavored CBD Powder Revenue (USD Million) By Region (2021-2032)
Figure 26. South Africa Flavored CBD Powder Revenue (USD Million) By Region (2021-2032)
Figure 27. Africa Flavored CBD Powder Revenue (USD Million) By Region (2021-2032)
Figure 28. North America Flavored CBD Powder Revenue (USD Million) By Type (2021-2032)
Figure 29. North America Flavored CBD Powder Revenue (USD Million) By Application (2021-2032)
Figure 30. North America Flavored CBD Powder Revenue (USD Million) By Product (2021-2032)
Figure 31. Europe Flavored CBD Powder Revenue (USD Million) By Type (2021-2032)
Figure 32. Europe Flavored CBD Powder Revenue (USD Million) By Application (2021-2032)
Figure 33. Europe Flavored CBD Powder Revenue (USD Million) By Product (2021-2032)
Figure 34. Asia Pacific Flavored CBD Powder Revenue (USD Million) By Type (2021-2032)
Figure 35. Asia Pacific Flavored CBD Powder Revenue (USD Million) By Application (2021-2032)
Figure 36. Asia Pacific Flavored CBD Powder Revenue (USD Million) By Product (2021-2032)
Figure 37. South America Flavored CBD Powder Revenue (USD Million) By Type (2021-2032)
Figure 38. South America Flavored CBD Powder Revenue (USD Million) By Application (2021-2032)
Figure 39. South America Flavored CBD Powder Revenue (USD Million) By Product (2021-2032)
Figure 40. Middle East and Africa Flavored CBD Powder Revenue (USD Million) By Type (2021-2032)
Figure 41. Middle East and Africa Flavored CBD Powder Revenue (USD Million) By Application (2021-2032)
Figure 42. Middle East and Africa Flavored CBD Powder Revenue (USD Million) By Product (2021-2032)
By Product
Alcoholic
Non-Alcoholic
By Type
Organic
Conventional
By CBD
Hemp-Derived
Marijuana-Derived
Synthetic
Countries Analyzed
North America (US, Canada, Mexico)
Europe (Germany, UK, France, Spain, Italy, Russia, Rest of Europe)
Asia Pacific (China, India, Japan, South Korea, Australia, South East Asia, Rest of Asia)
South America (Brazil, Argentina, Rest of South America)
Middle East and Africa (Saudi Arabia, UAE, Rest of Middle East, South Africa, Egypt, Rest of Africa)
