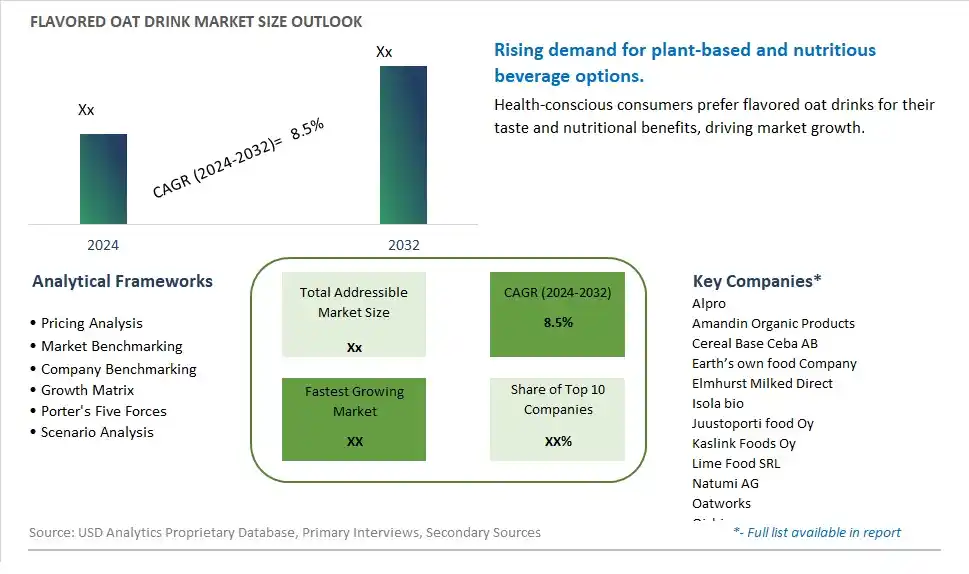
Global Flavored Oat Drink Market Size is valued at $XX Million in 2024 and is forecast to register a growth rate (CAGR) of 8.5% to reach $XX Million by 2032.
The global Flavored Oat Drink Market Comprehensive Study analyzes and forecasts the market size across 6 regions and 24 countries for diverse segments -By Type (Organic, Conventional), By Application (Supermarkets/Hypermarket, Specialty Stores, Convenience Store, Food & Drink Store, Online Stores, Others)
An Introduction to Flavored Oat Drink Market
The Flavored Oat Drink market in 2024 is experiencing significant growth, driven by the rising demand for plant-based and dairy-free beverage options. Flavored oat drinks, known for their creamy texture and nutritional benefits, are popular among vegans, lactose-intolerant individuals, and health-conscious consumers. The market benefits from advancements in oat milk processing and flavoring technologies, the growing trend of plant-based diets, and the expansion of the functional beverage sector. Additionally, the increasing awareness of the environmental benefits of oat-based products is contributing to market growth.
Flavored Oat Drink Competitive Landscape
The market report analyses the leading companies in the industry including Alpro, Amandin Organic Products, Cereal Base Ceba AB, Earth’s own food Company, Elmhurst Milked Direct, Isola bio, Juustoporti food Oy, Kaslink Foods Oy, Lime Food SRL, Natumi AG, Oatworks, Oishi, Pacific food of Oregon, Provitamil, Pureharvest, Quaker Oats, Rude Health Foods, Valsoia, and Others.
Flavored Oat Drink Market Dynamics
Flavored Oat Drink Market Trend: Increasing Demand for Plant-Based Beverages
The flavored oat drink market is experiencing a significant trend towards increasing demand for plant-based beverages. Consumers are becoming more health-conscious and environmentally aware, leading to a surge in popularity for plant-based milk alternatives. Oat drinks, known for their creamy texture and nutritional benefits, are particularly appealing when infused with flavors like vanilla, chocolate, and various fruits. This trend is driven by the growing number of individuals adopting vegan, lactose-free, and dairy-free diets, as well as those looking to reduce their environmental footprint. The market is witnessing a proliferation of new flavored oat drink products that cater to diverse taste preferences and dietary needs.
Flavored Oat Drink Market Driver: Rising Awareness of Health Benefits
The rising awareness of the health benefits associated with oat-based beverages is a major driver for the flavored oat drink market. Oat drinks are rich in fiber, vitamins, and minerals, and are known for their heart health benefits, such as lowering cholesterol levels. Consumers are increasingly seeking functional beverages that offer both taste and health benefits, making flavored oat drinks an attractive choice. This driver is further supported by the trend towards clean eating and natural ingredients, as oat drinks are often perceived as wholesome and nutritious alternatives to traditional dairy and other plant-based milks.
Flavored Oat Drink Market Opportunity: Innovation in Functional and Specialty Flavors
There is a significant opportunity for growth in the flavored oat drink market through innovation in functional and specialty flavors. Companies can develop oat drinks that not only provide unique taste experiences but also offer additional health benefits, such as enhanced energy, improved digestion, or added vitamins and minerals. Introducing seasonal and limited-edition flavors can also capture consumer interest and drive sales. By focusing on creating high-quality, innovative flavored oat drinks that cater to specific health needs and preferences, manufacturers can attract a broader consumer base and differentiate their products in the competitive plant-based beverage market.
Flavored Oat Drink Market Share Analysis: Conventional segment generated the highest revenue share in the industry
In the Flavored Oat Drink Market, the largest segment by type is Conventional flavored oat drinks. These products cater to a broad consumer base seeking convenient and affordable dairy-free alternatives that are widely available in mainstream retail channels. Conventional flavored oat drinks are fortified with vitamins and minerals, offering nutritional benefits similar to traditional dairy milk while appealing to health-conscious consumers looking for plant-based options. Their popularity stems from being versatile beverages that can be consumed on their own, used in cooking, or added to coffee and smoothies.
Flavored Oat Drink Market Share Analysis: Online Stores is the fastest growing segment over the forecast period to 2032
The fastest-growing segment in the Flavored Oat Drink Market to 2032 is Online Stores. As e-commerce continues to expand globally, online stores have emerged as crucial channels for the distribution and sale of flavored oat drinks. Consumers are increasingly turning to online platforms to purchase groceries and beverages due to convenience, a wide assortment of products, and competitive pricing. Online stores offer flavored oat drinks the opportunity to reach a broader audience beyond traditional brick-and-mortar retail, including tech-savvy millennials and busy professionals who prioritize convenience in their shopping habits. The growth of online sales is further propelled by digital marketing strategies, subscription services, and the ease of comparing product options, driving the expansion of flavored oat drinks in the digital marketplace.
Flavored Oat Drink Market Segmentation
By Type
Organic
Conventional
By Application
Supermarkets/Hypermarket
Specialty Stores
Convenience Store
Food & Drink Store
Online Stores
Others
Countries Analyzed
North America (US, Canada, Mexico)
Europe (Germany, UK, France, Spain, Italy, Russia, Rest of Europe)
Asia Pacific (China, India, Japan, South Korea, Australia, South East Asia, Rest of Asia)
South America (Brazil, Argentina, Rest of South America)
Middle East and Africa (Saudi Arabia, UAE, Rest of Middle East, South Africa, Egypt, Rest of Africa)
Flavored Oat Drink Companies Profiled in the Study
Alpro
Amandin Organic Products
Cereal Base Ceba AB
Earth’s own food Company
Elmhurst Milked Direct
Isola bio
Juustoporti food Oy
Kaslink Foods Oy
Lime Food SRL
Natumi AG
Oatworks
Oishi
Pacific food of Oregon
Provitamil
Pureharvest
Quaker Oats
Rude Health Foods
Valsoia
*- List Not Exhaustive
Chapter 1. TABLE OF CONTENTS
Chapter 2. Introduction to Flavored Oat Drink Market
2.1. Market Overview
2.2. Key Statistics and Report Highlights
2.3. Scope of the Comprehensive Study
2.3.1. Market Definition
2.3.2 Countries and Regions Covered
2.3.3 Research Objective
2.3.4 Units, Currency, and Conversions
2.3.5 Industry Value Chain
2.4. Key Market Segments
2.5. Key Companies
2.6. Study Period
Chapter 3. Strategic Analysis Review
3.1. Flavored Oat Drink Pricing Analysis and Forecast
3.2. Porter’s Five Forces
3.3. Market Ecosystem
3.4. SWOT Analysis
3.5. Regulatory Scenario
3.3. Effects of Inflation, Russia-Ukraine War, moderating economic growth, and other macroeconomic factors
Chapter 4. Competitive Landscape
4.1. Market Share Analysis
4.1.1. Global Flavored Oat Drink Market Share by Company, 2023
4.1.2. Product Offerings of Leading Flavored Oat Drink Companies
4.2. Market Entropy
4.2.1. New Product Launches in the Industry
4.2.2. Mergers, Acquisitions, Joint ventures, and Partnerships
4.3. Key Strategies and Best Practices
Chapter 5. Global Market Projections: Best, Reference, and Low Case Scenarios
5.1. Growth Analysis- Case Scenario Definitions
5.2. Low Growth Case Scenario Forecasts
5.3. Reference Growth Case Scenario Forecasts
5.4. High Growth Case Scenario Forecasts
Chapter 6. Market Dynamics
6.1. Flavored Oat Drink Market Drivers
6.2. Flavored Oat Drink Market Challenges
6.6. Flavored Oat Drink Market Opportunities
6.4. Flavored Oat Drink Market Trends
Chapter 7. Global Flavored Oat Drink Market Outlook Trends
7.1. Global Flavored Oat Drink Revenue (USD Million) and CAGR (%) by Type (2021-2032)
7.2. Global Flavored Oat Drink Revenue (USD Million) and CAGR (%) by Application (2021-2032)
7.3. Global Flavored Oat Drink Revenue (USD Million) and CAGR (%) by Product (2021-2032)
By Type
Organic
Conventional
By Application
Supermarkets/Hypermarket
Specialty Stores
Convenience Store
Food & Drink Store
Online Stores
Others
Chapter 8. Global Flavored Oat Drink Regional Analysis and Outlook
8.1. Global Flavored Oat Drink Revenue (USD Million) By Regions (2021- 2032)
8.2. North America Flavored Oat Drink Revenue (USD Million) by Country (2021-2032)
8.2.1. United States Flavored Oat Drink Regional Analysis and Outlook
8.2.2. Canada Flavored Oat Drink Regional Analysis and Outlook
8.2.3. Mexico Flavored Oat Drink Regional Analysis and Outlook
8.3. Europe Flavored Oat Drink Revenue (USD Million), by Country (2021-2032)
8.3.1. Germany Flavored Oat Drink Regional Analysis and Outlook
8.3.2. France Flavored Oat Drink Regional Analysis and Outlook
8.3.3. United Kingdom Flavored Oat Drink Regional Analysis and Outlook
8.3.4. Spain Flavored Oat Drink Regional Analysis and Outlook
8.3.5. Italy Flavored Oat Drink Regional Analysis and Outlook
8.3.6. Russia Flavored Oat Drink Regional Analysis and Outlook
8.3.7. Rest of Europe Flavored Oat Drink Regional Analysis and Outlook
8.4. Asia Pacific Flavored Oat Drink Revenue (USD Million) by Country (2021-2032)
8.4.1. China Flavored Oat Drink Regional Analysis and Outlook
8.4.2. Japan Flavored Oat Drink Regional Analysis and Outlook
8.4.3. India Flavored Oat Drink Regional Analysis and Outlook
8.4.4. South Korea Flavored Oat Drink Regional Analysis and Outlook
8.4.5. Australia Flavored Oat Drink Regional Analysis and Outlook
8.4.6. South East Asia Flavored Oat Drink Regional Analysis and Outlook
8.4.7. Rest of Asia Pacific Flavored Oat Drink Regional Analysis and Outlook
8.5. South America Flavored Oat Drink Revenue (USD Million), by Country (2021-2032)
8.5.1. Brazil Flavored Oat Drink Regional Analysis and Outlook
8.5.2. Argentina Flavored Oat Drink Regional Analysis and Outlook
8.5.3. Rest of South America Flavored Oat Drink Regional Analysis and Outlook
8.6. Middle East and Africa Flavored Oat Drink Revenue (USD Million) by Country (2021-2032)
8.6.1. Middle East Flavored Oat Drink Regional Analysis and Outlook
8.6.2. Africa Flavored Oat Drink Regional Analysis and Outlook
Chapter 9. North America Flavored Oat Drink Analysis and Outlook
9.1. North America Flavored Oat Drink Revenue (USD Million) by Segments (2021-2032)
9.1.1. North America Flavored Oat Drink Revenue (USD Million) by Type (2021-2032)
9.1.2. North America Flavored Oat Drink Revenue (USD Million) by Application (2021-2032)
9.1.3. North America Flavored Oat Drink Revenue (USD Million) by Product (2021-2032)
By Type
Organic
Conventional
By Application
Supermarkets/Hypermarket
Specialty Stores
Convenience Store
Food & Drink Store
Online Stores
Others
Chapter 10. Europe Flavored Oat Drink Analysis and Outlook
10.1. Europe Flavored Oat Drink Revenue (USD Million), by Segments (USD Million) (2021-2032)
10.1.1. Europe Flavored Oat Drink Revenue (USD Million) by Type (2021-2032)
10.1.2. Europe Flavored Oat Drink Revenue (USD Million) by Application (2021-2032)
10.1.3. Europe Flavored Oat Drink Revenue (USD Million) by Product (2021-2032)
By Type
Organic
Conventional
By Application
Supermarkets/Hypermarket
Specialty Stores
Convenience Store
Food & Drink Store
Online Stores
Others
Chapter 11. Asia Pacific Flavored Oat Drink Analysis and Outlook
11.1. Asia Pacific Flavored Oat Drink Revenue (USD Million), and Revenue (USD Million) by Segments (2021-2032)
11.1.1. Asia Pacific Flavored Oat Drink Revenue (USD Million) by Type (2021-2032)
11.1.2. Asia Pacific Flavored Oat Drink Revenue (USD Million) by Application (2021-2032)
11.1.3. Asia Pacific Flavored Oat Drink Revenue (USD Million) by Product (2021-2032)
By Type
Organic
Conventional
By Application
Supermarkets/Hypermarket
Specialty Stores
Convenience Store
Food & Drink Store
Online Stores
Others
Chapter 12. South America Flavored Oat Drink Analysis and Outlook
12.1. South America Flavored Oat Drink Revenue (USD Million), by Segments (2021-2032)
12.1.1. South America Flavored Oat Drink Revenue (USD Million) by Type (2021-2032)
12.1.2. South America Flavored Oat Drink Revenue (USD Million) by Application (2021-2032)
12.1.3. South America Flavored Oat Drink Revenue (USD Million) by Product (2021-2032)
By Type
Organic
Conventional
By Application
Supermarkets/Hypermarket
Specialty Stores
Convenience Store
Food & Drink Store
Online Stores
Others
Chapter 13. Middle East and Africa Flavored Oat Drink Analysis and Outlook
13.1. Middle East and Africa Flavored Oat Drink Revenue (USD Million), by Segments (2021-2032)
13.1.1. Middle East and Africa Flavored Oat Drink Revenue (USD Million) by Type (2021-2032)
13.1.2. Middle East and Africa Flavored Oat Drink Revenue (USD Million) by Application (2021-2032)
13.1.3. Middle East and Africa Flavored Oat Drink Revenue (USD Million) by Product (2021-2032)
By Type
Organic
Conventional
By Application
Supermarkets/Hypermarket
Specialty Stores
Convenience Store
Food & Drink Store
Online Stores
Others
Chapter 14. Flavored Oat Drink Company Profiles
14.1 Business Overview
14.2 Product Profiles
14.3 SWOT Profiles
14.5 Recent Developments
14.6 Financial Profile
List of Companies
Alpro
Amandin Organic Products
Cereal Base Ceba AB
Earth’s own food Company
Elmhurst Milked Direct
Isola bio
Juustoporti food Oy
Kaslink Foods Oy
Lime Food SRL
Natumi AG
Oatworks
Oishi
Pacific food of Oregon
Provitamil
Pureharvest
Quaker Oats
Rude Health Foods
Valsoia
15. Methodology and Data Sources
15.1 Customization Offerings
15.2 Subscription Services
15.3 Related Reports
15.4 Publisher Expertise
LIST OF TABLES
Table 1 Market Segmentation Analysis
Table 2 Global Flavored Oat Drink Market Share of Leading Companies, 2023
Table 3 Product Offerings of Leading Companies
Table 4 Low Growth Scenario Forecasts
Table 5 Reference Case Growth Scenario
Table 6 High Growth Case Scenario
Table 7 Global Flavored Oat Drink Revenue (USD Million) And CAGR (%) By Type (2021-2032)
Table 8 Global Flavored Oat Drink Revenue (USD Million) And CAGR (%) By Application (2021-2032)
Table 9 Global Flavored Oat Drink Revenue (USD Million) And CAGR (%) By Product (2021-2032)
Table 10 Global Flavored Oat Drink Market Revenue (USD Million) By Regions (2021-2032)
Table 11 Global Flavored Oat Drink Market Share (%) By Regions (2021-2032)
Table 12 North America Flavored Oat Drink Revenue (USD Million) By Country (2021-2032)
Table 13 Europe Flavored Oat Drink Revenue (USD Million) By Country (2021-2032)
Table 14 Asia Pacific Flavored Oat Drink Revenue (USD Million) By Country (2021-2032)
Table 15 South America Flavored Oat Drink Revenue (USD Million) By Country (2021-2032)
Table 16 Middle East and Africa Flavored Oat Drink Revenue (USD Million) By Region (2021-2032)
Table 17 North America Flavored Oat Drink Revenue (USD Million) By Type (2021-2032)
Table 18 North America Flavored Oat Drink Revenue (USD Million) By Application (2021-2032)
Table 19 North America Flavored Oat Drink Revenue (USD Million) By Product (2021-2032)
Table 20 Europe Flavored Oat Drink Revenue (USD Million) By Type (2021-2032)
Table 21 Europe Flavored Oat Drink Revenue (USD Million) By Application (2021-2032)
Table 22 Europe Flavored Oat Drink Revenue (USD Million) By Product (2021-2032)
Table 23 Asia Pacific Flavored Oat Drink Revenue (USD Million) By Type (2021-2032)
Table 24 Asia Pacific Flavored Oat Drink Revenue (USD Million) By Application (2021-2032)
Table 25 Asia Pacific Flavored Oat Drink Revenue (USD Million) By Product (2021-2032)
Table 26 South America Flavored Oat Drink Revenue (USD Million) By Type (2021-2032)
Table 27 South America Flavored Oat Drink Revenue (USD Million) By Application (2021-2032)
Table 28 South America Flavored Oat Drink Revenue (USD Million) By Product (2021-2032)
Table 29 Middle East and Africa Flavored Oat Drink Revenue (USD Million) By Type (2021-2032)
Table 30 Middle East and Africa Flavored Oat Drink Revenue (USD Million) By Application (2021-2032)
Table 31 Middle East and Africa Flavored Oat Drink Revenue (USD Million) By Product (2021-2032)
LIST OF FIGURES
Figure 1. Market Scope
Figure 2. Pricing Forecasts Per Unit, 2023- 2032
Figure 3. Porter’s Five Forces
Figure 4. Global Flavored Oat Drink Market Revenue (USD Million) By Regions (2021-2032)
Figure 5. Global Flavored Oat Drink Market Share (%) By Regions (2023)
Figure 6. North America Flavored Oat Drink Revenue (USD Million) By Country (2021-2032)
Figure 7. United States Flavored Oat Drink Revenue (USD Million) By Country (2021-2032)
Figure 8. Canada Flavored Oat Drink Revenue (USD Million) By Country (2021-2032)
Figure 9. Mexico Flavored Oat Drink Revenue (USD Million) By Country (2021-2032)
Figure 10. Europe Flavored Oat Drink Revenue (USD Million) By Country (2021-2032)
Figure 11. Germany Flavored Oat Drink Revenue (USD Million) By Country (2021-2032)
Figure 12. France Flavored Oat Drink Revenue (USD Million) By Country (2021-2032)
Figure 13. United Kingdom Flavored Oat Drink Revenue (USD Million) By Country (2021-2032)
Figure 14. Spain Flavored Oat Drink Revenue (USD Million) By Country (2021-2032)
Figure 15. Italy Flavored Oat Drink Revenue (USD Million) By Country (2021-2032)
Figure 16. Russia Flavored Oat Drink Revenue (USD Million) By Country (2021-2032)
Figure 17. Rest of Europe Flavored Oat Drink Revenue (USD Million) By Country (2021-2032)
Figure 11. Asia Pacific Flavored Oat Drink Revenue (USD Million) By Country (2021-2032)
Figure 12. China Flavored Oat Drink Revenue (USD Million) By Country (2021-2032)
Figure 13. Japan Flavored Oat Drink Revenue (USD Million) By Country (2021-2032)
Figure 14. India Flavored Oat Drink Revenue (USD Million) By Country (2021-2032)
Figure 15. South Korea Flavored Oat Drink Revenue (USD Million) By Country (2021-2032)
Figure 16. Australia Flavored Oat Drink Revenue (USD Million) By Country (2021-2032)
Figure 17. South East Asia Flavored Oat Drink Revenue (USD Million) By Country (2021-2032)
Figure 18. South America Flavored Oat Drink Revenue (USD Million) By Country (2021-2032)
Figure 19. Brazil Flavored Oat Drink Revenue (USD Million) By Country (2021-2032)
Figure 20. Argentina Flavored Oat Drink Revenue (USD Million) By Country (2021-2032)
Figure 21. Rest of Asia Pacific Flavored Oat Drink Revenue (USD Million) By Country (2021-2032)
Figure 22. Middle East and Africa Flavored Oat Drink Revenue (USD Million) By Region (2021-2032)
Figure 23. Saudi Arabia Flavored Oat Drink Revenue (USD Million) By Region (2021-2032)
Figure 24. The UAE Flavored Oat Drink Revenue (USD Million) By Region (2021-2032)
Figure 25. Rest of Middle East Flavored Oat Drink Revenue (USD Million) By Region (2021-2032)
Figure 26. South Africa Flavored Oat Drink Revenue (USD Million) By Region (2021-2032)
Figure 27. Africa Flavored Oat Drink Revenue (USD Million) By Region (2021-2032)
Figure 28. North America Flavored Oat Drink Revenue (USD Million) By Type (2021-2032)
Figure 29. North America Flavored Oat Drink Revenue (USD Million) By Application (2021-2032)
Figure 30. North America Flavored Oat Drink Revenue (USD Million) By Product (2021-2032)
Figure 31. Europe Flavored Oat Drink Revenue (USD Million) By Type (2021-2032)
Figure 32. Europe Flavored Oat Drink Revenue (USD Million) By Application (2021-2032)
Figure 33. Europe Flavored Oat Drink Revenue (USD Million) By Product (2021-2032)
Figure 34. Asia Pacific Flavored Oat Drink Revenue (USD Million) By Type (2021-2032)
Figure 35. Asia Pacific Flavored Oat Drink Revenue (USD Million) By Application (2021-2032)
Figure 36. Asia Pacific Flavored Oat Drink Revenue (USD Million) By Product (2021-2032)
Figure 37. South America Flavored Oat Drink Revenue (USD Million) By Type (2021-2032)
Figure 38. South America Flavored Oat Drink Revenue (USD Million) By Application (2021-2032)
Figure 39. South America Flavored Oat Drink Revenue (USD Million) By Product (2021-2032)
Figure 40. Middle East and Africa Flavored Oat Drink Revenue (USD Million) By Type (2021-2032)
Figure 41. Middle East and Africa Flavored Oat Drink Revenue (USD Million) By Application (2021-2032)
Figure 42. Middle East and Africa Flavored Oat Drink Revenue (USD Million) By Product (2021-2032)
By Type
Organic
Conventional
By Application
Supermarkets/Hypermarket
Specialty Stores
Convenience Store
Food & Drink Store
Online Stores
Others
Countries Analyzed
North America (US, Canada, Mexico)
Europe (Germany, UK, France, Spain, Italy, Russia, Rest of Europe)
Asia Pacific (China, India, Japan, South Korea, Australia, South East Asia, Rest of Asia)
South America (Brazil, Argentina, Rest of South America)
Middle East and Africa (Saudi Arabia, UAE, Rest of Middle East, South Africa, Egypt, Rest of Africa)
