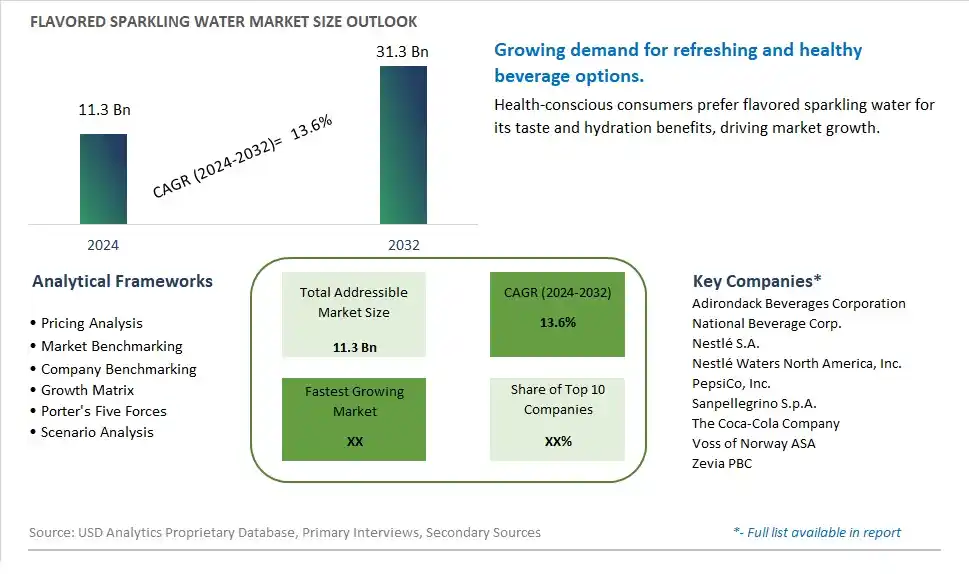
Global Flavored Sparkling Water Market Size is valued at $11.3 Billion in 2024 and is forecast to register a growth rate (CAGR) of 13.6% to reach $31.3 Billion by 2032.
The global Flavored Sparkling Water Market Comprehensive Study analyzes and forecasts the market size across 6 regions and 24 countries for diverse segments -By Type (Orange, Lemon, Raspberry, Blackberry, Apple, Others), By Application (Hypermarkets/ Supermarkets, Online Retail, Specialty Stores, Convenience Stores, Others)
An Introduction to Flavored Sparkling Water Market
The Flavored Sparkling Water market in 2024 is witnessing robust growth, driven by the increasing demand for healthy and refreshing beverage alternatives to sugary sodas. Flavored sparkling water, infused with natural flavors and often free from calories and artificial ingredients, is popular among health-conscious consumers. The market benefits from advancements in beverage carbonation and flavoring technologies, the growing trend of health and wellness, and the expansion of the functional and fortified beverage sectors. Additionally, the rising awareness of the benefits of hydration and the popularity of clean label products is contributing to market growth.
Flavored Sparkling Water Competitive Landscape
The market report analyses the leading companies in the industry including Adirondack Beverages Corporation, National Beverage Corp., Nestlé S.A., Nestlé Waters North America, Inc., PepsiCo, Inc., Sanpellegrino S.p.A., The Coca-Cola Company, Voss of Norway ASA, Zevia PBC, and Others.
Flavored Sparkling Water Market Dynamics
Flavored Sparkling Water Market Trend: Increasing Demand for Healthier Beverage Alternatives
The flavored sparkling water market is experiencing a significant trend towards increasing demand for healthier beverage alternatives. Consumers are becoming more health-conscious and are actively seeking out drinks that provide hydration without the added sugars and calories found in traditional sodas and sugary beverages. Flavored sparkling water, often enhanced with natural fruit essences and free from artificial additives, fits perfectly into this trend. This shift is driven by the broader movement towards clean eating and wellness, where consumers prioritize natural ingredients and transparency in their food and drink choices. The market is expanding with a variety of flavors that cater to diverse tastes and preferences.
Flavored Sparkling Water Market Driver: Rising Popularity of Functional Beverages
The rising popularity of functional beverages is a major driver for the flavored sparkling water market. Consumers are increasingly looking for drinks that not only quench their thirst but also offer additional health benefits. Flavored sparkling water can be fortified with vitamins, minerals, antioxidants, and other functional ingredients, making it an attractive option for those seeking a healthy and refreshing beverage. This driver is supported by the increasing awareness of the importance of hydration and the desire for beverages that contribute to overall well-being without compromising on taste or convenience.
Flavored Sparkling Water Market Opportunity: Innovation in Unique and Exotic Flavor Combinations
There is a significant opportunity for growth in the flavored sparkling water market through innovation in unique and exotic flavor combinations. Companies can differentiate themselves by offering new and exciting flavors that go beyond the traditional options, such as tropical fruit blends, botanical infusions, and seasonal varieties. Additionally, developing limited-edition and regionally inspired flavors can capture consumer interest and drive sales. By focusing on flavor innovation and creating products that appeal to adventurous and health-conscious consumers, manufacturers can expand their market share and attract a broader audience. This approach not only satisfies the demand for variety but also enhances the brand's appeal in a competitive market.
Flavored Sparkling Water Market Share Analysis: Lemon segment generated the highest revenue share in the industry
In the Flavored Sparkling Water Market, the largest segment by type is Lemon-flavored sparkling water. Lemon remains a classic and popular flavor choice in the sparkling water category due to its refreshing and versatile profile. Lemon-flavored sparkling water appeals to consumers seeking a crisp and citrusy beverage without added sugars or calories, making it a preferred option for those focused on health and wellness. Its clean taste and ability to pair well with various foods and as a standalone refreshment have cemented lemon as a staple flavor in the sparkling water market.
Flavored Sparkling Water Market Share Analysis: Online Retail is the fastest growing segment over the forecast period to 2032
The fastest-growing segment in the Flavored Sparkling Water Market to 2032 is Online Retail. This segment encompasses the sale of flavored sparkling water through various e-commerce platforms and online stores. The growth of online retail channels for flavored sparkling water is driven by increasing consumer preference for convenient shopping options, especially post-pandemic. Online retail offers consumers a wide range of product choices, competitive pricing, and the convenience of home delivery, which has significantly contributed to its rapid expansion in the beverage market. Manufacturers and retailers are leveraging digital marketing strategies and partnerships with online platforms to capitalize on the growing demand for flavored sparkling water through online channels.
Flavored Sparkling Water Market Segmentation
By Type
Orange
Lemon
Raspberry
Blackberry
Apple
Others
By Application
Hypermarkets/ Supermarkets
Online Retail
Specialty Stores
Convenience Stores
Others
Countries Analyzed
North America (US, Canada, Mexico)
Europe (Germany, UK, France, Spain, Italy, Russia, Rest of Europe)
Asia Pacific (China, India, Japan, South Korea, Australia, South East Asia, Rest of Asia)
South America (Brazil, Argentina, Rest of South America)
Middle East and Africa (Saudi Arabia, UAE, Rest of Middle East, South Africa, Egypt, Rest of Africa)
Flavored Sparkling Water Companies Profiled in the Study
Adirondack Beverages Corporation
National Beverage Corp.
Nestlé S.A.
Nestlé Waters North America, Inc.
PepsiCo, Inc.
Sanpellegrino S.p.A.
The Coca-Cola Company
Voss of Norway ASA
Zevia PBC
*- List Not Exhaustive
Chapter 1. TABLE OF CONTENTS
Chapter 2. Introduction to Flavored Sparkling Water Market
2.1. Market Overview
2.2. Key Statistics and Report Highlights
2.3. Scope of the Comprehensive Study
2.3.1. Market Definition
2.3.2 Countries and Regions Covered
2.3.3 Research Objective
2.3.4 Units, Currency, and Conversions
2.3.5 Industry Value Chain
2.4. Key Market Segments
2.5. Key Companies
2.6. Study Period
Chapter 3. Strategic Analysis Review
3.1. Flavored Sparkling Water Pricing Analysis and Forecast
3.2. Porter’s Five Forces
3.3. Market Ecosystem
3.4. SWOT Analysis
3.5. Regulatory Scenario
3.3. Effects of Inflation, Russia-Ukraine War, moderating economic growth, and other macroeconomic factors
Chapter 4. Competitive Landscape
4.1. Market Share Analysis
4.1.1. Global Flavored Sparkling Water Market Share by Company, 2023
4.1.2. Product Offerings of Leading Flavored Sparkling Water Companies
4.2. Market Entropy
4.2.1. New Product Launches in the Industry
4.2.2. Mergers, Acquisitions, Joint ventures, and Partnerships
4.3. Key Strategies and Best Practices
Chapter 5. Global Market Projections: Best, Reference, and Low Case Scenarios
5.1. Growth Analysis- Case Scenario Definitions
5.2. Low Growth Case Scenario Forecasts
5.3. Reference Growth Case Scenario Forecasts
5.4. High Growth Case Scenario Forecasts
Chapter 6. Market Dynamics
6.1. Flavored Sparkling Water Market Drivers
6.2. Flavored Sparkling Water Market Challenges
6.6. Flavored Sparkling Water Market Opportunities
6.4. Flavored Sparkling Water Market Trends
Chapter 7. Global Flavored Sparkling Water Market Outlook Trends
7.1. Global Flavored Sparkling Water Revenue (USD Million) and CAGR (%) by Type (2021-2032)
7.2. Global Flavored Sparkling Water Revenue (USD Million) and CAGR (%) by Application (2021-2032)
7.3. Global Flavored Sparkling Water Revenue (USD Million) and CAGR (%) by Product (2021-2032)
By Type
Orange
Lemon
Raspberry
Blackberry
Apple
Others
By Application
Hypermarkets/ Supermarkets
Online Retail
Specialty Stores
Convenience Stores
Others
Chapter 8. Global Flavored Sparkling Water Regional Analysis and Outlook
8.1. Global Flavored Sparkling Water Revenue (USD Million) By Regions (2021- 2032)
8.2. North America Flavored Sparkling Water Revenue (USD Million) by Country (2021-2032)
8.2.1. United States Flavored Sparkling Water Regional Analysis and Outlook
8.2.2. Canada Flavored Sparkling Water Regional Analysis and Outlook
8.2.3. Mexico Flavored Sparkling Water Regional Analysis and Outlook
8.3. Europe Flavored Sparkling Water Revenue (USD Million), by Country (2021-2032)
8.3.1. Germany Flavored Sparkling Water Regional Analysis and Outlook
8.3.2. France Flavored Sparkling Water Regional Analysis and Outlook
8.3.3. United Kingdom Flavored Sparkling Water Regional Analysis and Outlook
8.3.4. Spain Flavored Sparkling Water Regional Analysis and Outlook
8.3.5. Italy Flavored Sparkling Water Regional Analysis and Outlook
8.3.6. Russia Flavored Sparkling Water Regional Analysis and Outlook
8.3.7. Rest of Europe Flavored Sparkling Water Regional Analysis and Outlook
8.4. Asia Pacific Flavored Sparkling Water Revenue (USD Million) by Country (2021-2032)
8.4.1. China Flavored Sparkling Water Regional Analysis and Outlook
8.4.2. Japan Flavored Sparkling Water Regional Analysis and Outlook
8.4.3. India Flavored Sparkling Water Regional Analysis and Outlook
8.4.4. South Korea Flavored Sparkling Water Regional Analysis and Outlook
8.4.5. Australia Flavored Sparkling Water Regional Analysis and Outlook
8.4.6. South East Asia Flavored Sparkling Water Regional Analysis and Outlook
8.4.7. Rest of Asia Pacific Flavored Sparkling Water Regional Analysis and Outlook
8.5. South America Flavored Sparkling Water Revenue (USD Million), by Country (2021-2032)
8.5.1. Brazil Flavored Sparkling Water Regional Analysis and Outlook
8.5.2. Argentina Flavored Sparkling Water Regional Analysis and Outlook
8.5.3. Rest of South America Flavored Sparkling Water Regional Analysis and Outlook
8.6. Middle East and Africa Flavored Sparkling Water Revenue (USD Million) by Country (2021-2032)
8.6.1. Middle East Flavored Sparkling Water Regional Analysis and Outlook
8.6.2. Africa Flavored Sparkling Water Regional Analysis and Outlook
Chapter 9. North America Flavored Sparkling Water Analysis and Outlook
9.1. North America Flavored Sparkling Water Revenue (USD Million) by Segments (2021-2032)
9.1.1. North America Flavored Sparkling Water Revenue (USD Million) by Type (2021-2032)
9.1.2. North America Flavored Sparkling Water Revenue (USD Million) by Application (2021-2032)
9.1.3. North America Flavored Sparkling Water Revenue (USD Million) by Product (2021-2032)
By Type
Orange
Lemon
Raspberry
Blackberry
Apple
Others
By Application
Hypermarkets/ Supermarkets
Online Retail
Specialty Stores
Convenience Stores
Others
Chapter 10. Europe Flavored Sparkling Water Analysis and Outlook
10.1. Europe Flavored Sparkling Water Revenue (USD Million), by Segments (USD Million) (2021-2032)
10.1.1. Europe Flavored Sparkling Water Revenue (USD Million) by Type (2021-2032)
10.1.2. Europe Flavored Sparkling Water Revenue (USD Million) by Application (2021-2032)
10.1.3. Europe Flavored Sparkling Water Revenue (USD Million) by Product (2021-2032)
By Type
Orange
Lemon
Raspberry
Blackberry
Apple
Others
By Application
Hypermarkets/ Supermarkets
Online Retail
Specialty Stores
Convenience Stores
Others
Chapter 11. Asia Pacific Flavored Sparkling Water Analysis and Outlook
11.1. Asia Pacific Flavored Sparkling Water Revenue (USD Million), and Revenue (USD Million) by Segments (2021-2032)
11.1.1. Asia Pacific Flavored Sparkling Water Revenue (USD Million) by Type (2021-2032)
11.1.2. Asia Pacific Flavored Sparkling Water Revenue (USD Million) by Application (2021-2032)
11.1.3. Asia Pacific Flavored Sparkling Water Revenue (USD Million) by Product (2021-2032)
By Type
Orange
Lemon
Raspberry
Blackberry
Apple
Others
By Application
Hypermarkets/ Supermarkets
Online Retail
Specialty Stores
Convenience Stores
Others
Chapter 12. South America Flavored Sparkling Water Analysis and Outlook
12.1. South America Flavored Sparkling Water Revenue (USD Million), by Segments (2021-2032)
12.1.1. South America Flavored Sparkling Water Revenue (USD Million) by Type (2021-2032)
12.1.2. South America Flavored Sparkling Water Revenue (USD Million) by Application (2021-2032)
12.1.3. South America Flavored Sparkling Water Revenue (USD Million) by Product (2021-2032)
By Type
Orange
Lemon
Raspberry
Blackberry
Apple
Others
By Application
Hypermarkets/ Supermarkets
Online Retail
Specialty Stores
Convenience Stores
Others
Chapter 13. Middle East and Africa Flavored Sparkling Water Analysis and Outlook
13.1. Middle East and Africa Flavored Sparkling Water Revenue (USD Million), by Segments (2021-2032)
13.1.1. Middle East and Africa Flavored Sparkling Water Revenue (USD Million) by Type (2021-2032)
13.1.2. Middle East and Africa Flavored Sparkling Water Revenue (USD Million) by Application (2021-2032)
13.1.3. Middle East and Africa Flavored Sparkling Water Revenue (USD Million) by Product (2021-2032)
By Type
Orange
Lemon
Raspberry
Blackberry
Apple
Others
By Application
Hypermarkets/ Supermarkets
Online Retail
Specialty Stores
Convenience Stores
Others
Chapter 14. Flavored Sparkling Water Company Profiles
14.1 Business Overview
14.2 Product Profiles
14.3 SWOT Profiles
14.5 Recent Developments
14.6 Financial Profile
List of Companies
Adirondack Beverages Corporation
National Beverage Corp.
Nestlé S.A.
Nestlé Waters North America, Inc.
PepsiCo, Inc.
Sanpellegrino S.p.A.
The Coca-Cola Company
Voss of Norway ASA
Zevia PBC
15. Methodology and Data Sources
15.1 Customization Offerings
15.2 Subscription Services
15.3 Related Reports
15.4 Publisher Expertise
LIST OF TABLES
Table 1 Market Segmentation Analysis
Table 2 Global Flavored Sparkling Water Market Share of Leading Companies, 2023
Table 3 Product Offerings of Leading Companies
Table 4 Low Growth Scenario Forecasts
Table 5 Reference Case Growth Scenario
Table 6 High Growth Case Scenario
Table 7 Global Flavored Sparkling Water Revenue (USD Million) And CAGR (%) By Type (2021-2032)
Table 8 Global Flavored Sparkling Water Revenue (USD Million) And CAGR (%) By Application (2021-2032)
Table 9 Global Flavored Sparkling Water Revenue (USD Million) And CAGR (%) By Product (2021-2032)
Table 10 Global Flavored Sparkling Water Market Revenue (USD Million) By Regions (2021-2032)
Table 11 Global Flavored Sparkling Water Market Share (%) By Regions (2021-2032)
Table 12 North America Flavored Sparkling Water Revenue (USD Million) By Country (2021-2032)
Table 13 Europe Flavored Sparkling Water Revenue (USD Million) By Country (2021-2032)
Table 14 Asia Pacific Flavored Sparkling Water Revenue (USD Million) By Country (2021-2032)
Table 15 South America Flavored Sparkling Water Revenue (USD Million) By Country (2021-2032)
Table 16 Middle East and Africa Flavored Sparkling Water Revenue (USD Million) By Region (2021-2032)
Table 17 North America Flavored Sparkling Water Revenue (USD Million) By Type (2021-2032)
Table 18 North America Flavored Sparkling Water Revenue (USD Million) By Application (2021-2032)
Table 19 North America Flavored Sparkling Water Revenue (USD Million) By Product (2021-2032)
Table 20 Europe Flavored Sparkling Water Revenue (USD Million) By Type (2021-2032)
Table 21 Europe Flavored Sparkling Water Revenue (USD Million) By Application (2021-2032)
Table 22 Europe Flavored Sparkling Water Revenue (USD Million) By Product (2021-2032)
Table 23 Asia Pacific Flavored Sparkling Water Revenue (USD Million) By Type (2021-2032)
Table 24 Asia Pacific Flavored Sparkling Water Revenue (USD Million) By Application (2021-2032)
Table 25 Asia Pacific Flavored Sparkling Water Revenue (USD Million) By Product (2021-2032)
Table 26 South America Flavored Sparkling Water Revenue (USD Million) By Type (2021-2032)
Table 27 South America Flavored Sparkling Water Revenue (USD Million) By Application (2021-2032)
Table 28 South America Flavored Sparkling Water Revenue (USD Million) By Product (2021-2032)
Table 29 Middle East and Africa Flavored Sparkling Water Revenue (USD Million) By Type (2021-2032)
Table 30 Middle East and Africa Flavored Sparkling Water Revenue (USD Million) By Application (2021-2032)
Table 31 Middle East and Africa Flavored Sparkling Water Revenue (USD Million) By Product (2021-2032)
LIST OF FIGURES
Figure 1. Market Scope
Figure 2. Pricing Forecasts Per Unit, 2023- 2032
Figure 3. Porter’s Five Forces
Figure 4. Global Flavored Sparkling Water Market Revenue (USD Million) By Regions (2021-2032)
Figure 5. Global Flavored Sparkling Water Market Share (%) By Regions (2023)
Figure 6. North America Flavored Sparkling Water Revenue (USD Million) By Country (2021-2032)
Figure 7. United States Flavored Sparkling Water Revenue (USD Million) By Country (2021-2032)
Figure 8. Canada Flavored Sparkling Water Revenue (USD Million) By Country (2021-2032)
Figure 9. Mexico Flavored Sparkling Water Revenue (USD Million) By Country (2021-2032)
Figure 10. Europe Flavored Sparkling Water Revenue (USD Million) By Country (2021-2032)
Figure 11. Germany Flavored Sparkling Water Revenue (USD Million) By Country (2021-2032)
Figure 12. France Flavored Sparkling Water Revenue (USD Million) By Country (2021-2032)
Figure 13. United Kingdom Flavored Sparkling Water Revenue (USD Million) By Country (2021-2032)
Figure 14. Spain Flavored Sparkling Water Revenue (USD Million) By Country (2021-2032)
Figure 15. Italy Flavored Sparkling Water Revenue (USD Million) By Country (2021-2032)
Figure 16. Russia Flavored Sparkling Water Revenue (USD Million) By Country (2021-2032)
Figure 17. Rest of Europe Flavored Sparkling Water Revenue (USD Million) By Country (2021-2032)
Figure 11. Asia Pacific Flavored Sparkling Water Revenue (USD Million) By Country (2021-2032)
Figure 12. China Flavored Sparkling Water Revenue (USD Million) By Country (2021-2032)
Figure 13. Japan Flavored Sparkling Water Revenue (USD Million) By Country (2021-2032)
Figure 14. India Flavored Sparkling Water Revenue (USD Million) By Country (2021-2032)
Figure 15. South Korea Flavored Sparkling Water Revenue (USD Million) By Country (2021-2032)
Figure 16. Australia Flavored Sparkling Water Revenue (USD Million) By Country (2021-2032)
Figure 17. South East Asia Flavored Sparkling Water Revenue (USD Million) By Country (2021-2032)
Figure 18. South America Flavored Sparkling Water Revenue (USD Million) By Country (2021-2032)
Figure 19. Brazil Flavored Sparkling Water Revenue (USD Million) By Country (2021-2032)
Figure 20. Argentina Flavored Sparkling Water Revenue (USD Million) By Country (2021-2032)
Figure 21. Rest of Asia Pacific Flavored Sparkling Water Revenue (USD Million) By Country (2021-2032)
Figure 22. Middle East and Africa Flavored Sparkling Water Revenue (USD Million) By Region (2021-2032)
Figure 23. Saudi Arabia Flavored Sparkling Water Revenue (USD Million) By Region (2021-2032)
Figure 24. The UAE Flavored Sparkling Water Revenue (USD Million) By Region (2021-2032)
Figure 25. Rest of Middle East Flavored Sparkling Water Revenue (USD Million) By Region (2021-2032)
Figure 26. South Africa Flavored Sparkling Water Revenue (USD Million) By Region (2021-2032)
Figure 27. Africa Flavored Sparkling Water Revenue (USD Million) By Region (2021-2032)
Figure 28. North America Flavored Sparkling Water Revenue (USD Million) By Type (2021-2032)
Figure 29. North America Flavored Sparkling Water Revenue (USD Million) By Application (2021-2032)
Figure 30. North America Flavored Sparkling Water Revenue (USD Million) By Product (2021-2032)
Figure 31. Europe Flavored Sparkling Water Revenue (USD Million) By Type (2021-2032)
Figure 32. Europe Flavored Sparkling Water Revenue (USD Million) By Application (2021-2032)
Figure 33. Europe Flavored Sparkling Water Revenue (USD Million) By Product (2021-2032)
Figure 34. Asia Pacific Flavored Sparkling Water Revenue (USD Million) By Type (2021-2032)
Figure 35. Asia Pacific Flavored Sparkling Water Revenue (USD Million) By Application (2021-2032)
Figure 36. Asia Pacific Flavored Sparkling Water Revenue (USD Million) By Product (2021-2032)
Figure 37. South America Flavored Sparkling Water Revenue (USD Million) By Type (2021-2032)
Figure 38. South America Flavored Sparkling Water Revenue (USD Million) By Application (2021-2032)
Figure 39. South America Flavored Sparkling Water Revenue (USD Million) By Product (2021-2032)
Figure 40. Middle East and Africa Flavored Sparkling Water Revenue (USD Million) By Type (2021-2032)
Figure 41. Middle East and Africa Flavored Sparkling Water Revenue (USD Million) By Application (2021-2032)
Figure 42. Middle East and Africa Flavored Sparkling Water Revenue (USD Million) By Product (2021-2032)
By Type
Orange
Lemon
Raspberry
Blackberry
Apple
Others
By Application
Hypermarkets/ Supermarkets
Online Retail
Specialty Stores
Convenience Stores
Others
Countries Analyzed
North America (US, Canada, Mexico)
Europe (Germany, UK, France, Spain, Italy, Russia, Rest of Europe)
Asia Pacific (China, India, Japan, South Korea, Australia, South East Asia, Rest of Asia)
South America (Brazil, Argentina, Rest of South America)
Middle East and Africa (Saudi Arabia, UAE, Rest of Middle East, South Africa, Egypt, Rest of Africa)
