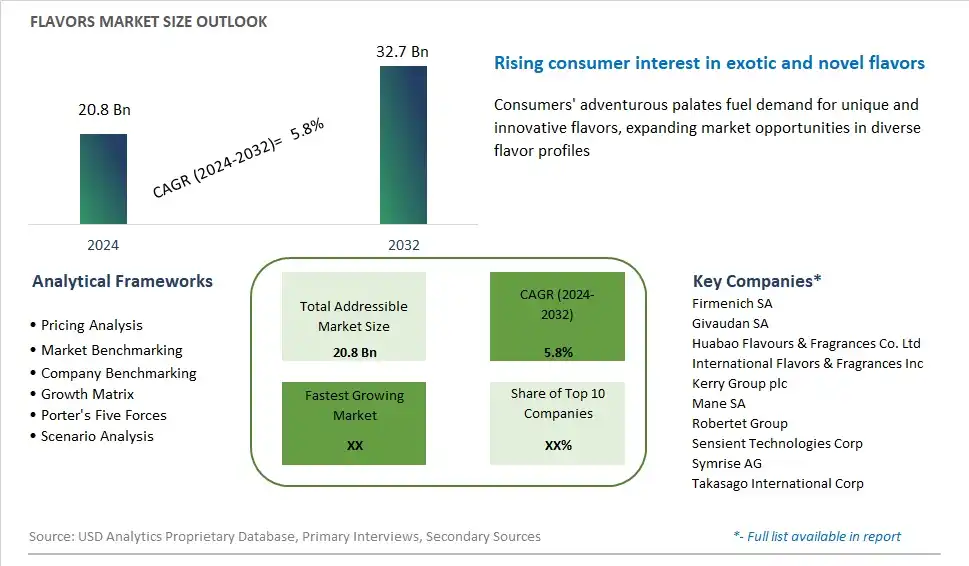
Global Flavors Market Size is valued at $20.8 Billion in 2024 and is forecast to register a growth rate (CAGR) of 5.8% to reach $32.7 Billion by 2032.
The global Flavors Market Comprehensive Study analyzes and forecasts the market size across 6 regions and 24 countries for diverse segments -By Nature (Natural, Synthetic), By Form (Powder, Liquid), By Application (Food, Beverages, Others)
An Introduction to Flavors Market
In 2024, the flavors market is thriving, driven by the diverse and evolving tastes of global consumers. Flavors, which encompass both natural and artificial varieties, play a critical role in the food and beverage industry, enhancing the sensory appeal of products. The market is benefiting from the growing demand for innovative and exotic flavors that cater to adventurous palates. The shift towards natural and organic ingredients is prompting manufacturers to develop flavors derived from plant-based sources, including fruits, herbs, and spices. Technological advancements in flavor extraction and formulation are enabling the creation of more complex and authentic flavor profiles. Additionally, the trend towards personalized nutrition and functional foods is driving demand for flavors that complement health-focused products. The flavors market is set for continued growth as consumers seek unique and enjoyable taste experiences.
Flavors Competitive Landscape
The market report analyses the leading companies in the industry including Firmenich SA, Givaudan SA, Huabao Flavours & Fragrances Co. Ltd, International Flavors & Fragrances Inc, Kerry Group plc, Mane SA, Robertet Group, Sensient Technologies Corp, Symrise AG, Takasago International Corp, and Others.
Flavors Market Dynamics
Flavors Market Trend: Shift Towards Clean Label and Natural Flavors
One of the most prominent trends in the flavors market is the shift towards clean label and natural flavors. Consumers are increasingly scrutinizing product labels and seeking transparency regarding the ingredients used in their food and beverages. As a result, there is a growing preference for flavors derived from natural sources such as fruits, herbs, spices, and botanicals, as opposed to synthetic or artificial additives. This trend is driven by concerns about health and wellness, as well as a desire for more authentic and wholesome eating experiences. Manufacturers in the flavors industry are responding by developing innovative extraction techniques and flavor formulations that preserve the integrity of natural ingredients while meeting consumer demand for clean label products. By aligning with this trend and offering natural flavors, companies can enhance their appeal to health-conscious consumers and differentiate their products in the market.
Market Driver: Increasing Demand for Customization and Personalization
A key driver of the flavors market is the increasing demand for customization and personalization in food and beverage products. Consumers today seek products that cater to their individual tastes, preferences, and dietary needs. This demand for customization extends to flavor profiles, with consumers looking for unique and personalized taste experiences. Whether it's customizing a beverage with different flavor combinations or selecting a snack with a specific flavor profile, consumers expect options that reflect their diverse preferences. This driver is fueled by factors such as changing lifestyles, cultural diversity, and the influence of social media and digital platforms on consumer behavior. Flavor manufacturers have an opportunity to capitalize on this trend by offering a wide range of flavor options and customizable solutions that allow food and beverage companies to create products tailored to their target audience. By providing innovative flavor options and supporting customization efforts, companies can drive growth and foster brand loyalty in the market.
Market Opportunity: Expansion into Plant-Based and Alternative Flavors
A significant opportunity for the flavors market lies in the expansion into plant-based and alternative flavors. With the growing interest in plant-based diets, sustainability, and ethical consumption, there is a rising demand for flavors derived from plant sources. This presents an opportunity for flavor manufacturers to innovate and develop a diverse range of plant-based flavors that mimic the taste and aroma of traditional animal-derived ingredients. Additionally, there is a growing interest in alternative flavors that cater to specific dietary preferences and lifestyle choices, such as vegan, gluten-free, and allergen-friendly options. By investing in research and development, flavor companies can create plant-based flavor solutions that meet the needs of a rapidly evolving market. Moreover, by partnering with food and beverage companies to incorporate plant-based flavors into their products, manufacturers can tap into the growing demand for plant-powered innovation and contribute to the sustainability and health-consciousness of the industry.
Flavors Market Share Analysis: Natural Flavors held the dominant market share in 2024
Within the Flavors Market, the natural flavors segment is the largest, commanding a significant share of the industry. This dominance can be attributed to several factors, including growing consumer preference for clean label products, increasing awareness of health and wellness, and regulatory scrutiny over synthetic ingredients. Natural flavors, derived from real fruits, vegetables, herbs, and spices, offer an authentic and wholesome taste experience to consumers, aligning with their desire for transparency and authenticity in food and beverage products. Further, natural flavors are perceived as safer and healthier alternatives to synthetic counterparts, as they do not contain artificial additives or chemical compounds. Additionally, the rising demand for natural and organic food and beverage products, driven by factors such as clean eating trends and environmental sustainability, further propels the growth of the natural flavors segment in the market. As manufacturers continue to reformulate their products to meet consumer preferences and regulatory requirements, the natural flavors segment is expected to maintain its stronghold, driving market growth and innovation in the Flavors Market.
Flavors Market Share Analysis: Liquid Form market is poised to register the fastest growth rae over the forecast period to 2032
Among the forms in the Flavors Market, the liquid form segment stands out as the fastest-growing, experiencing significant expansion in recent years. The robust growth outlook is driven by several factors, including technological advancements in flavor extraction and encapsulation, as well as shifting consumer preferences towards convenient and versatile flavor formats. Liquid flavors offer several advantages over powder forms, including ease of integration into food and beverage applications, uniform dispersion, and enhanced flavor release. Further, liquid flavors are favored by manufacturers for their flexibility in formulation and ability to create complex and nuanced flavor profiles. Additionally, the rising demand for ready-to-drink beverages, flavored dairy products, and functional beverages drives the adoption of liquid flavors in the market. As consumers continue to seek out innovative and indulgent flavor experiences in their food and beverage choices, the liquid form segment is expected to sustain its rapid growth trajectory, driving market expansion and innovation in the Flavors Market.
Flavors Market Share Analysis: Beverages Application held the dominant market share in 2024
Within the Flavors Market, the beverages application segment is the largest, commanding a significant share of the industry. This dominance can be attributed to several factors, including the diverse range of beverage categories that utilize flavorings, the growing demand for innovative and exotic beverage flavors, and the increasing popularity of functional and flavored beverages. Beverages encompass a wide variety of products, including carbonated soft drinks, juices, sports drinks, flavored water, tea, coffee, and alcoholic beverages, among others. Further, the beverage industry is characterized by constant innovation and product development, with manufacturers continually introducing new flavors and formulations to cater to evolving consumer preferences and trends. Additionally, the rising health and wellness trend has spurred the demand for natural and organic flavorings in beverages, further driving the growth of this segment. As consumers increasingly seek out flavorful and unique beverage options, the beverages application segment is expected to maintain its stronghold, driving market growth and innovation in the Flavors Market.
Flavors Market Segmentation
By Nature
Natural
Synthetic
By Form
Powder
Liquid
By Application
Food
Beverages
Others
Countries Analyzed
North America (US, Canada, Mexico)
Europe (Germany, UK, France, Spain, Italy, Russia, Rest of Europe)
Asia Pacific (China, India, Japan, South Korea, Australia, South East Asia, Rest of Asia)
South America (Brazil, Argentina, Rest of South America)
Middle East and Africa (Saudi Arabia, UAE, Rest of Middle East, South Africa, Egypt, Rest of Africa)
Flavors Companies Profiled in the Study
Firmenich SA
Givaudan SA
Huabao Flavours & Fragrances Co. Ltd
International Flavors & Fragrances Inc
Kerry Group plc
Mane SA
Robertet Group
Sensient Technologies Corp
Symrise AG
Takasago International Corp
*- List Not Exhaustive
Chapter 1. TABLE OF CONTENTS
Chapter 2. Introduction to Flavors Market
2.1. Market Overview
2.2. Key Statistics and Report Highlights
2.3. Scope of the Comprehensive Study
2.3.1. Market Definition
2.3.2 Countries and Regions Covered
2.3.3 Research Objective
2.3.4 Units, Currency, and Conversions
2.3.5 Industry Value Chain
2.4. Key Market Segments
2.5. Key Companies
2.6. Study Period
Chapter 3. Strategic Analysis Review
3.1. Flavors Pricing Analysis and Forecast
3.2. Porter’s Five Forces
3.3. Market Ecosystem
3.4. SWOT Analysis
3.5. Regulatory Scenario
3.3. Effects of Inflation, Russia-Ukraine War, moderating economic growth, and other macroeconomic factors
Chapter 4. Competitive Landscape
4.1. Market Share Analysis
4.1.1. Global Flavors Market Share by Company, 2023
4.1.2. Product Offerings of Leading Flavors Companies
4.2. Market Entropy
4.2.1. New Product Launches in the Industry
4.2.2. Mergers, Acquisitions, Joint ventures, and Partnerships
4.3. Key Strategies and Best Practices
Chapter 5. Global Market Projections: Best, Reference, and Low Case Scenarios
5.1. Growth Analysis- Case Scenario Definitions
5.2. Low Growth Case Scenario Forecasts
5.3. Reference Growth Case Scenario Forecasts
5.4. High Growth Case Scenario Forecasts
Chapter 6. Market Dynamics
6.1. Flavors Market Drivers
6.2. Flavors Market Challenges
6.6. Flavors Market Opportunities
6.4. Flavors Market Trends
Chapter 7. Global Flavors Market Outlook Trends
7.1. Global Flavors Revenue (USD Million) and CAGR (%) by Type (2021-2032)
7.2. Global Flavors Revenue (USD Million) and CAGR (%) by Application (2021-2032)
7.3. Global Flavors Revenue (USD Million) and CAGR (%) by Product (2021-2032)
By Nature
Natural
Synthetic
By Form
Powder
Liquid
By Application
Food
Beverages
Others
Chapter 8. Global Flavors Regional Analysis and Outlook
8.1. Global Flavors Revenue (USD Million) By Regions (2021- 2032)
8.2. North America Flavors Revenue (USD Million) by Country (2021-2032)
8.2.1. United States Flavors Regional Analysis and Outlook
8.2.2. Canada Flavors Regional Analysis and Outlook
8.2.3. Mexico Flavors Regional Analysis and Outlook
8.3. Europe Flavors Revenue (USD Million), by Country (2021-2032)
8.3.1. Germany Flavors Regional Analysis and Outlook
8.3.2. France Flavors Regional Analysis and Outlook
8.3.3. United Kingdom Flavors Regional Analysis and Outlook
8.3.4. Spain Flavors Regional Analysis and Outlook
8.3.5. Italy Flavors Regional Analysis and Outlook
8.3.6. Russia Flavors Regional Analysis and Outlook
8.3.7. Rest of Europe Flavors Regional Analysis and Outlook
8.4. Asia Pacific Flavors Revenue (USD Million) by Country (2021-2032)
8.4.1. China Flavors Regional Analysis and Outlook
8.4.2. Japan Flavors Regional Analysis and Outlook
8.4.3. India Flavors Regional Analysis and Outlook
8.4.4. South Korea Flavors Regional Analysis and Outlook
8.4.5. Australia Flavors Regional Analysis and Outlook
8.4.6. South East Asia Flavors Regional Analysis and Outlook
8.4.7. Rest of Asia Pacific Flavors Regional Analysis and Outlook
8.5. South America Flavors Revenue (USD Million), by Country (2021-2032)
8.5.1. Brazil Flavors Regional Analysis and Outlook
8.5.2. Argentina Flavors Regional Analysis and Outlook
8.5.3. Rest of South America Flavors Regional Analysis and Outlook
8.6. Middle East and Africa Flavors Revenue (USD Million) by Country (2021-2032)
8.6.1. Middle East Flavors Regional Analysis and Outlook
8.6.2. Africa Flavors Regional Analysis and Outlook
Chapter 9. North America Flavors Analysis and Outlook
9.1. North America Flavors Revenue (USD Million) by Segments (2021-2032)
9.1.1. North America Flavors Revenue (USD Million) by Type (2021-2032)
9.1.2. North America Flavors Revenue (USD Million) by Application (2021-2032)
9.1.3. North America Flavors Revenue (USD Million) by Product (2021-2032)
By Nature
Natural
Synthetic
By Form
Powder
Liquid
By Application
Food
Beverages
Others
Chapter 10. Europe Flavors Analysis and Outlook
10.1. Europe Flavors Revenue (USD Million), by Segments (USD Million) (2021-2032)
10.1.1. Europe Flavors Revenue (USD Million) by Type (2021-2032)
10.1.2. Europe Flavors Revenue (USD Million) by Application (2021-2032)
10.1.3. Europe Flavors Revenue (USD Million) by Product (2021-2032)
By Nature
Natural
Synthetic
By Form
Powder
Liquid
By Application
Food
Beverages
Others
Chapter 11. Asia Pacific Flavors Analysis and Outlook
11.1. Asia Pacific Flavors Revenue (USD Million), and Revenue (USD Million) by Segments (2021-2032)
11.1.1. Asia Pacific Flavors Revenue (USD Million) by Type (2021-2032)
11.1.2. Asia Pacific Flavors Revenue (USD Million) by Application (2021-2032)
11.1.3. Asia Pacific Flavors Revenue (USD Million) by Product (2021-2032)
By Nature
Natural
Synthetic
By Form
Powder
Liquid
By Application
Food
Beverages
Others
Chapter 12. South America Flavors Analysis and Outlook
12.1. South America Flavors Revenue (USD Million), by Segments (2021-2032)
12.1.1. South America Flavors Revenue (USD Million) by Type (2021-2032)
12.1.2. South America Flavors Revenue (USD Million) by Application (2021-2032)
12.1.3. South America Flavors Revenue (USD Million) by Product (2021-2032)
By Nature
Natural
Synthetic
By Form
Powder
Liquid
By Application
Food
Beverages
Others
Chapter 13. Middle East and Africa Flavors Analysis and Outlook
13.1. Middle East and Africa Flavors Revenue (USD Million), by Segments (2021-2032)
13.1.1. Middle East and Africa Flavors Revenue (USD Million) by Type (2021-2032)
13.1.2. Middle East and Africa Flavors Revenue (USD Million) by Application (2021-2032)
13.1.3. Middle East and Africa Flavors Revenue (USD Million) by Product (2021-2032)
By Nature
Natural
Synthetic
By Form
Powder
Liquid
By Application
Food
Beverages
Others
Chapter 14. Flavors Company Profiles
14.1 Business Overview
14.2 Product Profiles
14.3 SWOT Profiles
14.5 Recent Developments
14.6 Financial Profile
List of Companies
Firmenich SA
Givaudan SA
Huabao Flavours & Fragrances Co. Ltd
International Flavors & Fragrances Inc
Kerry Group plc
Mane SA
Robertet Group
Sensient Technologies Corp
Symrise AG
Takasago International Corp
15. Methodology and Data Sources
15.1 Customization Offerings
15.2 Subscription Services
15.3 Related Reports
15.4 Publisher Expertise
LIST OF TABLES
Table 1 Market Segmentation Analysis
Table 2 Global Flavors Market Share of Leading Companies, 2023
Table 3 Product Offerings of Leading Companies
Table 4 Low Growth Scenario Forecasts
Table 5 Reference Case Growth Scenario
Table 6 High Growth Case Scenario
Table 7 Global Flavors Revenue (USD Million) And CAGR (%) By Type (2021-2032)
Table 8 Global Flavors Revenue (USD Million) And CAGR (%) By Application (2021-2032)
Table 9 Global Flavors Revenue (USD Million) And CAGR (%) By Product (2021-2032)
Table 10 Global Flavors Market Revenue (USD Million) By Regions (2021-2032)
Table 11 Global Flavors Market Share (%) By Regions (2021-2032)
Table 12 North America Flavors Revenue (USD Million) By Country (2021-2032)
Table 13 Europe Flavors Revenue (USD Million) By Country (2021-2032)
Table 14 Asia Pacific Flavors Revenue (USD Million) By Country (2021-2032)
Table 15 South America Flavors Revenue (USD Million) By Country (2021-2032)
Table 16 Middle East and Africa Flavors Revenue (USD Million) By Region (2021-2032)
Table 17 North America Flavors Revenue (USD Million) By Type (2021-2032)
Table 18 North America Flavors Revenue (USD Million) By Application (2021-2032)
Table 19 North America Flavors Revenue (USD Million) By Product (2021-2032)
Table 20 Europe Flavors Revenue (USD Million) By Type (2021-2032)
Table 21 Europe Flavors Revenue (USD Million) By Application (2021-2032)
Table 22 Europe Flavors Revenue (USD Million) By Product (2021-2032)
Table 23 Asia Pacific Flavors Revenue (USD Million) By Type (2021-2032)
Table 24 Asia Pacific Flavors Revenue (USD Million) By Application (2021-2032)
Table 25 Asia Pacific Flavors Revenue (USD Million) By Product (2021-2032)
Table 26 South America Flavors Revenue (USD Million) By Type (2021-2032)
Table 27 South America Flavors Revenue (USD Million) By Application (2021-2032)
Table 28 South America Flavors Revenue (USD Million) By Product (2021-2032)
Table 29 Middle East and Africa Flavors Revenue (USD Million) By Type (2021-2032)
Table 30 Middle East and Africa Flavors Revenue (USD Million) By Application (2021-2032)
Table 31 Middle East and Africa Flavors Revenue (USD Million) By Product (2021-2032)
LIST OF FIGURES
Figure 1. Market Scope
Figure 2. Pricing Forecasts Per Unit, 2023- 2032
Figure 3. Porter’s Five Forces
Figure 4. Global Flavors Market Revenue (USD Million) By Regions (2021-2032)
Figure 5. Global Flavors Market Share (%) By Regions (2023)
Figure 6. North America Flavors Revenue (USD Million) By Country (2021-2032)
Figure 7. United States Flavors Revenue (USD Million) By Country (2021-2032)
Figure 8. Canada Flavors Revenue (USD Million) By Country (2021-2032)
Figure 9. Mexico Flavors Revenue (USD Million) By Country (2021-2032)
Figure 10. Europe Flavors Revenue (USD Million) By Country (2021-2032)
Figure 11. Germany Flavors Revenue (USD Million) By Country (2021-2032)
Figure 12. France Flavors Revenue (USD Million) By Country (2021-2032)
Figure 13. United Kingdom Flavors Revenue (USD Million) By Country (2021-2032)
Figure 14. Spain Flavors Revenue (USD Million) By Country (2021-2032)
Figure 15. Italy Flavors Revenue (USD Million) By Country (2021-2032)
Figure 16. Russia Flavors Revenue (USD Million) By Country (2021-2032)
Figure 17. Rest of Europe Flavors Revenue (USD Million) By Country (2021-2032)
Figure 11. Asia Pacific Flavors Revenue (USD Million) By Country (2021-2032)
Figure 12. China Flavors Revenue (USD Million) By Country (2021-2032)
Figure 13. Japan Flavors Revenue (USD Million) By Country (2021-2032)
Figure 14. India Flavors Revenue (USD Million) By Country (2021-2032)
Figure 15. South Korea Flavors Revenue (USD Million) By Country (2021-2032)
Figure 16. Australia Flavors Revenue (USD Million) By Country (2021-2032)
Figure 17. South East Asia Flavors Revenue (USD Million) By Country (2021-2032)
Figure 18. South America Flavors Revenue (USD Million) By Country (2021-2032)
Figure 19. Brazil Flavors Revenue (USD Million) By Country (2021-2032)
Figure 20. Argentina Flavors Revenue (USD Million) By Country (2021-2032)
Figure 21. Rest of Asia Pacific Flavors Revenue (USD Million) By Country (2021-2032)
Figure 22. Middle East and Africa Flavors Revenue (USD Million) By Region (2021-2032)
Figure 23. Saudi Arabia Flavors Revenue (USD Million) By Region (2021-2032)
Figure 24. The UAE Flavors Revenue (USD Million) By Region (2021-2032)
Figure 25. Rest of Middle East Flavors Revenue (USD Million) By Region (2021-2032)
Figure 26. South Africa Flavors Revenue (USD Million) By Region (2021-2032)
Figure 27. Africa Flavors Revenue (USD Million) By Region (2021-2032)
Figure 28. North America Flavors Revenue (USD Million) By Type (2021-2032)
Figure 29. North America Flavors Revenue (USD Million) By Application (2021-2032)
Figure 30. North America Flavors Revenue (USD Million) By Product (2021-2032)
Figure 31. Europe Flavors Revenue (USD Million) By Type (2021-2032)
Figure 32. Europe Flavors Revenue (USD Million) By Application (2021-2032)
Figure 33. Europe Flavors Revenue (USD Million) By Product (2021-2032)
Figure 34. Asia Pacific Flavors Revenue (USD Million) By Type (2021-2032)
Figure 35. Asia Pacific Flavors Revenue (USD Million) By Application (2021-2032)
Figure 36. Asia Pacific Flavors Revenue (USD Million) By Product (2021-2032)
Figure 37. South America Flavors Revenue (USD Million) By Type (2021-2032)
Figure 38. South America Flavors Revenue (USD Million) By Application (2021-2032)
Figure 39. South America Flavors Revenue (USD Million) By Product (2021-2032)
Figure 40. Middle East and Africa Flavors Revenue (USD Million) By Type (2021-2032)
Figure 41. Middle East and Africa Flavors Revenue (USD Million) By Application (2021-2032)
Figure 42. Middle East and Africa Flavors Revenue (USD Million) By Product (2021-2032)
By Nature
Natural
Synthetic
By Form
Powder
Liquid
By Application
Food
Beverages
Others
Countries Analyzed
North America (US, Canada, Mexico)
Europe (Germany, UK, France, Spain, Italy, Russia, Rest of Europe)
Asia Pacific (China, India, Japan, South Korea, Australia, South East Asia, Rest of Asia)
South America (Brazil, Argentina, Rest of South America)
Middle East and Africa (Saudi Arabia, UAE, Rest of Middle East, South Africa, Egypt, Rest of Africa)
