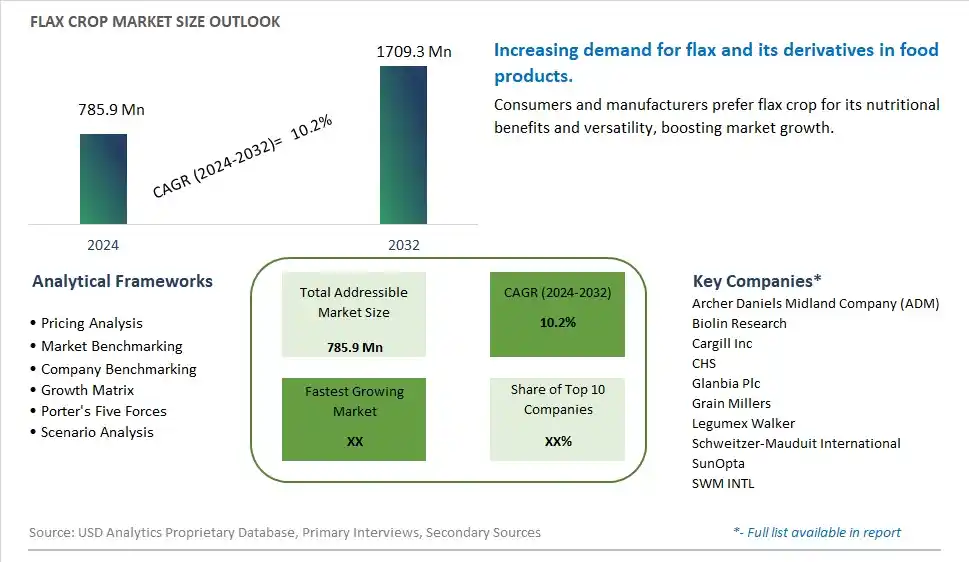
Global Flax Crop Market Size is valued at $785.9 Million in 2024 and is forecast to register a growth rate (CAGR) of 10.2% to reach $1709.3 Million by 2032.
The global Flax Crop Market Comprehensive Study analyzes and forecasts the market size across 6 regions and 24 countries for diverse segments -By Type (Seeds, Stalk Parts, Straw), By Application (Textile, Paper, Paints and Coatings, Medical, Insulation, Animal Feed, Food and Beverage, Others)
An Introduction to Flax Crop Market
The flax crop market in 2024 is expanding rapidly, driven by the demand for flax seeds and flaxseed oil, known for their high content of omega-3 fatty acids, fiber, and lignans. Flax crops are cultivated for use in food, nutritional supplements, and industrial applications. The market benefits from innovations in agricultural practices and processing technologies that improve yield and product quality. The trend towards clean label and natural ingredients is influencing product development. Increasing consumer interest in plant-based nutrition and the popularity of functional foods are further supporting market growth.
Flax Crop Competitive Landscape
The market report analyses the leading companies in the industry including Archer Daniels Midland Company (ADM), Biolin Research, Cargill Inc, CHS, Glanbia Plc, Grain Millers, Legumex Walker, Schweitzer-Mauduit International, SunOpta, SWM INTL, and Others.
Flax Crop Market Dynamics
Flax Crop Market Trend: Increasing Demand for Flax Seeds and Flaxseed Oil
The most prominent trend in the Flax Crop Market is the increasing demand for flax seeds and flaxseed oil. Consumers are seeking flax products due to their nutritional benefits, including high omega-3 fatty acids and fiber content. This trend is driven by the growing awareness of the health benefits of flax and its incorporation into various food products and supplements.
Flax Crop Market Driver: Health Consciousness and Nutritional Benefits
A key driver in the Flax Crop Market is health consciousness and the recognized nutritional benefits of flax. As more individuals focus on improving their diet and incorporating nutrient-dense foods, there is a rising demand for flax products that support heart health, digestion, and overall wellness. This demand supports market growth as consumers seek natural and health-enhancing food ingredients.
Flax Crop Market Opportunity: Expansion into Functional Foods and Beverages
One significant opportunity in the Flax Crop Market lies in the expansion into functional foods and beverages. Companies can innovate by incorporating flax seeds and flaxseed oil into various products, such as health bars, protein shakes, and baked goods, offering consumers convenient and health-focused options. By highlighting the benefits and versatility of flax, manufacturers can attract a broader consumer base and drive market growth.
Flax Crop Market Share Analysis- Largest Segment by Type
In the Flax Crop Market, Seeds represent the largest segment. This dominance is attributable to the versatile uses of flax seeds in various industries. Flax seeds are highly valued for their rich content of omega-3 fatty acids, fiber, and lignans, making them essential in the health and nutrition sector. They are widely used in food products for their nutritional benefits and in dietary supplements. Additionally, the seeds are crucial for producing flaxseed oil, which is used in cooking and as a supplement. The established demand for flax seeds in both consumer food products and health supplements ensures their position as the largest segment in the market.
Flax Crop Market Share Analysis- Poised to Grow Fastest Over the Next Five Years by Application
The Medical application segment in the Flax Crop Market is poised to grow the fastest over the next five years. This growth is driven by increasing awareness of the health benefits associated with flaxseed derivatives, such as flaxseed oil, which is used in various therapeutic applications. Flax seeds and their derivatives are known for their anti-inflammatory, antioxidant, and heart-healthy properties. The rising prevalence of chronic diseases and the growing emphasis on preventive healthcare are to boost the demand for flax-based medical products. Innovations in medical uses and the expanding research on the health benefits of flax components are expected to drive significant growth in this segment.
Flax Crop Market Segmentation
By Type
Seeds
Stalk Parts
Straw
By Application
Textile
Paper
Paints and Coatings
Medical
Insulation
Animal Feed
Food and Beverage
Others
Countries Analyzed
North America (US, Canada, Mexico)
Europe (Germany, UK, France, Spain, Italy, Russia, Rest of Europe)
Asia Pacific (China, India, Japan, South Korea, Australia, South East Asia, Rest of Asia)
South America (Brazil, Argentina, Rest of South America)
Middle East and Africa (Saudi Arabia, UAE, Rest of Middle East, South Africa, Egypt, Rest of Africa)
Flax Crop Companies Profiled in the Study
Archer Daniels Midland Company (ADM)
Biolin Research
Cargill Inc
CHS
Glanbia Plc
Grain Millers
Legumex Walker
Schweitzer-Mauduit International
SunOpta
SWM INTL
*- List Not Exhaustive
Chapter 1. TABLE OF CONTENTS
Chapter 2. Introduction to Flax Crop Market
2.1. Market Overview
2.2. Key Statistics and Report Highlights
2.3. Scope of the Comprehensive Study
2.3.1. Market Definition
2.3.2 Countries and Regions Covered
2.3.3 Research Objective
2.3.4 Units, Currency, and Conversions
2.3.5 Industry Value Chain
2.4. Key Market Segments
2.5. Key Companies
2.6. Study Period
Chapter 3. Strategic Analysis Review
3.1. Flax Crop Pricing Analysis and Forecast
3.2. Porter’s Five Forces
3.3. Market Ecosystem
3.4. SWOT Analysis
3.5. Regulatory Scenario
3.3. Effects of Inflation, Russia-Ukraine War, moderating economic growth, and other macroeconomic factors
Chapter 4. Competitive Landscape
4.1. Market Share Analysis
4.1.1. Global Flax Crop Market Share by Company, 2023
4.1.2. Product Offerings of Leading Flax Crop Companies
4.2. Market Entropy
4.2.1. New Product Launches in the Industry
4.2.2. Mergers, Acquisitions, Joint ventures, and Partnerships
4.3. Key Strategies and Best Practices
Chapter 5. Global Market Projections: Best, Reference, and Low Case Scenarios
5.1. Growth Analysis- Case Scenario Definitions
5.2. Low Growth Case Scenario Forecasts
5.3. Reference Growth Case Scenario Forecasts
5.4. High Growth Case Scenario Forecasts
Chapter 6. Market Dynamics
6.1. Flax Crop Market Drivers
6.2. Flax Crop Market Challenges
6.6. Flax Crop Market Opportunities
6.4. Flax Crop Market Trends
Chapter 7. Global Flax Crop Market Outlook Trends
7.1. Global Flax Crop Revenue (USD Million) and CAGR (%) by Type (2021-2032)
7.2. Global Flax Crop Revenue (USD Million) and CAGR (%) by Application (2021-2032)
7.3. Global Flax Crop Revenue (USD Million) and CAGR (%) by Product (2021-2032)
By Type
Seeds
Stalk Parts
Straw
By Application
Textile
Paper
Paints and Coatings
Medical
Insulation
Animal Feed
Food and Beverage
Others
Chapter 8. Global Flax Crop Regional Analysis and Outlook
8.1. Global Flax Crop Revenue (USD Million) By Regions (2021- 2032)
8.2. North America Flax Crop Revenue (USD Million) by Country (2021-2032)
8.2.1. United States Flax Crop Regional Analysis and Outlook
8.2.2. Canada Flax Crop Regional Analysis and Outlook
8.2.3. Mexico Flax Crop Regional Analysis and Outlook
8.3. Europe Flax Crop Revenue (USD Million), by Country (2021-2032)
8.3.1. Germany Flax Crop Regional Analysis and Outlook
8.3.2. France Flax Crop Regional Analysis and Outlook
8.3.3. United Kingdom Flax Crop Regional Analysis and Outlook
8.3.4. Spain Flax Crop Regional Analysis and Outlook
8.3.5. Italy Flax Crop Regional Analysis and Outlook
8.3.6. Russia Flax Crop Regional Analysis and Outlook
8.3.7. Rest of Europe Flax Crop Regional Analysis and Outlook
8.4. Asia Pacific Flax Crop Revenue (USD Million) by Country (2021-2032)
8.4.1. China Flax Crop Regional Analysis and Outlook
8.4.2. Japan Flax Crop Regional Analysis and Outlook
8.4.3. India Flax Crop Regional Analysis and Outlook
8.4.4. South Korea Flax Crop Regional Analysis and Outlook
8.4.5. Australia Flax Crop Regional Analysis and Outlook
8.4.6. South East Asia Flax Crop Regional Analysis and Outlook
8.4.7. Rest of Asia Pacific Flax Crop Regional Analysis and Outlook
8.5. South America Flax Crop Revenue (USD Million), by Country (2021-2032)
8.5.1. Brazil Flax Crop Regional Analysis and Outlook
8.5.2. Argentina Flax Crop Regional Analysis and Outlook
8.5.3. Rest of South America Flax Crop Regional Analysis and Outlook
8.6. Middle East and Africa Flax Crop Revenue (USD Million) by Country (2021-2032)
8.6.1. Middle East Flax Crop Regional Analysis and Outlook
8.6.2. Africa Flax Crop Regional Analysis and Outlook
Chapter 9. North America Flax Crop Analysis and Outlook
9.1. North America Flax Crop Revenue (USD Million) by Segments (2021-2032)
9.1.1. North America Flax Crop Revenue (USD Million) by Type (2021-2032)
9.1.2. North America Flax Crop Revenue (USD Million) by Application (2021-2032)
9.1.3. North America Flax Crop Revenue (USD Million) by Product (2021-2032)
By Type
Seeds
Stalk Parts
Straw
By Application
Textile
Paper
Paints and Coatings
Medical
Insulation
Animal Feed
Food and Beverage
Others
Chapter 10. Europe Flax Crop Analysis and Outlook
10.1. Europe Flax Crop Revenue (USD Million), by Segments (USD Million) (2021-2032)
10.1.1. Europe Flax Crop Revenue (USD Million) by Type (2021-2032)
10.1.2. Europe Flax Crop Revenue (USD Million) by Application (2021-2032)
10.1.3. Europe Flax Crop Revenue (USD Million) by Product (2021-2032)
By Type
Seeds
Stalk Parts
Straw
By Application
Textile
Paper
Paints and Coatings
Medical
Insulation
Animal Feed
Food and Beverage
Others
Chapter 11. Asia Pacific Flax Crop Analysis and Outlook
11.1. Asia Pacific Flax Crop Revenue (USD Million), and Revenue (USD Million) by Segments (2021-2032)
11.1.1. Asia Pacific Flax Crop Revenue (USD Million) by Type (2021-2032)
11.1.2. Asia Pacific Flax Crop Revenue (USD Million) by Application (2021-2032)
11.1.3. Asia Pacific Flax Crop Revenue (USD Million) by Product (2021-2032)
By Type
Seeds
Stalk Parts
Straw
By Application
Textile
Paper
Paints and Coatings
Medical
Insulation
Animal Feed
Food and Beverage
Others
Chapter 12. South America Flax Crop Analysis and Outlook
12.1. South America Flax Crop Revenue (USD Million), by Segments (2021-2032)
12.1.1. South America Flax Crop Revenue (USD Million) by Type (2021-2032)
12.1.2. South America Flax Crop Revenue (USD Million) by Application (2021-2032)
12.1.3. South America Flax Crop Revenue (USD Million) by Product (2021-2032)
By Type
Seeds
Stalk Parts
Straw
By Application
Textile
Paper
Paints and Coatings
Medical
Insulation
Animal Feed
Food and Beverage
Others
Chapter 13. Middle East and Africa Flax Crop Analysis and Outlook
13.1. Middle East and Africa Flax Crop Revenue (USD Million), by Segments (2021-2032)
13.1.1. Middle East and Africa Flax Crop Revenue (USD Million) by Type (2021-2032)
13.1.2. Middle East and Africa Flax Crop Revenue (USD Million) by Application (2021-2032)
13.1.3. Middle East and Africa Flax Crop Revenue (USD Million) by Product (2021-2032)
By Type
Seeds
Stalk Parts
Straw
By Application
Textile
Paper
Paints and Coatings
Medical
Insulation
Animal Feed
Food and Beverage
Others
Chapter 14. Flax Crop Company Profiles
14.1 Business Overview
14.2 Product Profiles
14.3 SWOT Profiles
14.5 Recent Developments
14.6 Financial Profile
List of Companies
Archer Daniels Midland Company (ADM)
Biolin Research
Cargill Inc
CHS
Glanbia Plc
Grain Millers
Legumex Walker
Schweitzer-Mauduit International
SunOpta
SWM INTL
15. Methodology and Data Sources
15.1 Customization Offerings
15.2 Subscription Services
15.3 Related Reports
15.4 Publisher Expertise
LIST OF TABLES
Table 1 Market Segmentation Analysis
Table 2 Global Flax Crop Market Share of Leading Companies, 2023
Table 3 Product Offerings of Leading Companies
Table 4 Low Growth Scenario Forecasts
Table 5 Reference Case Growth Scenario
Table 6 High Growth Case Scenario
Table 7 Global Flax Crop Revenue (USD Million) And CAGR (%) By Type (2021-2032)
Table 8 Global Flax Crop Revenue (USD Million) And CAGR (%) By Application (2021-2032)
Table 9 Global Flax Crop Revenue (USD Million) And CAGR (%) By Product (2021-2032)
Table 10 Global Flax Crop Market Revenue (USD Million) By Regions (2021-2032)
Table 11 Global Flax Crop Market Share (%) By Regions (2021-2032)
Table 12 North America Flax Crop Revenue (USD Million) By Country (2021-2032)
Table 13 Europe Flax Crop Revenue (USD Million) By Country (2021-2032)
Table 14 Asia Pacific Flax Crop Revenue (USD Million) By Country (2021-2032)
Table 15 South America Flax Crop Revenue (USD Million) By Country (2021-2032)
Table 16 Middle East and Africa Flax Crop Revenue (USD Million) By Region (2021-2032)
Table 17 North America Flax Crop Revenue (USD Million) By Type (2021-2032)
Table 18 North America Flax Crop Revenue (USD Million) By Application (2021-2032)
Table 19 North America Flax Crop Revenue (USD Million) By Product (2021-2032)
Table 20 Europe Flax Crop Revenue (USD Million) By Type (2021-2032)
Table 21 Europe Flax Crop Revenue (USD Million) By Application (2021-2032)
Table 22 Europe Flax Crop Revenue (USD Million) By Product (2021-2032)
Table 23 Asia Pacific Flax Crop Revenue (USD Million) By Type (2021-2032)
Table 24 Asia Pacific Flax Crop Revenue (USD Million) By Application (2021-2032)
Table 25 Asia Pacific Flax Crop Revenue (USD Million) By Product (2021-2032)
Table 26 South America Flax Crop Revenue (USD Million) By Type (2021-2032)
Table 27 South America Flax Crop Revenue (USD Million) By Application (2021-2032)
Table 28 South America Flax Crop Revenue (USD Million) By Product (2021-2032)
Table 29 Middle East and Africa Flax Crop Revenue (USD Million) By Type (2021-2032)
Table 30 Middle East and Africa Flax Crop Revenue (USD Million) By Application (2021-2032)
Table 31 Middle East and Africa Flax Crop Revenue (USD Million) By Product (2021-2032)
LIST OF FIGURES
Figure 1. Market Scope
Figure 2. Pricing Forecasts Per Unit, 2023- 2032
Figure 3. Porter’s Five Forces
Figure 4. Global Flax Crop Market Revenue (USD Million) By Regions (2021-2032)
Figure 5. Global Flax Crop Market Share (%) By Regions (2023)
Figure 6. North America Flax Crop Revenue (USD Million) By Country (2021-2032)
Figure 7. United States Flax Crop Revenue (USD Million) By Country (2021-2032)
Figure 8. Canada Flax Crop Revenue (USD Million) By Country (2021-2032)
Figure 9. Mexico Flax Crop Revenue (USD Million) By Country (2021-2032)
Figure 10. Europe Flax Crop Revenue (USD Million) By Country (2021-2032)
Figure 11. Germany Flax Crop Revenue (USD Million) By Country (2021-2032)
Figure 12. France Flax Crop Revenue (USD Million) By Country (2021-2032)
Figure 13. United Kingdom Flax Crop Revenue (USD Million) By Country (2021-2032)
Figure 14. Spain Flax Crop Revenue (USD Million) By Country (2021-2032)
Figure 15. Italy Flax Crop Revenue (USD Million) By Country (2021-2032)
Figure 16. Russia Flax Crop Revenue (USD Million) By Country (2021-2032)
Figure 17. Rest of Europe Flax Crop Revenue (USD Million) By Country (2021-2032)
Figure 11. Asia Pacific Flax Crop Revenue (USD Million) By Country (2021-2032)
Figure 12. China Flax Crop Revenue (USD Million) By Country (2021-2032)
Figure 13. Japan Flax Crop Revenue (USD Million) By Country (2021-2032)
Figure 14. India Flax Crop Revenue (USD Million) By Country (2021-2032)
Figure 15. South Korea Flax Crop Revenue (USD Million) By Country (2021-2032)
Figure 16. Australia Flax Crop Revenue (USD Million) By Country (2021-2032)
Figure 17. South East Asia Flax Crop Revenue (USD Million) By Country (2021-2032)
Figure 18. South America Flax Crop Revenue (USD Million) By Country (2021-2032)
Figure 19. Brazil Flax Crop Revenue (USD Million) By Country (2021-2032)
Figure 20. Argentina Flax Crop Revenue (USD Million) By Country (2021-2032)
Figure 21. Rest of Asia Pacific Flax Crop Revenue (USD Million) By Country (2021-2032)
Figure 22. Middle East and Africa Flax Crop Revenue (USD Million) By Region (2021-2032)
Figure 23. Saudi Arabia Flax Crop Revenue (USD Million) By Region (2021-2032)
Figure 24. The UAE Flax Crop Revenue (USD Million) By Region (2021-2032)
Figure 25. Rest of Middle East Flax Crop Revenue (USD Million) By Region (2021-2032)
Figure 26. South Africa Flax Crop Revenue (USD Million) By Region (2021-2032)
Figure 27. Africa Flax Crop Revenue (USD Million) By Region (2021-2032)
Figure 28. North America Flax Crop Revenue (USD Million) By Type (2021-2032)
Figure 29. North America Flax Crop Revenue (USD Million) By Application (2021-2032)
Figure 30. North America Flax Crop Revenue (USD Million) By Product (2021-2032)
Figure 31. Europe Flax Crop Revenue (USD Million) By Type (2021-2032)
Figure 32. Europe Flax Crop Revenue (USD Million) By Application (2021-2032)
Figure 33. Europe Flax Crop Revenue (USD Million) By Product (2021-2032)
Figure 34. Asia Pacific Flax Crop Revenue (USD Million) By Type (2021-2032)
Figure 35. Asia Pacific Flax Crop Revenue (USD Million) By Application (2021-2032)
Figure 36. Asia Pacific Flax Crop Revenue (USD Million) By Product (2021-2032)
Figure 37. South America Flax Crop Revenue (USD Million) By Type (2021-2032)
Figure 38. South America Flax Crop Revenue (USD Million) By Application (2021-2032)
Figure 39. South America Flax Crop Revenue (USD Million) By Product (2021-2032)
Figure 40. Middle East and Africa Flax Crop Revenue (USD Million) By Type (2021-2032)
Figure 41. Middle East and Africa Flax Crop Revenue (USD Million) By Application (2021-2032)
Figure 42. Middle East and Africa Flax Crop Revenue (USD Million) By Product (2021-2032)
By Type
Seeds
Stalk Parts
Straw
By Application
Textile
Paper
Paints and Coatings
Medical
Insulation
Animal Feed
Food and Beverage
Others
Countries Analyzed
North America (US, Canada, Mexico)
Europe (Germany, UK, France, Spain, Italy, Russia, Rest of Europe)
Asia Pacific (China, India, Japan, South Korea, Australia, South East Asia, Rest of Asia)
South America (Brazil, Argentina, Rest of South America)
Middle East and Africa (Saudi Arabia, UAE, Rest of Middle East, South Africa, Egypt, Rest of Africa)
