
The global Flexible Packaging Market study analyzes and forecasts the market size across 6 regions and 24 countries for diverse segments including- By Packaging (Pouches, Rollstock, Bags, Films & Wraps, Others), By Material (Plastic, Paper, Metal), By Printing Technology (Rotogravure, Flexography, Digital Printing, Others), By End User (Food, Beverages, Pharmaceutical & Healthcare, Personal Care & Cosmetics, Others)
The flexible packaging market has experienced remarkable growth and transformation in recent years. Flexible packaging refers to a versatile form of packaging made from various materials such as plastic, paper, aluminum foil, and bioplastics. Its popularity can be attributed to its lightweight, cost-effectiveness, and ability to protect products from external elements like moisture, air, and light. One of the key drivers behind the growth of the flexible packaging market is the increasing demand from various industries, including food and beverage, pharmaceuticals, personal care, and household products. Consumers' changing lifestyle preferences have led to a surge in the demand for convenient, on-the-go packaging solutions, which flexible packaging fulfills exceptionally well.
Moreover, the emphasis on sustainability and eco-friendly packaging has significantly influenced the market. Manufacturers are increasingly adopting recyclable and biodegradable materials to reduce their environmental impact, aligning with consumers' growing environmental consciousness. The flexibility of these packaging materials enables creative and innovative designs, making products stand out on retail shelves and enhancing brand visibility. Customizable printing options also allow companies to incorporate attractive graphics and branding elements. The convenience of transportation and storage due to the reduced weight and volume of flexible packaging has garnered attention from both manufacturers and retailers. This has resulted in cost savings across the supply chain.
The market report analyses the leading companies in the industry including Amcor plc, Mondi Group, Sealed Air Corporation, Constantia Flexibles Group GmbH, Coveris Holdings S.A., Goglio S.p.A., ProAmpac Holdings, Inc., Gualapack S.p.A., Huhtamaki Oyj, Smurfit Kappa Group plc, and Others.
The flexible packaging market dynamics are influenced by various factors that shape its growth and evolution. Firstly, consumer preferences and lifestyle changes have been pivotal in driving the demand for flexible packaging. With an increasing focus on convenience, on-the-go products, and ready-to-eat meals, flexible packaging offers lightweight and easy-to-use solutions, making it a preferred choice among consumers. Sustainability and environmental concerns have significantly impacted the market dynamics. As consumers and governments worldwide advocate for greener packaging options, manufacturers have been compelled to adopt eco-friendly materials and sustainable practices. This has led to a surge in the use of recyclable, biodegradable, and compostable materials in flexible packaging. Another important driver is technological advancements. Innovations in materials, printing techniques, and manufacturing processes have expanded the possibilities for flexible packaging. Advanced barrier coatings and films enhance product preservation, extending shelf life and reducing food waste. The growth of e-commerce and the global supply chain has boosted the demand for flexible packaging. Its ability to protect products during transit and reduce transportation costs has made it an attractive option for manufacturers and retailers alike.
The Flexible Packaging Market is witnessing a strong shift toward sustainable materials as consumers and businesses prioritize environmental responsibility. Biodegradable and recyclable packaging solutions made from materials like polylactic acid (PLA), paper composites, and bio-based plastics are increasingly in demand. Innovations such as mono-material films and water-based inks also align with the industry’s sustainability goals, allowing for easier recycling without compromising functionality. This trend is driven by stringent government regulations and growing consumer awareness about the environmental impact of traditional plastics, making eco-friendly packaging a central focus for manufacturers.
A key driver for the Flexible Packaging Market is the rapid expansion of the e-commerce and convenience food industries. Flexible packaging offers lightweight, durable, and customizable solutions that meet the needs of both sectors. In e-commerce, it ensures product protection during shipping while minimizing costs associated with weight and material usage. In the food sector, flexible packaging enhances shelf life, improves portability, and provides convenience features such as resealable zippers and easy-open designs. These factors make it indispensable for brands seeking to cater to modern consumer lifestyles and logistics demands.
The integration of smart technologies into flexible packaging presents a promising growth opportunity. Smart packaging, equipped with features like QR codes, NFC tags, or temperature indicators, enhances consumer engagement and ensures product quality and safety. For instance, food and pharmaceutical brands can use smart packaging to provide real-time information on freshness, authenticity, or dosage instructions. Additionally, IoT-enabled solutions in flexible packaging can improve supply chain transparency and efficiency. Companies investing in these technologies can differentiate their products, attract tech-savvy consumers, and meet evolving industry standards.
As per the report, the global Flexible Packaging Market is segmented into Type, Application, and Regions. The report covers detailed information on market size, Share, Growth, Value, Volume Analysis, Demand analysis, new market entry, competition insights, market drivers, challenges, opportunities, and Restraints. Further, company profile analysis, company revenue, Strategies, Sales, company acquisition, partnership, mergers, latest trends in the industry, regional and country-level insights, and competitive intelligence data is provided in the research report.
Plastic is the largest segment in the flexible packaging market by material. Its dominance is driven by its versatility, lightweight nature, and cost-effectiveness. Plastic materials such as polyethylene (PE), polypropylene (PP), and polyethylene terephthalate (PET) offer excellent barrier properties, protecting products from moisture, light, and contamination. These qualities make plastic an ideal choice for a wide range of industries, including food, beverages, pharmaceuticals, and personal care. Furthermore, its durability and ease of customization support the demand for attractive and functional packaging. While sustainability concerns are rising, innovations in recyclable and biodegradable plastics continue to strengthen this segment's position.
Pouches are the fastest-growing segment in the flexible packaging market by packaging type. Their popularity stems from their convenience, lightweight design, and ability to maintain product freshness. Pouches are increasingly used in food and beverage packaging, particularly for snacks, ready-to-eat meals, and liquid products, due to their resealable options and space efficiency. Additionally, pouches require less material than rigid packaging, aligning with sustainability goals and cost savings. The rising adoption of stand-up and spout pouches in various industries further drives growth, supported by advancements in materials and printing technologies that enhance functionality and branding.
Rotogravure printing is the largest segment in the flexible packaging market by printing technology. This technique is widely preferred for its ability to produce high-quality, consistent, and vibrant images, making it ideal for large-scale packaging production. Rotogravure is particularly popular in industries like food and personal care, where attractive packaging is crucial for branding and consumer appeal. Its efficiency in printing on a variety of materials, including plastic, paper, and metalized films, further contributes to its dominance. While initial setup costs are high, the long-term benefits of durability and speed in high-volume production solidify its market position.
The pharmaceutical and healthcare segment is the fastest-growing end-user in the flexible packaging market. The rising demand for secure, tamper-evident, and hygienic packaging solutions drives growth in this sector. Flexible packaging formats such as blister packs, sachets, and medical-grade films are increasingly used to ensure product safety and extend shelf life. The growth of e-commerce in pharmaceutical sales, combined with an aging population and the expansion of global healthcare systems, contributes to the rapid adoption of flexible packaging in this sector. Additionally, advancements in barrier technologies and compliance with stringent regulatory standards further bolster this segment's growth.
Further, the global market is geographically divided into major regions, and countries including North America, Europe, Asia Pacific, Middle East and Africa, and Latin America. Further, major countries focused in the global study report: United States, Canada, United Kingdom, Spain, Germany, Italy, France, Mexico, Russia, Ukraine, China, Japan, South Korea, India, Singapore, Malaysia, Australia, Qatar, Kingdom of Saudi Arabia, South Africa, Brazil, Argentina, and other countries are covered in the research study.
|
Parameter |
Details |
|
Market Size (2024) |
$288.3 Billion |
|
Market Size (2034) |
$465.2 Billion |
|
Market Growth Rate |
4.9% |
|
Segments |
By Packaging (Pouches, Rollstock, Bags, Films & Wraps, Others), By Material (Plastic, Paper, Metal), By Printing Technology (Rotogravure, Flexography, Digital Printing, Others), By End User (Food, Beverages, Pharmaceutical & Healthcare, Personal Care & Cosmetics, Others) |
|
Study Period |
2019- 2024 and 2025-2034 |
|
Units |
Revenue (USD) |
|
Qualitative Analysis |
Porter’s Five Forces, SWOT Profile, Market Share, Scenario Forecasts, Market Ecosystem, Company Ranking, Market Dynamics, Industry Benchmarking |
|
Companies |
Amcor plc, Mondi Group, Sealed Air Corp, Constantia Flexibles Group GmbH, Coveris Holdings S.A., Goglio S.p.A., ProAmpac Holdings, Inc., Gualapack S.p.A., Huhtamaki Oyj, Smurfit Kappa Group plc, and Others. |
|
Countries |
US, Canada, Mexico, Germany, France, Spain, Italy, UK, Russia, China, India, Japan, South Korea, Australia, South East Asia, Brazil, Argentina, Middle East, Africa |
By Packaging
By Material
By Printing Technology
By End-User
Geographical Analysis
• North American market to remain the most potential segment in the global market during 2025-2034. In the North American region, the United States occupied the highest share of the market in this region, and the US country is projected to follow the same trend over the forecast time 2025-2034, followed by Canada.
• Western European countries hold the dominant share in the regional Flexible Packaging Market during the forecast period 2025-2034. Asia Pacific region is expected to be registered as the fastest-growing market in the global market by 2034.
• Most developing countries in the Asia Pacific remain the focus of leading Flexible Packaging companies, with a large portion of these companies investing in new entry and business expansion strategies
• The market in the Middle East and Africa Flexible Packaging is projected to show prominent growth opportunities in the coming years from 2025-2034. The rising focus from the government of the Middle East and African countries on promoting manufacturing and distribution is mostly contributing to the global market in the MEA region.
• The Latin American Flexible Packaging Market registered a substantial share of the global market in 2024, and it is projected to remain its presence in the market.
*List not exhaustive
Flexible Packaging Market Outlook 2023
1 Market Overview
1.1 Introduction to Flexible Packaging Market
1.2 Scope of the Study
1.3 Research Objective
1.3.1 Key Market Scope and Segments
1.3.2 Players Covered
1.3.3 Years Considered
2 Executive Summary
2.1 2023 Flexible Packaging Industry- Market Statistics
3 Market Dynamics
3.1 Market Drivers
3.2 Market Challenges
3.3 Market Opportunities
3.4 Market Trends
4 Market Factor Analysis
4.1 Porter’s Five Forces
4.2 Market Entropy
4.2.1 Global Flexible Packaging Market Companies with Area Served
4.2.2 Products Offerings Global Flexible Packaging Market
5 COVID-19 Impact Analysis and Outlook Scenarios
5.1.1 Covid-19 Impact Analysis
5.1.2 Post-COVID-19 Scenario- Low Growth Case
5.1.3 Post-COVID-19 Scenario- Reference Growth Case
5.1.4 Post-COVID-19 Scenario- Low Growth Case
6 Global Flexible Packaging Market Trends
6.1 Global Flexible Packaging Revenue (USD Million) and CAGR (%) by Type (2018-2028)
6.2 Global Flexible Packaging Revenue (USD Million) and CAGR (%) by Applications (2018-2028)
6.3 Global Flexible Packaging Revenue (USD Million) and CAGR (%) by Regions (2018-2028)
7 Global Flexible Packaging Market Revenue (USD Million) by Type, and Applications (2018-2022)
7.1 Global Flexible Packaging Revenue (USD Million) by Type (2018-2022)
7.1.1 Global Flexible Packaging Revenue (USD Million), Market Share (%) by Type (2018-2022)
7.2 Global Flexible Packaging Revenue (USD Million) by Applications (2018-2022)
7.2.1 Global Flexible Packaging Revenue (USD Million), Market Share (%) by Applications (2018-2022)
8 Global Flexible Packaging Development Regional Status and Outlook
8.1 Global Flexible Packaging Revenue (USD Million) By Regions (2018-2022)
8.2 North America Flexible Packaging Revenue (USD Million) by Type, and Application (2018-2022)
8.2.1 North America Flexible Packaging Revenue (USD Million) by Country (2018-2022)
8.2.2 North America Flexible Packaging Revenue (USD Million) by Type (2018-2022)
8.2.3 North America Flexible Packaging Revenue (USD Million) by Applications (2018-2022)
8.3 Europe Flexible Packaging Revenue (USD Million), by Type, and Applications (USD Million) (2018-2022)
8.3.1 Europe Flexible Packaging Revenue (USD Million), by Country (2018-2022)
8.3.2 Europe Flexible Packaging Revenue (USD Million) by Type (2018-2022)
8.3.3 Europe Flexible Packaging Revenue (USD Million) by Applications (2018-2022)
8.4 Asia Pacific Flexible Packaging Revenue (USD Million), and Revenue (USD Million) by Type, and Applications (2018-2022)
8.4.1 Asia Pacific Flexible Packaging Revenue (USD Million) by Country (2018-2022)
8.4.2 Asia Pacific Flexible Packaging Revenue (USD Million) by Type (2018-2022)
8.4.3 Asia Pacific Flexible Packaging Revenue (USD Million) by Applications (2018-2022)
8.5 South America Flexible Packaging Revenue (USD Million), by Type, and Applications (2018-2022)
8.5.1 South America Flexible Packaging Revenue (USD Million), by Country (2018-2022)
8.5.2 South America Flexible Packaging Revenue (USD Million) by Type (2018-2022)
8.5.3 South America Flexible Packaging Revenue (USD Million) by Applications (2018-2022)
8.6 Middle East and Africa Flexible Packaging Revenue (USD Million), by Type, Technology, Application, Thickness (2018-2022)
8.6.1 Middle East and Africa Flexible Packaging Revenue (USD Million) by Country (2018-2022)
8.6.2 Middle East and Africa Flexible Packaging Revenue (USD Million) by Type (2018-2022)
8.6.3 Middle East and Africa Flexible Packaging Revenue (USD Million) by Applications (2018-2022)
9 Company Profiles
10 Global Flexible Packaging Market Revenue (USD Million), by Type, and Applications (2023-2028)
10.1 Global Flexible Packaging Revenue (USD Million) and Market Share (%) by Type (2023-2028)
10.1.1 Global Flexible Packaging Revenue (USD Million), and Market Share (%) by Type (2023-2028)
10.2 Global Flexible Packaging Revenue (USD Million) and Market Share (%) by Applications (2023-2028)
10.2.1 Global Flexible Packaging Revenue (USD Million), and Market Share (%) by Applications (2023-2028)
11 Global Flexible Packaging Development Regional Status and Outlook Forecast
11.1 Global Flexible Packaging Revenue (USD Million) By Regions (2023-2028)
11.2 North America Flexible Packaging Revenue (USD Million) by Type, and Applications (2023-2028)
11.2.1 North America Flexible Packaging Revenue (USD) Million by Country (2023-2028)
11.2.2 North America Flexible Packaging Revenue (USD Million), by Type (2023-2028)
11.2.3 North America Flexible Packaging Revenue (USD Million), Market Share (%) by Applications (2023-2028)
11.3 Europe Flexible Packaging Revenue (USD Million), by Type, and Applications (2023-2028)
11.3.1 Europe Flexible Packaging Revenue (USD Million), by Country (2023-2028)
11.3.2 Europe Flexible Packaging Revenue (USD Million), by Type (2023-2028)
11.3.3 Europe Flexible Packaging Revenue (USD Million), by Applications (2023-2028)
11.4 Asia Pacific Flexible Packaging Revenue (USD Million) by Type, and Applications (2023-2028)
11.4.1 Asia Pacific Flexible Packaging Revenue (USD Million), by Country (2023-2028)
11.4.2 Asia Pacific Flexible Packaging Revenue (USD Million), by Type (2023-2028)
11.4.3 Asia Pacific Flexible Packaging Revenue (USD Million), by Applications (2023-2028)
11.5 South America Flexible Packaging Revenue (USD Million), by Type, and Applications (2023-2028)
11.5.1 South America Flexible Packaging Revenue (USD Million), by Country (2023-2028)
11.5.2 South America Flexible Packaging Revenue (USD Million), by Type (2023-2028)
11.5.3 South America Flexible Packaging Revenue (USD Million), by Applications (2023-2028)
11.6 Middle East and Africa Flexible Packaging Revenue (USD Million), by Type, and Applications (2023-2028)
11.6.1 Middle East and Africa Flexible Packaging Revenue (USD Million), by Region (2023-2028)
11.6.2 Middle East and Africa Flexible Packaging Revenue (USD Million), by Type (2023-2028)
11.6.3 Middle East and Africa Flexible Packaging Revenue (USD Million), by Applications (2023-2028)
12 Methodology and Data Sources
12.1 Methodology/Research Approach
12.1.1 Research Programs/Design
12.1.2 Market Size Estimation
12.1.3 Market Breakdown and Data Triangulation
12.2 Data Sources
12.2.1 Secondary Sources
12.2.2 Primary Sources
12.3 Disclaimer
List Of Tables
Table 1 Market Segmentation Analysis
Table 2 Global Flexible Packaging Market Companies with Areas Served
Table 3 Products Offerings Global Flexible Packaging Market
Table 4 Low Growth Scenario Forecasts
Table 5 Reference Case Growth Scenario
Table 6 High Growth Case Scenario
Table 7 Global Flexible Packaging Revenue (USD Million) And CAGR (%) By Type (2018-2028)
Table 8 Global Flexible Packaging Revenue (USD Million) And CAGR (%) By Applications (2018-2028)
Table 9 Global Flexible Packaging Revenue (USD Million) And CAGR (%) By Regions (2018-2028)
Table 10 Global Flexible Packaging Revenue (USD Million) By Type (2018-2022)
Table 11 Global Flexible Packaging Revenue Market Share (%) By Type (2018-2022)
Table 12 Global Flexible Packaging Revenue (USD Million) By Applications (2018-2022)
Table 13 Global Flexible Packaging Revenue Market Share (%) By Applications (2018-2022)
Table 14 Global Flexible Packaging Market Revenue (USD Million) By Regions (2018-2022)
Table 15 Global Flexible Packaging Market Share (%) By Regions (2018-2022)
Table 16 North America Flexible Packaging Revenue (USD Million) By Country (2018-2022)
Table 17 North America Flexible Packaging Revenue (USD Million) By Type (2018-2022)
Table 18 North America Flexible Packaging Revenue (USD Million) By Applications (2018-2022)
Table 19 Europe Flexible Packaging Revenue (USD Million) By Country (2018-2022)
Table 20 Europe Flexible Packaging Revenue (USD Million) By Type (2018-2022)
Table 21 Europe Flexible Packaging Revenue (USD Million) By Applications (2018-2022)
Table 22 Asia Pacific Flexible Packaging Revenue (USD Million) By Country (2018-2022)
Table 23 Asia Pacific Flexible Packaging Revenue (USD Million) By Type (2018-2022)
Table 24 Asia Pacific Flexible Packaging Revenue (USD Million) By Applications (2018-2022)
Table 25 South America Flexible Packaging Revenue (USD Million) By Country (2018-2022)
Table 26 South America Flexible Packaging Revenue (USD Million) By Type (2018-2022)
Table 27 South America Flexible Packaging Revenue (USD Million) By Applications (2018-2022)
Table 28 Middle East and Africa Flexible Packaging Revenue (USD Million) By Region (2018-2022)
Table 29 Middle East and Africa Flexible Packaging Revenue (USD Million) By Type (2018-2022)
Table 30 Middle East and Africa Flexible Packaging Revenue (USD Million) By Applications (2018-2022)
Table 31 Financial Analysis
Table 32 Global Flexible Packaging Revenue (USD Million) By Type (2023-2028)
Table 33 Global Flexible Packaging Revenue Market Share (%) By Type (2023-2028)
Table 34 Global Flexible Packaging Revenue (USD Million) By Applications (2023-2028)
Table 35 Global Flexible Packaging Revenue Market Share (%) By Applications (2023-2028)
Table 36 Global Flexible Packaging Market Revenue (USD Million), And Revenue (USD Million) By Regions (2023-2028)
Table 37 North America Flexible Packaging Revenue (USD)By Country (2023-2028)
Table 38 North America Flexible Packaging Revenue (USD Million) By Type (2023-2028)
Table 39 North America Flexible Packaging Revenue (USD Million) By Applications (2023-2028)
Table 40 Europe Flexible Packaging Revenue (USD Million) By Country (2023-2028)
Table 41 Europe Flexible Packaging Revenue (USD Million) By Type (2023-2028)
Table 42 Europe Flexible Packaging Revenue (USD Million) By Applications (2023-2028)
Table 43 Asia Pacific Flexible Packaging Revenue (USD Million) By Country (2023-2028)
Table 44 Asia Pacific Flexible Packaging Revenue (USD Million) By Type (2023-2028)
Table 45 Asia Pacific Flexible Packaging Revenue (USD Million) By Applications (2023-2028)
Table 46 South America Flexible Packaging Revenue (USD Million) By Country (2023-2028)
Table 47 South America Flexible Packaging Revenue (USD Million) By Type (2023-2028)
Table 48 South America Flexible Packaging Revenue (USD Million) By Applications (2023-2028)
Table 49 Middle East and Africa Flexible Packaging Revenue (USD Million) By Region (2023-2028)
Table 50 Middle East and Africa Flexible Packaging Revenue (USD Million) By Region (2023-2028)
Table 51 Middle East and Africa Flexible Packaging Revenue (USD Million) By Type (2023-2028)
Table 52 Middle East and Africa Flexible Packaging Revenue (USD Million) By Applications (2023-2028)
Table 53 Research Programs/Design for This Report
Table 54 Key Data Information from Secondary Sources
Table 55 Key Data Information from Primary Sources
List Of Figures
Figure 1 Market Scope
Figure 2 Porter’s Five Forces
Figure 3 Global Flexible Packaging Revenue (USD Million) By Type (2018-2022)
Figure 4 Global Flexible Packaging Revenue Market Share (%) By Type (2022)
Figure 5 Global Flexible Packaging Revenue (USD Million) By Applications (2018-2022)
Figure 6 Global Flexible Packaging Revenue Market Share (%) By Applications (2022)
Figure 7 Global Flexible Packaging Market Revenue (USD Million) By Regions (2018-2022)
Figure 8 Global Flexible Packaging Market Share (%) By Regions (2022)
Figure 9 North America Flexible Packaging Revenue (USD Million) By Country (2018-2022)
Figure 10 North America Flexible Packaging Revenue (USD Million) By Type (2018-2022)
Figure 11 North America Flexible Packaging Revenue (USD Million) By Applications (2018-2022)
Figure 12 Europe Flexible Packaging Revenue (USD Million) By Country (2018-2022)
Figure 13 Europe Flexible Packaging Revenue (USD Million) By Type (2018-2022)
Figure 14 Europe Flexible Packaging Revenue (USD Million) By Applications (2018-2022)
Figure 15 Asia Pacific Flexible Packaging Revenue (USD Million) By Country (2018-2022)
Figure 16 Asia Pacific Flexible Packaging Revenue (USD Million) By Type (2018-2022)
Figure 17 Asia Pacific Flexible Packaging Revenue (USD Million) By Applications (2018-2022)
Figure 18 South America Flexible Packaging Revenue (USD Million) By Country (2018-2022)
Figure 19 South America Flexible Packaging Revenue (USD Million) By Type (2018-2022)
Figure 20 South America Flexible Packaging Revenue (USD Million) By Applications (2018-2022)
Figure 21 Middle East and Africa Flexible Packaging Revenue (USD Million) By Region (2018-2022)
Figure 22 Middle East and Africa Flexible Packaging Revenue (USD Million) By Type (2018-2022)
Figure 23 Middle East and Africa Flexible Packaging Revenue (USD Million) By Applications (2018-2022)
Figure 24 Global Flexible Packaging Revenue (USD Million) By Type (2023-2028)
Figure 25 Global Flexible Packaging Revenue Market Share (%) By Type (2028)
Figure 26 Global Flexible Packaging Revenue (USD Million) By Applications (2023-2028)
Figure 27 Global Flexible Packaging Revenue Market Share (%) By Applications (2028)
Figure 28 Global Flexible Packaging Market Revenue (USD Million) By Regions (2023-2028)
Figure 29 North America Flexible Packaging Revenue (USD Million) By Country (2023-2028)
Figure 30 North America Flexible Packaging Revenue (USD Million) By Type (2023-2028)
Figure 31 North America Flexible Packaging Revenue (USD Million) By Applications (2023-2028)
Figure 32 Europe Flexible Packaging Revenue (USD Million) By Country (2023-2028)
Figure 33 Europe Flexible Packaging Revenue (USD Million) By Type (2023-2028)
Figure 34 Europe Flexible Packaging Revenue (USD Million) By Applications (2023-2028)
Figure 35 Asia Pacific Flexible Packaging Revenue (USD Million) By Country (2023-2028)
Figure 36 Asia Pacific Flexible Packaging Revenue (USD Million) By Type (2023-2028)
Figure 37 Asia Pacific Flexible Packaging Revenue (USD Million) By Applications (2023-2028)
Figure 38 South America Flexible Packaging Revenue (USD Million) By Country (2023-2028)
Figure 39 South America Flexible Packaging Revenue (USD Million) By Type (2023-2028)
Figure 40 South America Flexible Packaging Revenue (USD Million) By Applications (2023-2028)
Figure 41 Middle East and Africa Flexible Packaging Revenue (USD Million) By Region (2023-2028)
Figure 42 Middle East and Africa Flexible Packaging Revenue (USD Million) By Region (2023-2028)
Figure 43 Middle East and Africa Flexible Packaging Revenue (USD Million) By Type (2023-2028)
Figure 44 Middle East and Africa Flexible Packaging Revenue (USD Million) By Applications (2023-2028)
Figure 45 Bottom-Up and Top-Down Approaches For This Report
Figure 46 Data Triangulation
- North America
- Latin America
- Europe
- Middle East and Africa
- Asia Pacific
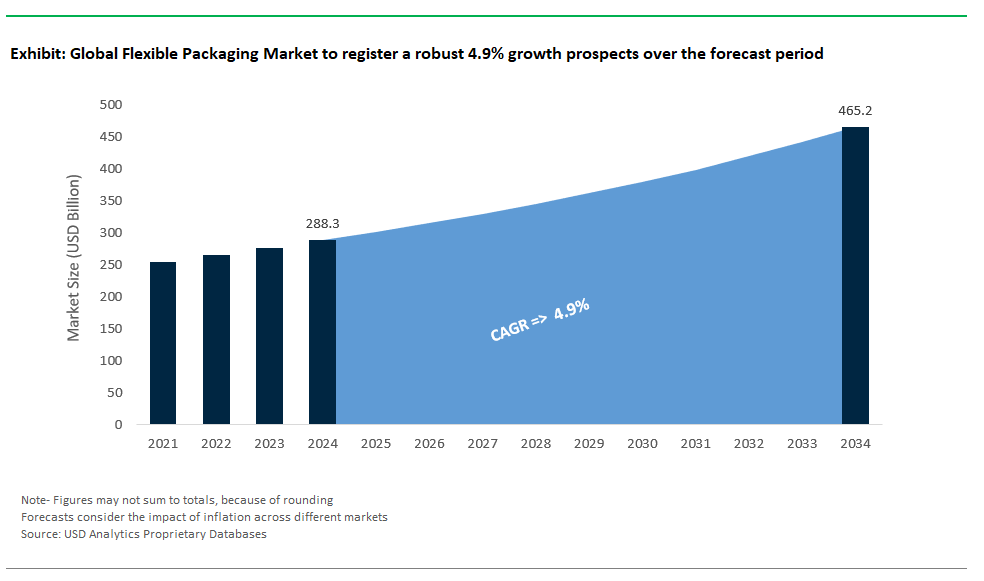
Flexible Packaging Market Size is valued at $288.3 Billion in 2024 and is forecast to register a growth rate (CAGR) of 4.9% to reach $465.2 Billion by 2034.
Emerging Markets across Asia Pacific, Europe, and Americas present robust growth prospects.
Amcor plc, Mondi Group, Sealed Air Corporation, Constantia Flexibles Group GmbH, Coveris Holdings S.A., Goglio S.p.A., ProAmpac Holdings, Inc., Gualapack S.p.A., Huhtamaki Oyj, Smurfit Kappa Group plc
Base Year- 2024; Estimated Year- 2025; Historic Period- 2019-2024; Forecast period- 2025 to 2034; Currency: Revenue (USD); Volume