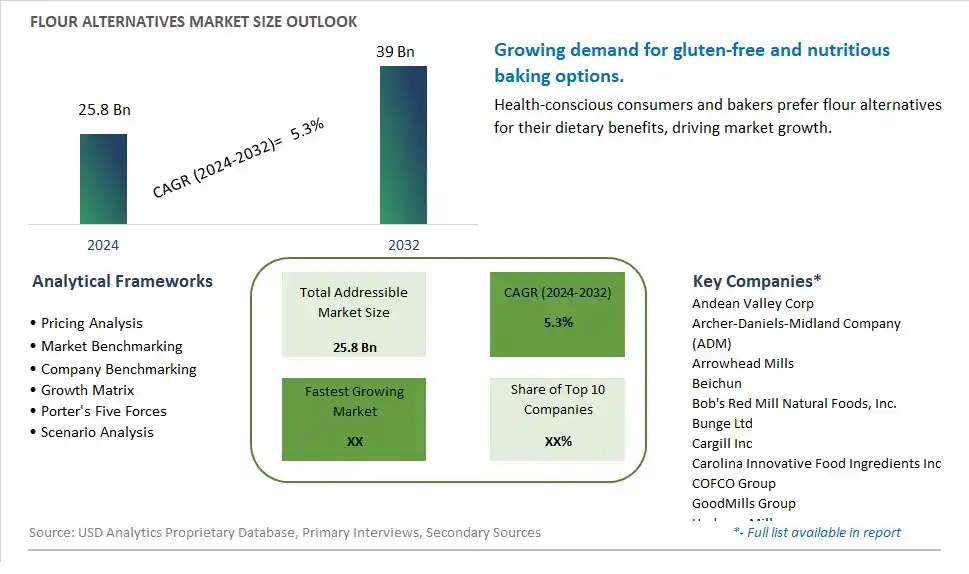
Global Flour Alternatives Market Size is valued at $25.8 Billion in 2024 and is forecast to register a growth rate (CAGR) of 5.3% to reach $39 Billion by 2032.
The global Flour Alternatives Market Comprehensive Study analyzes and forecasts the market size across 6 regions and 24 countries for diverse segments -By Product (Corn Flour, Rice Flour, Sweet Potato Flour, Spelt flour, Buckwheat flour, Quinoa Flour, Oat flour, Coconut flour, Chickpea flour, Brown rice flour, Rye flour, Amaranth flour, Teff flour, Millet flour, Almond Flour), By Type (Gluten-containing flours, Gluten-free flours), By Application (Baked Goods, Noodles, Pastry, Fried Food, Pasta, Bread, Crackers)
An Introduction to Flour Alternatives Market
In 2024, the Flour Alternatives market is witnessing robust growth, driven by the increasing demand for gluten-free and nutrient-dense flour options. Flour alternatives, such as almond flour, coconut flour, and chickpea flour, are popular among consumers with dietary restrictions and those seeking healthier baking ingredients. The market benefits from advancements in milling and processing technologies, the growing trend of plant-based and low-carb diets, and the expansion of the specialty food sector. Additionally, the rising awareness of the health benefits and culinary versatility of flour alternatives is contributing to market growth.
Flour Alternatives Competitive Landscape
The market report analyses the leading companies in the industry including Andean Valley Corp, Archer-Daniels-Midland Company (ADM), Arrowhead Mills, Beichun, Bob's Red Mill Natural Foods, Inc., Bunge Ltd, Cargill Inc, Carolina Innovative Food Ingredients Inc, COFCO Group, GoodMills Group, Hodgson Mill, Jinshahe Group, King Arthur Flour, Liuxu Food, Live Glean, Louis Dreyfus, Milne MicroDried, NorQuin, Pillsbury, Wilmar International Ltd, and Others.
Flour Alternatives Market Dynamics
Flour Alternatives Market Trend: Rise in Gluten-Free and Plant-Based Diets
A prominent trend in the flour alternatives market is the increasing adoption of gluten-free and plant-based diets. As more consumers prioritize health and wellness, there's a growing demand for alternatives to traditional wheat flour that cater to dietary restrictions such as gluten intolerance or preferences for plant-based ingredients. This trend is driven by concerns over digestive health, allergies, and the desire for sustainable food options. Flour alternatives like almond flour, coconut flour, chickpea flour, and rice flour are gaining popularity as versatile substitutes that offer nutritional benefits and align with diverse dietary choices, driving innovation and product development in the market.
Flour Alternatives Market Driver: Health Consciousness and Wellness Trends
The primary driver influencing the flour alternatives market is the global shift towards health consciousness and wellness trends. Consumers are becoming more mindful of their food choices, seeking products that support their health goals without compromising on taste or quality. Flour alternatives, known for their nutritional advantages such as higher protein content, lower carbohydrates, and gluten-free properties, are gaining traction among health-conscious individuals and those with specific dietary needs. The growing awareness of the link between diet and well-being fuels the demand for flour alternatives, encouraging manufacturers to introduce innovative products that cater to evolving consumer preferences in the health and wellness sector.
Flour Alternatives Market Opportunity: Expansion into Functional and Specialty Flours
A significant opportunity in the flour alternatives market lies in the expansion into functional and specialty flours. Beyond traditional alternatives like almond or coconut flour, there's a rising demand for flours that offer specific functional benefits, such as those enriched with vitamins, minerals, or added proteins. Specialty flours derived from ancient grains like quinoa, amaranth, or teff are also gaining attention for their unique nutritional profiles and culinary versatility. Manufacturers can capitalize on this opportunity by developing a diverse range of functional and specialty flours tailored to different dietary needs and applications, including baking, cooking, and food processing. By tapping into the growing segment of consumers seeking enhanced nutritional value and unique flavor experiences, companies can differentiate their offerings and capture a larger market share in the flourishing flour alternatives industry.
Flour Alternatives Market Share Analysis: Baked Goods segment generated the highest revenue share in the industry
In the Flour Alternatives Market, the largest segment by application is Baked Goods. This category encompasses a wide range of products such as bread, cakes, cookies, muffins, and pastries that utilize various flour alternatives to meet dietary preferences and health considerations. Flour alternatives like almond flour, coconut flour, and gluten-free blends have gained popularity among consumers seeking alternatives to traditional wheat flour due to gluten intolerance, allergies, or dietary choices. The demand for baked goods made from flour alternatives has surged as more consumers embrace healthier eating habits and look for options that offer nutritional benefits without compromising on taste and texture. Further, advancements in food technology have led to improved formulations and better sensory qualities of baked goods using these alternatives, further driving their adoption in the market.
Flour Alternatives Market Share Analysis: Gluten-free Flours is the fastest growing segment over the forecast period to 2032
In the Flour Alternatives Market, the fastest-growing segment to 2032 is Gluten-free Flours. This category has witnessed exponential growth driven by increasing awareness of gluten intolerance and celiac disease among consumers worldwide. Gluten-free flours, such as almond flour, coconut flour, rice flour, and chickpea flour, cater to a growing consumer base seeking alternatives to traditional wheat-based products. The rise in health-consciousness and dietary trends favoring gluten-free diets has significantly expanded the market for these flours across various applications, including baking, pasta, bread, and other culinary uses. Further, advancements in food processing technologies have improved the texture and functionality of gluten-free flours, making them more versatile and appealing to a broader audience. As the demand for gluten-free options continues to grow, manufacturers are innovating to meet these preferences, driving further growth in the flour alternatives market.
Flour Alternatives Market Share Analysis: Bread segment generated the highest revenue share in the industry
The largest segment in the Flour Alternatives Market, based on application, is Bread. Bread remains a staple food in many cultures globally, and the demand for alternative flours for breadmaking has grown significantly. Consumers are increasingly seeking healthier options and alternatives to traditional wheat bread, driving the use of flours such as almond, coconut, and rice flour in bread production. This trend is supported by dietary preferences, including gluten-free and grain-free diets, which have boosted the adoption of alternative flours in bread formulations. Additionally, innovations in food technology have enhanced the texture and nutritional profile of bread made from these alternative flours, further expanding their popularity in the market. As a result, breadmaking stands out as the largest application segment within the Flour Alternatives Market.
Flour Alternatives Market Segmentation
By Product
Corn Flour
Rice Flour
Sweet Potato Flour
Spelt flour
Buckwheat flour
Quinoa Flour
Oat flour
Coconut flour
Chickpea flour
Brown rice flour
Rye flour
Amaranth flour
Teff flour
Millet flour
Almond Flour
By Type
Gluten-containing flours
Gluten-free flours
By Application
Baked Goods
Noodles
Pastry
Fried Food
Pasta
Bread
Crackers
Countries Analyzed
North America (US, Canada, Mexico)
Europe (Germany, UK, France, Spain, Italy, Russia, Rest of Europe)
Asia Pacific (China, India, Japan, South Korea, Australia, South East Asia, Rest of Asia)
South America (Brazil, Argentina, Rest of South America)
Middle East and Africa (Saudi Arabia, UAE, Rest of Middle East, South Africa, Egypt, Rest of Africa)
Flour Alternatives Companies Profiled in the Study
Andean Valley Corp
Archer-Daniels-Midland Company (ADM)
Arrowhead Mills
Beichun
Bob's Red Mill Natural Foods, Inc.
Bunge Ltd
Cargill Inc
Carolina Innovative Food Ingredients Inc
COFCO Group
GoodMills Group
Hodgson Mill
Jinshahe Group
King Arthur Flour
Liuxu Food
Live Glean
Louis Dreyfus
Milne MicroDried
NorQuin
Pillsbury
Wilmar International Ltd
*- List Not Exhaustive
Chapter 1. TABLE OF CONTENTS
Chapter 2. Introduction to Flour Alternatives Market
2.1. Market Overview
2.2. Key Statistics and Report Highlights
2.3. Scope of the Comprehensive Study
2.3.1. Market Definition
2.3.2 Countries and Regions Covered
2.3.3 Research Objective
2.3.4 Units, Currency, and Conversions
2.3.5 Industry Value Chain
2.4. Key Market Segments
2.5. Key Companies
2.6. Study Period
Chapter 3. Strategic Analysis Review
3.1. Flour Alternatives Pricing Analysis and Forecast
3.2. Porter’s Five Forces
3.3. Market Ecosystem
3.4. SWOT Analysis
3.5. Regulatory Scenario
3.3. Effects of Inflation, Russia-Ukraine War, moderating economic growth, and other macroeconomic factors
Chapter 4. Competitive Landscape
4.1. Market Share Analysis
4.1.1. Global Flour Alternatives Market Share by Company, 2023
4.1.2. Product Offerings of Leading Flour Alternatives Companies
4.2. Market Entropy
4.2.1. New Product Launches in the Industry
4.2.2. Mergers, Acquisitions, Joint ventures, and Partnerships
4.3. Key Strategies and Best Practices
Chapter 5. Global Market Projections: Best, Reference, and Low Case Scenarios
5.1. Growth Analysis- Case Scenario Definitions
5.2. Low Growth Case Scenario Forecasts
5.3. Reference Growth Case Scenario Forecasts
5.4. High Growth Case Scenario Forecasts
Chapter 6. Market Dynamics
6.1. Flour Alternatives Market Drivers
6.2. Flour Alternatives Market Challenges
6.6. Flour Alternatives Market Opportunities
6.4. Flour Alternatives Market Trends
Chapter 7. Global Flour Alternatives Market Outlook Trends
7.1. Global Flour Alternatives Revenue (USD Million) and CAGR (%) by Type (2021-2032)
7.2. Global Flour Alternatives Revenue (USD Million) and CAGR (%) by Application (2021-2032)
7.3. Global Flour Alternatives Revenue (USD Million) and CAGR (%) by Product (2021-2032)
By Product
Corn Flour
Rice Flour
Sweet Potato Flour
Spelt flour
Buckwheat flour
Quinoa Flour
Oat flour
Coconut flour
Chickpea flour
Brown rice flour
Rye flour
Amaranth flour
Teff flour
Millet flour
Almond Flour
By Type
Gluten-containing flours
Gluten-free flours
By Application
Baked Goods
Noodles
Pastry
Fried Food
Pasta
Bread
Crackers
Chapter 8. Global Flour Alternatives Regional Analysis and Outlook
8.1. Global Flour Alternatives Revenue (USD Million) By Regions (2021- 2032)
8.2. North America Flour Alternatives Revenue (USD Million) by Country (2021-2032)
8.2.1. United States Flour Alternatives Regional Analysis and Outlook
8.2.2. Canada Flour Alternatives Regional Analysis and Outlook
8.2.3. Mexico Flour Alternatives Regional Analysis and Outlook
8.3. Europe Flour Alternatives Revenue (USD Million), by Country (2021-2032)
8.3.1. Germany Flour Alternatives Regional Analysis and Outlook
8.3.2. France Flour Alternatives Regional Analysis and Outlook
8.3.3. United Kingdom Flour Alternatives Regional Analysis and Outlook
8.3.4. Spain Flour Alternatives Regional Analysis and Outlook
8.3.5. Italy Flour Alternatives Regional Analysis and Outlook
8.3.6. Russia Flour Alternatives Regional Analysis and Outlook
8.3.7. Rest of Europe Flour Alternatives Regional Analysis and Outlook
8.4. Asia Pacific Flour Alternatives Revenue (USD Million) by Country (2021-2032)
8.4.1. China Flour Alternatives Regional Analysis and Outlook
8.4.2. Japan Flour Alternatives Regional Analysis and Outlook
8.4.3. India Flour Alternatives Regional Analysis and Outlook
8.4.4. South Korea Flour Alternatives Regional Analysis and Outlook
8.4.5. Australia Flour Alternatives Regional Analysis and Outlook
8.4.6. South East Asia Flour Alternatives Regional Analysis and Outlook
8.4.7. Rest of Asia Pacific Flour Alternatives Regional Analysis and Outlook
8.5. South America Flour Alternatives Revenue (USD Million), by Country (2021-2032)
8.5.1. Brazil Flour Alternatives Regional Analysis and Outlook
8.5.2. Argentina Flour Alternatives Regional Analysis and Outlook
8.5.3. Rest of South America Flour Alternatives Regional Analysis and Outlook
8.6. Middle East and Africa Flour Alternatives Revenue (USD Million) by Country (2021-2032)
8.6.1. Middle East Flour Alternatives Regional Analysis and Outlook
8.6.2. Africa Flour Alternatives Regional Analysis and Outlook
Chapter 9. North America Flour Alternatives Analysis and Outlook
9.1. North America Flour Alternatives Revenue (USD Million) by Segments (2021-2032)
9.1.1. North America Flour Alternatives Revenue (USD Million) by Type (2021-2032)
9.1.2. North America Flour Alternatives Revenue (USD Million) by Application (2021-2032)
9.1.3. North America Flour Alternatives Revenue (USD Million) by Product (2021-2032)
By Product
Corn Flour
Rice Flour
Sweet Potato Flour
Spelt flour
Buckwheat flour
Quinoa Flour
Oat flour
Coconut flour
Chickpea flour
Brown rice flour
Rye flour
Amaranth flour
Teff flour
Millet flour
Almond Flour
By Type
Gluten-containing flours
Gluten-free flours
By Application
Baked Goods
Noodles
Pastry
Fried Food
Pasta
Bread
Crackers
Chapter 10. Europe Flour Alternatives Analysis and Outlook
10.1. Europe Flour Alternatives Revenue (USD Million), by Segments (USD Million) (2021-2032)
10.1.1. Europe Flour Alternatives Revenue (USD Million) by Type (2021-2032)
10.1.2. Europe Flour Alternatives Revenue (USD Million) by Application (2021-2032)
10.1.3. Europe Flour Alternatives Revenue (USD Million) by Product (2021-2032)
By Product
Corn Flour
Rice Flour
Sweet Potato Flour
Spelt flour
Buckwheat flour
Quinoa Flour
Oat flour
Coconut flour
Chickpea flour
Brown rice flour
Rye flour
Amaranth flour
Teff flour
Millet flour
Almond Flour
By Type
Gluten-containing flours
Gluten-free flours
By Application
Baked Goods
Noodles
Pastry
Fried Food
Pasta
Bread
Crackers
Chapter 11. Asia Pacific Flour Alternatives Analysis and Outlook
11.1. Asia Pacific Flour Alternatives Revenue (USD Million), and Revenue (USD Million) by Segments (2021-2032)
11.1.1. Asia Pacific Flour Alternatives Revenue (USD Million) by Type (2021-2032)
11.1.2. Asia Pacific Flour Alternatives Revenue (USD Million) by Application (2021-2032)
11.1.3. Asia Pacific Flour Alternatives Revenue (USD Million) by Product (2021-2032)
By Product
Corn Flour
Rice Flour
Sweet Potato Flour
Spelt flour
Buckwheat flour
Quinoa Flour
Oat flour
Coconut flour
Chickpea flour
Brown rice flour
Rye flour
Amaranth flour
Teff flour
Millet flour
Almond Flour
By Type
Gluten-containing flours
Gluten-free flours
By Application
Baked Goods
Noodles
Pastry
Fried Food
Pasta
Bread
Crackers
Chapter 12. South America Flour Alternatives Analysis and Outlook
12.1. South America Flour Alternatives Revenue (USD Million), by Segments (2021-2032)
12.1.1. South America Flour Alternatives Revenue (USD Million) by Type (2021-2032)
12.1.2. South America Flour Alternatives Revenue (USD Million) by Application (2021-2032)
12.1.3. South America Flour Alternatives Revenue (USD Million) by Product (2021-2032)
By Product
Corn Flour
Rice Flour
Sweet Potato Flour
Spelt flour
Buckwheat flour
Quinoa Flour
Oat flour
Coconut flour
Chickpea flour
Brown rice flour
Rye flour
Amaranth flour
Teff flour
Millet flour
Almond Flour
By Type
Gluten-containing flours
Gluten-free flours
By Application
Baked Goods
Noodles
Pastry
Fried Food
Pasta
Bread
Crackers
Chapter 13. Middle East and Africa Flour Alternatives Analysis and Outlook
13.1. Middle East and Africa Flour Alternatives Revenue (USD Million), by Segments (2021-2032)
13.1.1. Middle East and Africa Flour Alternatives Revenue (USD Million) by Type (2021-2032)
13.1.2. Middle East and Africa Flour Alternatives Revenue (USD Million) by Application (2021-2032)
13.1.3. Middle East and Africa Flour Alternatives Revenue (USD Million) by Product (2021-2032)
By Product
Corn Flour
Rice Flour
Sweet Potato Flour
Spelt flour
Buckwheat flour
Quinoa Flour
Oat flour
Coconut flour
Chickpea flour
Brown rice flour
Rye flour
Amaranth flour
Teff flour
Millet flour
Almond Flour
By Type
Gluten-containing flours
Gluten-free flours
By Application
Baked Goods
Noodles
Pastry
Fried Food
Pasta
Bread
Crackers
Chapter 14. Flour Alternatives Company Profiles
14.1 Business Overview
14.2 Product Profiles
14.3 SWOT Profiles
14.5 Recent Developments
14.6 Financial Profile
List of Companies
Andean Valley Corp
Archer-Daniels-Midland Company (ADM)
Arrowhead Mills
Beichun
Bob's Red Mill Natural Foods, Inc.
Bunge Ltd
Cargill Inc
Carolina Innovative Food Ingredients Inc
COFCO Group
GoodMills Group
Hodgson Mill
Jinshahe Group
King Arthur Flour
Liuxu Food
Live Glean
Louis Dreyfus
Milne MicroDried
NorQuin
Pillsbury
Wilmar International Ltd
15. Methodology and Data Sources
15.1 Customization Offerings
15.2 Subscription Services
15.3 Related Reports
15.4 Publisher Expertise
LIST OF TABLES
Table 1 Market Segmentation Analysis
Table 2 Global Flour Alternatives Market Share of Leading Companies, 2023
Table 3 Product Offerings of Leading Companies
Table 4 Low Growth Scenario Forecasts
Table 5 Reference Case Growth Scenario
Table 6 High Growth Case Scenario
Table 7 Global Flour Alternatives Revenue (USD Million) And CAGR (%) By Type (2021-2032)
Table 8 Global Flour Alternatives Revenue (USD Million) And CAGR (%) By Application (2021-2032)
Table 9 Global Flour Alternatives Revenue (USD Million) And CAGR (%) By Product (2021-2032)
Table 10 Global Flour Alternatives Market Revenue (USD Million) By Regions (2021-2032)
Table 11 Global Flour Alternatives Market Share (%) By Regions (2021-2032)
Table 12 North America Flour Alternatives Revenue (USD Million) By Country (2021-2032)
Table 13 Europe Flour Alternatives Revenue (USD Million) By Country (2021-2032)
Table 14 Asia Pacific Flour Alternatives Revenue (USD Million) By Country (2021-2032)
Table 15 South America Flour Alternatives Revenue (USD Million) By Country (2021-2032)
Table 16 Middle East and Africa Flour Alternatives Revenue (USD Million) By Region (2021-2032)
Table 17 North America Flour Alternatives Revenue (USD Million) By Type (2021-2032)
Table 18 North America Flour Alternatives Revenue (USD Million) By Application (2021-2032)
Table 19 North America Flour Alternatives Revenue (USD Million) By Product (2021-2032)
Table 20 Europe Flour Alternatives Revenue (USD Million) By Type (2021-2032)
Table 21 Europe Flour Alternatives Revenue (USD Million) By Application (2021-2032)
Table 22 Europe Flour Alternatives Revenue (USD Million) By Product (2021-2032)
Table 23 Asia Pacific Flour Alternatives Revenue (USD Million) By Type (2021-2032)
Table 24 Asia Pacific Flour Alternatives Revenue (USD Million) By Application (2021-2032)
Table 25 Asia Pacific Flour Alternatives Revenue (USD Million) By Product (2021-2032)
Table 26 South America Flour Alternatives Revenue (USD Million) By Type (2021-2032)
Table 27 South America Flour Alternatives Revenue (USD Million) By Application (2021-2032)
Table 28 South America Flour Alternatives Revenue (USD Million) By Product (2021-2032)
Table 29 Middle East and Africa Flour Alternatives Revenue (USD Million) By Type (2021-2032)
Table 30 Middle East and Africa Flour Alternatives Revenue (USD Million) By Application (2021-2032)
Table 31 Middle East and Africa Flour Alternatives Revenue (USD Million) By Product (2021-2032)
LIST OF FIGURES
Figure 1. Market Scope
Figure 2. Pricing Forecasts Per Unit, 2023- 2032
Figure 3. Porter’s Five Forces
Figure 4. Global Flour Alternatives Market Revenue (USD Million) By Regions (2021-2032)
Figure 5. Global Flour Alternatives Market Share (%) By Regions (2023)
Figure 6. North America Flour Alternatives Revenue (USD Million) By Country (2021-2032)
Figure 7. United States Flour Alternatives Revenue (USD Million) By Country (2021-2032)
Figure 8. Canada Flour Alternatives Revenue (USD Million) By Country (2021-2032)
Figure 9. Mexico Flour Alternatives Revenue (USD Million) By Country (2021-2032)
Figure 10. Europe Flour Alternatives Revenue (USD Million) By Country (2021-2032)
Figure 11. Germany Flour Alternatives Revenue (USD Million) By Country (2021-2032)
Figure 12. France Flour Alternatives Revenue (USD Million) By Country (2021-2032)
Figure 13. United Kingdom Flour Alternatives Revenue (USD Million) By Country (2021-2032)
Figure 14. Spain Flour Alternatives Revenue (USD Million) By Country (2021-2032)
Figure 15. Italy Flour Alternatives Revenue (USD Million) By Country (2021-2032)
Figure 16. Russia Flour Alternatives Revenue (USD Million) By Country (2021-2032)
Figure 17. Rest of Europe Flour Alternatives Revenue (USD Million) By Country (2021-2032)
Figure 11. Asia Pacific Flour Alternatives Revenue (USD Million) By Country (2021-2032)
Figure 12. China Flour Alternatives Revenue (USD Million) By Country (2021-2032)
Figure 13. Japan Flour Alternatives Revenue (USD Million) By Country (2021-2032)
Figure 14. India Flour Alternatives Revenue (USD Million) By Country (2021-2032)
Figure 15. South Korea Flour Alternatives Revenue (USD Million) By Country (2021-2032)
Figure 16. Australia Flour Alternatives Revenue (USD Million) By Country (2021-2032)
Figure 17. South East Asia Flour Alternatives Revenue (USD Million) By Country (2021-2032)
Figure 18. South America Flour Alternatives Revenue (USD Million) By Country (2021-2032)
Figure 19. Brazil Flour Alternatives Revenue (USD Million) By Country (2021-2032)
Figure 20. Argentina Flour Alternatives Revenue (USD Million) By Country (2021-2032)
Figure 21. Rest of Asia Pacific Flour Alternatives Revenue (USD Million) By Country (2021-2032)
Figure 22. Middle East and Africa Flour Alternatives Revenue (USD Million) By Region (2021-2032)
Figure 23. Saudi Arabia Flour Alternatives Revenue (USD Million) By Region (2021-2032)
Figure 24. The UAE Flour Alternatives Revenue (USD Million) By Region (2021-2032)
Figure 25. Rest of Middle East Flour Alternatives Revenue (USD Million) By Region (2021-2032)
Figure 26. South Africa Flour Alternatives Revenue (USD Million) By Region (2021-2032)
Figure 27. Africa Flour Alternatives Revenue (USD Million) By Region (2021-2032)
Figure 28. North America Flour Alternatives Revenue (USD Million) By Type (2021-2032)
Figure 29. North America Flour Alternatives Revenue (USD Million) By Application (2021-2032)
Figure 30. North America Flour Alternatives Revenue (USD Million) By Product (2021-2032)
Figure 31. Europe Flour Alternatives Revenue (USD Million) By Type (2021-2032)
Figure 32. Europe Flour Alternatives Revenue (USD Million) By Application (2021-2032)
Figure 33. Europe Flour Alternatives Revenue (USD Million) By Product (2021-2032)
Figure 34. Asia Pacific Flour Alternatives Revenue (USD Million) By Type (2021-2032)
Figure 35. Asia Pacific Flour Alternatives Revenue (USD Million) By Application (2021-2032)
Figure 36. Asia Pacific Flour Alternatives Revenue (USD Million) By Product (2021-2032)
Figure 37. South America Flour Alternatives Revenue (USD Million) By Type (2021-2032)
Figure 38. South America Flour Alternatives Revenue (USD Million) By Application (2021-2032)
Figure 39. South America Flour Alternatives Revenue (USD Million) By Product (2021-2032)
Figure 40. Middle East and Africa Flour Alternatives Revenue (USD Million) By Type (2021-2032)
Figure 41. Middle East and Africa Flour Alternatives Revenue (USD Million) By Application (2021-2032)
Figure 42. Middle East and Africa Flour Alternatives Revenue (USD Million) By Product (2021-2032)
By Product
Corn Flour
Rice Flour
Sweet Potato Flour
Spelt flour
Buckwheat flour
Quinoa Flour
Oat flour
Coconut flour
Chickpea flour
Brown rice flour
Rye flour
Amaranth flour
Teff flour
Millet flour
Almond Flour
By Type
Gluten-containing flours
Gluten-free flours
By Application
Baked Goods
Noodles
Pastry
Fried Food
Pasta
Bread
Crackers
Countries Analyzed
North America (US, Canada, Mexico)
Europe (Germany, UK, France, Spain, Italy, Russia, Rest of Europe)
Asia Pacific (China, India, Japan, South Korea, Australia, South East Asia, Rest of Asia)
South America (Brazil, Argentina, Rest of South America)
Middle East and Africa (Saudi Arabia, UAE, Rest of Middle East, South Africa, Egypt, Rest of Africa)
