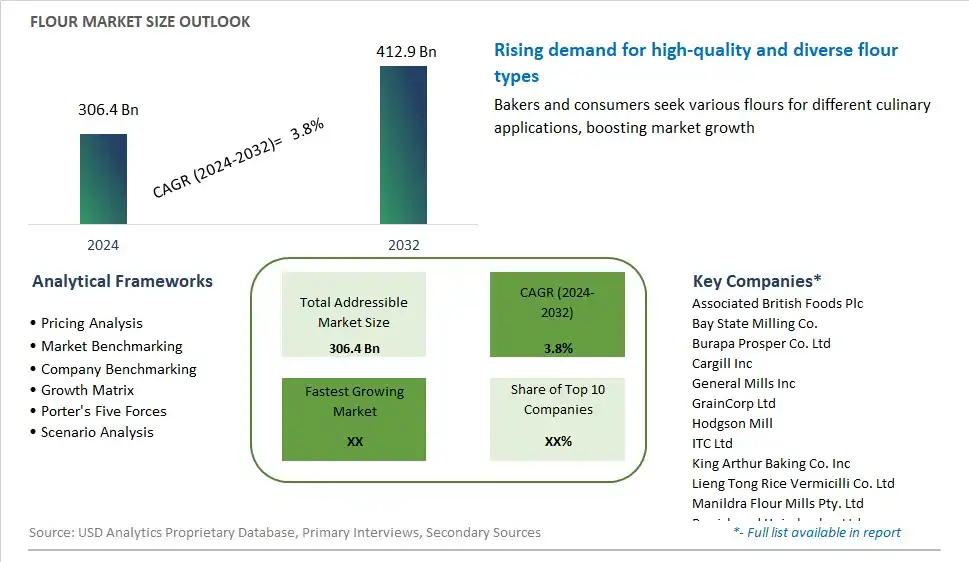
Global Flour Market Size is valued at $306.4 Billion in 2024 and is forecast to register a growth rate (CAGR) of 3.8% to reach $412.9 Billion by 2032.
The global Flour Market Comprehensive Study analyzes and forecasts the market size across 6 regions and 24 countries for diverse segments -By Type (Wheat, Maize/Corn, Rice), By Application (Bakery Products, Noodles, And Pasta, Biscuits/Waffles/Wafers, Animal Feed, Others)
An Introduction to Flour Market
Flour, a staple ingredient in cuisines worldwide, continues to be a fundamental component of the global food industry in 2024. Derived from grains such as wheat, rice, corn, and rye, flour serves as the foundation for a vast array of baked goods, pastas, snacks, and other culinary delights. The flour market is characterized by its versatility, with different types of flour offering distinct flavors, textures, and nutritional profiles. From all-purpose flour for everyday baking to specialty flours like almond flour and chickpea flour for gluten-free and high-protein recipes, consumers have a wide range of options to suit their dietary preferences and culinary needs. Moreover, technological advancements in milling processes, flour fortification, and packaging have enhanced the quality, safety, and shelf life of flour products, meeting the evolving demands of consumers and food manufacturers alike. As global food cultures continue to intertwine and diversify, flour remains a cornerstone of culinary traditions, innovation, and sustenance across the globe.
Flour Competitive Landscape
The market report analyses the leading companies in the industry including Associated British Foods Plc, Bay State Milling Co., Burapa Prosper Co. Ltd, Cargill Inc, General Mills Inc, GrainCorp Ltd, Hodgson Mill, ITC Ltd, King Arthur Baking Co. Inc, Lieng Tong Rice Vermicilli Co. Ltd, Manildra Flour Mills Pty. Ltd, Parrish and Heimbecker Ltd, PT Sriboga Raturaya, Savage Services Corp, Thai Flour Industry Co. Ltd, Thai Wah Public Co. Ltd, Wilmar International Ltd, and Others.
Flour Market Dynamics
Flour Market Trend: Growing Demand for Specialty and Alternative Flours
In the flour market, there's a prominent trend towards the growing demand for specialty and alternative flours, driven by changing consumer preferences, dietary restrictions, and culinary innovation. Consumers are increasingly seeking out flours made from ancient grains, gluten-free grains, pulses, nuts, and seeds as alternatives to traditional wheat flour. This trend is fueled by rising awareness of gluten intolerance, celiac disease, and the desire for healthier, nutrient-dense options. Additionally, the popularity of specialty diets such as paleo, keto, and vegan has led to a surge in demand for flours that align with these dietary lifestyles. As a result, manufacturers are expanding their product portfolios to include a diverse range of specialty flours, catering to the evolving needs and preferences of health-conscious consumers and food enthusiasts.
Market Driver: Increased Consumption of Baked Goods and Snack Foods
A key driver of the flour market is the increased consumption of baked goods and snack foods worldwide, fueled by changing lifestyles, urbanization, and the growing popularity of convenience foods. Baked goods such as bread, pastries, cakes, and cookies are staple items in many diets and cultures, driving consistent demand for flour as a primary ingredient. Moreover, the rising popularity of snacking and on-the-go consumption has led to a proliferation of snack food products such as crackers, chips, and granola bars, further driving the need for flour-based ingredients. Additionally, the COVID-19 pandemic has accelerated the trend of home baking and cooking, with consumers spending more time at home and seeking comfort in homemade treats. This increased home baking activity has contributed to a surge in flour sales, as people experiment with different recipes and explore new culinary experiences.
Market Opportunity: Expansion into Functional and Enriched Flours
An opportunity for growth in the flour market lies in the expansion into functional and enriched flours, offering added health benefits and nutritional value to consumers. Functional flours are formulated with added vitamins, minerals, fiber, and protein to enhance their nutritional profile and health-promoting properties. These flours cater to the growing demand for functional foods that support overall health and wellness, offering consumers a convenient way to incorporate essential nutrients into their diets. Additionally, enriched flours fortified with micronutrients such as iron, calcium, and folic acid address specific nutritional deficiencies and dietary requirements, appealing to health-conscious consumers seeking products that contribute to their daily nutrient intake. By developing innovative formulations and marketing strategies, manufacturers can capitalize on the trend towards functional and enriched foods, tapping into a lucrative market segment and differentiating their products in an increasingly competitive landscape.
Flour Market Share Analysis: Wheat held the dominant market share in 2024
In the Flour Market, the Wheat segment is the largest segment due to several factors driving its dominance. Wheat flour is a staple ingredient in various cuisines worldwide, serving as a primary source of carbohydrates and dietary fiber in diets across different cultures. Its versatility and wide range of applications, including bread, pasta, cakes, pastries, and noodles, make it an indispensable ingredient in the food industry. Further, wheat flour's gluten content contributes to the elasticity and texture of baked goods, enhancing their quality and palatability. Additionally, wheat is one of the most widely cultivated cereal grains globally, ensuring a consistent and abundant supply of wheat flour to meet consumer demand. Furthermore, the widespread availability of wheat flour through retail outlets, supermarkets, and online platforms further contributes to its dominance in the market. Consequently, the Wheat segment maintains its leadership position in the Flour Market, driven by its widespread usage, versatility, and established market presence across various culinary traditions.
Flour Market Share Analysis: Bakery Products market is poised to register the fastest growth rae over the forecast period to 2032
In the Flour Market, the Bakery Products segment is the fastest-growing segment due to several factors propelling its rapid expansion. The increasing demand for bakery products, including bread, cakes, pastries, and cookies, driven by changing consumer preferences, urbanization, and the rising popularity of convenience foods, fuels the growth of this segment. Further, the growing trend towards healthier and artisanal baked goods, coupled with the proliferation of bakery cafes and specialty bakeries, further boosts the demand for flour in bakery applications. Additionally, advancements in flour milling technology and ingredient formulations enable bakers to produce a wide variety of innovative and high-quality bakery products, catering to evolving consumer tastes and preferences. Furthermore, the globalization of food culture and the expansion of distribution networks facilitate the accessibility and availability of bakery products in emerging markets, driving the consumption of flour for bakery applications. Consequently, the Bakery Products segment is poised for robust growth, driven by the increasing demand for fresh, flavorful, and diverse baked goods across different demographics and geographies.
Flour Market Segmentation
By Type
Wheat
Maize/Corn
Rice
By Application
Bakery Products
Noodles, And Pasta
Biscuits/Waffles/Wafers
Animal Feed
Others
Countries Analyzed
North America (US, Canada, Mexico)
Europe (Germany, UK, France, Spain, Italy, Russia, Rest of Europe)
Asia Pacific (China, India, Japan, South Korea, Australia, South East Asia, Rest of Asia)
South America (Brazil, Argentina, Rest of South America)
Middle East and Africa (Saudi Arabia, UAE, Rest of Middle East, South Africa, Egypt, Rest of Africa)
Flour Companies Profiled in the Study
Associated British Foods Plc
Bay State Milling Co.
Burapa Prosper Co. Ltd
Cargill Inc
General Mills Inc
GrainCorp Ltd
Hodgson Mill
ITC Ltd
King Arthur Baking Co. Inc
Lieng Tong Rice Vermicilli Co. Ltd
Manildra Flour Mills Pty. Ltd
Parrish and Heimbecker Ltd
PT Sriboga Raturaya
Savage Services Corp
Thai Flour Industry Co. Ltd
Thai Wah Public Co. Ltd
Wilmar International Ltd
*- List Not Exhaustive
Chapter 1. TABLE OF CONTENTS
Chapter 2. Introduction to Flour Market
2.1. Market Overview
2.2. Key Statistics and Report Highlights
2.3. Scope of the Comprehensive Study
2.3.1. Market Definition
2.3.2 Countries and Regions Covered
2.3.3 Research Objective
2.3.4 Units, Currency, and Conversions
2.3.5 Industry Value Chain
2.4. Key Market Segments
2.5. Key Companies
2.6. Study Period
Chapter 3. Strategic Analysis Review
3.1. Flour Pricing Analysis and Forecast
3.2. Porter’s Five Forces
3.3. Market Ecosystem
3.4. SWOT Analysis
3.5. Regulatory Scenario
3.3. Effects of Inflation, Russia-Ukraine War, moderating economic growth, and other macroeconomic factors
Chapter 4. Competitive Landscape
4.1. Market Share Analysis
4.1.1. Global Flour Market Share by Company, 2023
4.1.2. Product Offerings of Leading Flour Companies
4.2. Market Entropy
4.2.1. New Product Launches in the Industry
4.2.2. Mergers, Acquisitions, Joint ventures, and Partnerships
4.3. Key Strategies and Best Practices
Chapter 5. Global Market Projections: Best, Reference, and Low Case Scenarios
5.1. Growth Analysis- Case Scenario Definitions
5.2. Low Growth Case Scenario Forecasts
5.3. Reference Growth Case Scenario Forecasts
5.4. High Growth Case Scenario Forecasts
Chapter 6. Market Dynamics
6.1. Flour Market Drivers
6.2. Flour Market Challenges
6.6. Flour Market Opportunities
6.4. Flour Market Trends
Chapter 7. Global Flour Market Outlook Trends
7.1. Global Flour Revenue (USD Million) and CAGR (%) by Type (2021-2032)
7.2. Global Flour Revenue (USD Million) and CAGR (%) by Application (2021-2032)
7.3. Global Flour Revenue (USD Million) and CAGR (%) by Product (2021-2032)
By Type
Wheat
Maize/Corn
Rice
By Application
Bakery Products
Noodles, And Pasta
Biscuits/Waffles/Wafers
Animal Feed
Others
Chapter 8. Global Flour Regional Analysis and Outlook
8.1. Global Flour Revenue (USD Million) By Regions (2021- 2032)
8.2. North America Flour Revenue (USD Million) by Country (2021-2032)
8.2.1. United States Flour Regional Analysis and Outlook
8.2.2. Canada Flour Regional Analysis and Outlook
8.2.3. Mexico Flour Regional Analysis and Outlook
8.3. Europe Flour Revenue (USD Million), by Country (2021-2032)
8.3.1. Germany Flour Regional Analysis and Outlook
8.3.2. France Flour Regional Analysis and Outlook
8.3.3. United Kingdom Flour Regional Analysis and Outlook
8.3.4. Spain Flour Regional Analysis and Outlook
8.3.5. Italy Flour Regional Analysis and Outlook
8.3.6. Russia Flour Regional Analysis and Outlook
8.3.7. Rest of Europe Flour Regional Analysis and Outlook
8.4. Asia Pacific Flour Revenue (USD Million) by Country (2021-2032)
8.4.1. China Flour Regional Analysis and Outlook
8.4.2. Japan Flour Regional Analysis and Outlook
8.4.3. India Flour Regional Analysis and Outlook
8.4.4. South Korea Flour Regional Analysis and Outlook
8.4.5. Australia Flour Regional Analysis and Outlook
8.4.6. South East Asia Flour Regional Analysis and Outlook
8.4.7. Rest of Asia Pacific Flour Regional Analysis and Outlook
8.5. South America Flour Revenue (USD Million), by Country (2021-2032)
8.5.1. Brazil Flour Regional Analysis and Outlook
8.5.2. Argentina Flour Regional Analysis and Outlook
8.5.3. Rest of South America Flour Regional Analysis and Outlook
8.6. Middle East and Africa Flour Revenue (USD Million) by Country (2021-2032)
8.6.1. Middle East Flour Regional Analysis and Outlook
8.6.2. Africa Flour Regional Analysis and Outlook
Chapter 9. North America Flour Analysis and Outlook
9.1. North America Flour Revenue (USD Million) by Segments (2021-2032)
9.1.1. North America Flour Revenue (USD Million) by Type (2021-2032)
9.1.2. North America Flour Revenue (USD Million) by Application (2021-2032)
9.1.3. North America Flour Revenue (USD Million) by Product (2021-2032)
By Type
Wheat
Maize/Corn
Rice
By Application
Bakery Products
Noodles, And Pasta
Biscuits/Waffles/Wafers
Animal Feed
Others
Chapter 10. Europe Flour Analysis and Outlook
10.1. Europe Flour Revenue (USD Million), by Segments (USD Million) (2021-2032)
10.1.1. Europe Flour Revenue (USD Million) by Type (2021-2032)
10.1.2. Europe Flour Revenue (USD Million) by Application (2021-2032)
10.1.3. Europe Flour Revenue (USD Million) by Product (2021-2032)
By Type
Wheat
Maize/Corn
Rice
By Application
Bakery Products
Noodles, And Pasta
Biscuits/Waffles/Wafers
Animal Feed
Others
Chapter 11. Asia Pacific Flour Analysis and Outlook
11.1. Asia Pacific Flour Revenue (USD Million), and Revenue (USD Million) by Segments (2021-2032)
11.1.1. Asia Pacific Flour Revenue (USD Million) by Type (2021-2032)
11.1.2. Asia Pacific Flour Revenue (USD Million) by Application (2021-2032)
11.1.3. Asia Pacific Flour Revenue (USD Million) by Product (2021-2032)
By Type
Wheat
Maize/Corn
Rice
By Application
Bakery Products
Noodles, And Pasta
Biscuits/Waffles/Wafers
Animal Feed
Others
Chapter 12. South America Flour Analysis and Outlook
12.1. South America Flour Revenue (USD Million), by Segments (2021-2032)
12.1.1. South America Flour Revenue (USD Million) by Type (2021-2032)
12.1.2. South America Flour Revenue (USD Million) by Application (2021-2032)
12.1.3. South America Flour Revenue (USD Million) by Product (2021-2032)
By Type
Wheat
Maize/Corn
Rice
By Application
Bakery Products
Noodles, And Pasta
Biscuits/Waffles/Wafers
Animal Feed
Others
Chapter 13. Middle East and Africa Flour Analysis and Outlook
13.1. Middle East and Africa Flour Revenue (USD Million), by Segments (2021-2032)
13.1.1. Middle East and Africa Flour Revenue (USD Million) by Type (2021-2032)
13.1.2. Middle East and Africa Flour Revenue (USD Million) by Application (2021-2032)
13.1.3. Middle East and Africa Flour Revenue (USD Million) by Product (2021-2032)
By Type
Wheat
Maize/Corn
Rice
By Application
Bakery Products
Noodles, And Pasta
Biscuits/Waffles/Wafers
Animal Feed
Others
Chapter 14. Flour Company Profiles
14.1 Business Overview
14.2 Product Profiles
14.3 SWOT Profiles
14.5 Recent Developments
14.6 Financial Profile
List of Companies
Associated British Foods Plc
Bay State Milling Co.
Burapa Prosper Co. Ltd
Cargill Inc
General Mills Inc
GrainCorp Ltd
Hodgson Mill
ITC Ltd
King Arthur Baking Co. Inc
Lieng Tong Rice Vermicilli Co. Ltd
Manildra Flour Mills Pty. Ltd
Parrish and Heimbecker Ltd
PT Sriboga Raturaya
Savage Services Corp
Thai Flour Industry Co. Ltd
Thai Wah Public Co. Ltd
Wilmar International Ltd
15. Methodology and Data Sources
15.1 Customization Offerings
15.2 Subscription Services
15.3 Related Reports
15.4 Publisher Expertise
LIST OF TABLES
Table 1 Market Segmentation Analysis
Table 2 Global Flour Market Share of Leading Companies, 2023
Table 3 Product Offerings of Leading Companies
Table 4 Low Growth Scenario Forecasts
Table 5 Reference Case Growth Scenario
Table 6 High Growth Case Scenario
Table 7 Global Flour Revenue (USD Million) And CAGR (%) By Type (2021-2032)
Table 8 Global Flour Revenue (USD Million) And CAGR (%) By Application (2021-2032)
Table 9 Global Flour Revenue (USD Million) And CAGR (%) By Product (2021-2032)
Table 10 Global Flour Market Revenue (USD Million) By Regions (2021-2032)
Table 11 Global Flour Market Share (%) By Regions (2021-2032)
Table 12 North America Flour Revenue (USD Million) By Country (2021-2032)
Table 13 Europe Flour Revenue (USD Million) By Country (2021-2032)
Table 14 Asia Pacific Flour Revenue (USD Million) By Country (2021-2032)
Table 15 South America Flour Revenue (USD Million) By Country (2021-2032)
Table 16 Middle East and Africa Flour Revenue (USD Million) By Region (2021-2032)
Table 17 North America Flour Revenue (USD Million) By Type (2021-2032)
Table 18 North America Flour Revenue (USD Million) By Application (2021-2032)
Table 19 North America Flour Revenue (USD Million) By Product (2021-2032)
Table 20 Europe Flour Revenue (USD Million) By Type (2021-2032)
Table 21 Europe Flour Revenue (USD Million) By Application (2021-2032)
Table 22 Europe Flour Revenue (USD Million) By Product (2021-2032)
Table 23 Asia Pacific Flour Revenue (USD Million) By Type (2021-2032)
Table 24 Asia Pacific Flour Revenue (USD Million) By Application (2021-2032)
Table 25 Asia Pacific Flour Revenue (USD Million) By Product (2021-2032)
Table 26 South America Flour Revenue (USD Million) By Type (2021-2032)
Table 27 South America Flour Revenue (USD Million) By Application (2021-2032)
Table 28 South America Flour Revenue (USD Million) By Product (2021-2032)
Table 29 Middle East and Africa Flour Revenue (USD Million) By Type (2021-2032)
Table 30 Middle East and Africa Flour Revenue (USD Million) By Application (2021-2032)
Table 31 Middle East and Africa Flour Revenue (USD Million) By Product (2021-2032)
LIST OF FIGURES
Figure 1. Market Scope
Figure 2. Pricing Forecasts Per Unit, 2023- 2032
Figure 3. Porter’s Five Forces
Figure 4. Global Flour Market Revenue (USD Million) By Regions (2021-2032)
Figure 5. Global Flour Market Share (%) By Regions (2023)
Figure 6. North America Flour Revenue (USD Million) By Country (2021-2032)
Figure 7. United States Flour Revenue (USD Million) By Country (2021-2032)
Figure 8. Canada Flour Revenue (USD Million) By Country (2021-2032)
Figure 9. Mexico Flour Revenue (USD Million) By Country (2021-2032)
Figure 10. Europe Flour Revenue (USD Million) By Country (2021-2032)
Figure 11. Germany Flour Revenue (USD Million) By Country (2021-2032)
Figure 12. France Flour Revenue (USD Million) By Country (2021-2032)
Figure 13. United Kingdom Flour Revenue (USD Million) By Country (2021-2032)
Figure 14. Spain Flour Revenue (USD Million) By Country (2021-2032)
Figure 15. Italy Flour Revenue (USD Million) By Country (2021-2032)
Figure 16. Russia Flour Revenue (USD Million) By Country (2021-2032)
Figure 17. Rest of Europe Flour Revenue (USD Million) By Country (2021-2032)
Figure 11. Asia Pacific Flour Revenue (USD Million) By Country (2021-2032)
Figure 12. China Flour Revenue (USD Million) By Country (2021-2032)
Figure 13. Japan Flour Revenue (USD Million) By Country (2021-2032)
Figure 14. India Flour Revenue (USD Million) By Country (2021-2032)
Figure 15. South Korea Flour Revenue (USD Million) By Country (2021-2032)
Figure 16. Australia Flour Revenue (USD Million) By Country (2021-2032)
Figure 17. South East Asia Flour Revenue (USD Million) By Country (2021-2032)
Figure 18. South America Flour Revenue (USD Million) By Country (2021-2032)
Figure 19. Brazil Flour Revenue (USD Million) By Country (2021-2032)
Figure 20. Argentina Flour Revenue (USD Million) By Country (2021-2032)
Figure 21. Rest of Asia Pacific Flour Revenue (USD Million) By Country (2021-2032)
Figure 22. Middle East and Africa Flour Revenue (USD Million) By Region (2021-2032)
Figure 23. Saudi Arabia Flour Revenue (USD Million) By Region (2021-2032)
Figure 24. The UAE Flour Revenue (USD Million) By Region (2021-2032)
Figure 25. Rest of Middle East Flour Revenue (USD Million) By Region (2021-2032)
Figure 26. South Africa Flour Revenue (USD Million) By Region (2021-2032)
Figure 27. Africa Flour Revenue (USD Million) By Region (2021-2032)
Figure 28. North America Flour Revenue (USD Million) By Type (2021-2032)
Figure 29. North America Flour Revenue (USD Million) By Application (2021-2032)
Figure 30. North America Flour Revenue (USD Million) By Product (2021-2032)
Figure 31. Europe Flour Revenue (USD Million) By Type (2021-2032)
Figure 32. Europe Flour Revenue (USD Million) By Application (2021-2032)
Figure 33. Europe Flour Revenue (USD Million) By Product (2021-2032)
Figure 34. Asia Pacific Flour Revenue (USD Million) By Type (2021-2032)
Figure 35. Asia Pacific Flour Revenue (USD Million) By Application (2021-2032)
Figure 36. Asia Pacific Flour Revenue (USD Million) By Product (2021-2032)
Figure 37. South America Flour Revenue (USD Million) By Type (2021-2032)
Figure 38. South America Flour Revenue (USD Million) By Application (2021-2032)
Figure 39. South America Flour Revenue (USD Million) By Product (2021-2032)
Figure 40. Middle East and Africa Flour Revenue (USD Million) By Type (2021-2032)
Figure 41. Middle East and Africa Flour Revenue (USD Million) By Application (2021-2032)
Figure 42. Middle East and Africa Flour Revenue (USD Million) By Product (2021-2032)
By Type
Wheat
Maize/Corn
Rice
By Application
Bakery Products
Noodles, And Pasta
Biscuits/Waffles/Wafers
Animal Feed
Others
Countries Analyzed
North America (US, Canada, Mexico)
Europe (Germany, UK, France, Spain, Italy, Russia, Rest of Europe)
Asia Pacific (China, India, Japan, South Korea, Australia, South East Asia, Rest of Asia)
South America (Brazil, Argentina, Rest of South America)
Middle East and Africa (Saudi Arabia, UAE, Rest of Middle East, South Africa, Egypt, Rest of Africa)
