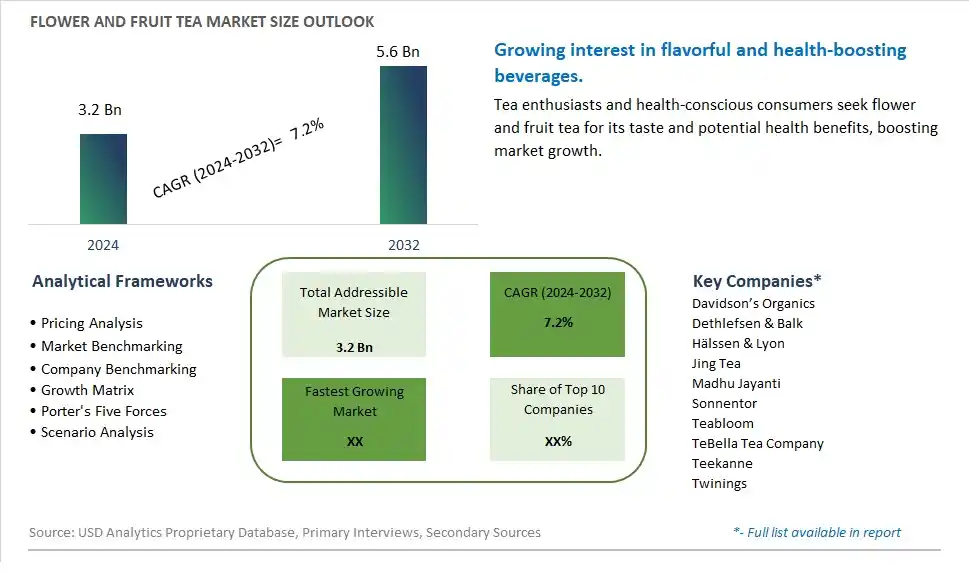
Global Flower and Fruit Tea Market Size is valued at $3.2 Billion in 2024 and is forecast to register a growth rate (CAGR) of 7.2% to reach $5.6 Billion by 2032.
The global Flower and Fruit Tea Market Comprehensive Study analyzes and forecasts the market size across 6 regions and 24 countries for diverse segments -By Type (Loose Package, Individual Package), By Application (Online, Offline), By floral Source (Chamomile, Calendula, Rose, Blue Lotus, Hibiscus, Chrysanthemum, Rooibos, Others), By Product (Traditional, Unsweetened, Sweetened, Flavored)
An Introduction to Flower and Fruit Tea Market
The Flower and Fruit Tea market in 2024 is witnessing robust growth, driven by the rising demand for flavorful and health-enhancing beverages. Flower and fruit teas, made from dried flowers, fruits, and herbs, are popular for their refreshing taste and antioxidant benefits. The market benefits from advancements in tea blending and packaging technologies, the growing trend of natural and organic beverages, and the expansion of the specialty tea sector. Additionally, the increasing awareness of the health benefits of flower and fruit teas is contributing to market growth.
Flower and Fruit Tea Competitive Landscape
The market report analyses the leading companies in the industry including Davidson’s Organics, Dethlefsen & Balk, Hälssen & Lyon, Jing Tea, Madhu Jayanti, Sonnentor, Teabloom, TeBella Tea Company, Teekanne, Twinings, and Others.
Flower and Fruit Tea Market Dynamics
Flower and Fruit Tea Market Trend: Increasing Demand for Natural and Health-Conscious Beverages
One prominent trend in the flower and fruit tea market is the increasing demand for natural and health-conscious beverages. Consumers are gravitating towards herbal teas infused with flowers, fruits, and botanicals due to their perceived health benefits, refreshing flavors, and absence of caffeine. This trend is driven by a growing awareness of the importance of hydration, wellness, and functional ingredients in beverages. Flower and fruit teas are gaining popularity as alternatives to traditional caffeinated drinks, appealing to health-conscious individuals seeking flavorful and nourishing options that support overall well-being and hydration goals.
Flower and Fruit Tea Market Driver: Wellness and Lifestyle Shifts Towards Functional Beverages
A key driver propelling the flower and fruit tea market is the broader wellness and lifestyle shifts towards functional beverages. With consumers prioritizing holistic health, relaxation, and self-care rituals, there's a rising demand for teas that offer therapeutic properties, antioxidants, and natural flavors. Flower teas like chamomile, hibiscus, and lavender are known for their calming effects, while fruit teas provide vitamin-rich hydration and vibrant taste experiences. This driver emphasizes the importance of product innovation, quality ingredients, and sensory appeal in meeting evolving consumer preferences for functional and enjoyable beverage options that complement their lifestyles.
Flower and Fruit Tea Market Opportunity: Expansion into Artisanal and Premium Tea Blends
A significant opportunity in the flower and fruit tea market lies in the expansion into artisanal and premium tea blends. Manufacturers and tea brands can capitalize on this opportunity by creating unique blends that combine floral notes, fruit essences, and herbal infusions to offer distinctive flavor profiles and sensory experiences. Artisanal tea blends crafted with high-quality ingredients, sourced sustainably and ethically, can target discerning consumers who appreciate authenticity, craftsmanship, and premium offerings. Additionally, there's potential to explore organic, fair-trade, and single-origin teas within the flower and fruit tea category, catering to a growing segment of environmentally conscious and ethically minded tea enthusiasts. By focusing on innovation, storytelling, and quality craftsmanship, companies can differentiate their tea products, capture premium market segments, and foster customer loyalty in the competitive beverage industry.
Flower and Fruit Tea Market Share Analysis: Loose Package segment generated the highest revenue share in the industry
In the Flower and Fruit Tea Market, the largest segment by type is Loose Package. This segment includes flower and fruit teas that are packaged in loose form, allowing consumers to brew them according to their preferences. Loose package teas are popular among tea enthusiasts and health-conscious consumers who appreciate the natural flavors and aromas of flower and fruit infusions. This segment's dominance is driven by the flexibility it offers in terms of brewing strength and customization, appealing to a diverse consumer base interested in premium tea experiences and wellness benefits associated with natural ingredients.
Flower and Fruit Tea Market Share Analysis: Online Application is the fastest growing segment over the forecast period to 2032
The segment of the Flower and Fruit Tea Market that is experiencing the fastest growth to 2032 is Online Application. This growth is fueled by the increasing adoption of e-commerce platforms and online shopping habits among consumers globally. Online channels provide convenience, wider product selections, and competitive pricing, attracting a growing number of consumers to purchase flower and fruit teas online. The shift towards digital platforms is further accelerated by technological advancements, robust logistics networks, and changing consumer behaviors favoring online shopping for specialty products like tea. This trend underscores the significant opportunities for market expansion and reaching new consumer demographics through online retail channels.
Flower and Fruit Tea Market Share Analysis: Chamomile segment generated the highest revenue share in the industry
In the Flower and Fruit Tea Market segmented by floral source, Chamomile emerges as the largest segment. Chamomile tea is renowned for its soothing properties and delicate floral aroma, making it a popular choice among consumers seeking relaxation and natural wellness benefits. The appeal of chamomile extends across various demographics due to its mild flavor profile and reputed health benefits, including digestive support and stress relief. Its versatility in blends with other herbs and flowers further enhances its market presence, catering to both traditional tea drinkers and health-conscious individuals looking for herbal infusions.
Flower and Fruit Tea Market Share Analysis: Flavored is the fastest growing segment over the forecast period to 2032
The segment of the Flower and Fruit Tea Market that is experiencing the fastest growth to 2032 is Flavored teas. This growth is driven by consumer demand for innovative and diverse flavor profiles that enhance the tea-drinking experience. Flavored teas combine floral and fruit elements with added natural flavors, appealing to a broad range of taste preferences and enticing new consumers to explore tea as a beverage choice. The popularity of flavored teas is bolstered by their versatility in catering to different consumer preferences, from traditional tea enthusiasts to those seeking indulgent, gourmet experiences. As the market for specialty teas expands, flavored teas are poised to capitalize on evolving consumer trends and preferences, driving significant growth in the segment.
Flower and Fruit Tea Market Segmentation
By Type
Loose Package
Individual Package
By Application
Online
Offline
By floral Source
Chamomile
Calendula
Rose
Blue Lotus
Hibiscus
Chrysanthemum
Rooibos
Others
By Product
Traditional
Unsweetened
Sweetened
Flavored
Countries Analyzed
North America (US, Canada, Mexico)
Europe (Germany, UK, France, Spain, Italy, Russia, Rest of Europe)
Asia Pacific (China, India, Japan, South Korea, Australia, South East Asia, Rest of Asia)
South America (Brazil, Argentina, Rest of South America)
Middle East and Africa (Saudi Arabia, UAE, Rest of Middle East, South Africa, Egypt, Rest of Africa)
Flower and Fruit Tea Companies Profiled in the Study
Davidson’s Organics
Dethlefsen & Balk
Hälssen & Lyon
Jing Tea
Madhu Jayanti
Sonnentor
Teabloom
TeBella Tea Company
Teekanne
Twinings
*- List Not Exhaustive
Chapter 1. TABLE OF CONTENTS
Chapter 2. Introduction to Flower and Fruit Tea Market
2.1. Market Overview
2.2. Key Statistics and Report Highlights
2.3. Scope of the Comprehensive Study
2.3.1. Market Definition
2.3.2 Countries and Regions Covered
2.3.3 Research Objective
2.3.4 Units, Currency, and Conversions
2.3.5 Industry Value Chain
2.4. Key Market Segments
2.5. Key Companies
2.6. Study Period
Chapter 3. Strategic Analysis Review
3.1. Flower and Fruit Tea Pricing Analysis and Forecast
3.2. Porter’s Five Forces
3.3. Market Ecosystem
3.4. SWOT Analysis
3.5. Regulatory Scenario
3.3. Effects of Inflation, Russia-Ukraine War, moderating economic growth, and other macroeconomic factors
Chapter 4. Competitive Landscape
4.1. Market Share Analysis
4.1.1. Global Flower and Fruit Tea Market Share by Company, 2023
4.1.2. Product Offerings of Leading Flower and Fruit Tea Companies
4.2. Market Entropy
4.2.1. New Product Launches in the Industry
4.2.2. Mergers, Acquisitions, Joint ventures, and Partnerships
4.3. Key Strategies and Best Practices
Chapter 5. Global Market Projections: Best, Reference, and Low Case Scenarios
5.1. Growth Analysis- Case Scenario Definitions
5.2. Low Growth Case Scenario Forecasts
5.3. Reference Growth Case Scenario Forecasts
5.4. High Growth Case Scenario Forecasts
Chapter 6. Market Dynamics
6.1. Flower and Fruit Tea Market Drivers
6.2. Flower and Fruit Tea Market Challenges
6.6. Flower and Fruit Tea Market Opportunities
6.4. Flower and Fruit Tea Market Trends
Chapter 7. Global Flower and Fruit Tea Market Outlook Trends
7.1. Global Flower and Fruit Tea Revenue (USD Million) and CAGR (%) by Type (2021-2032)
7.2. Global Flower and Fruit Tea Revenue (USD Million) and CAGR (%) by Application (2021-2032)
7.3. Global Flower and Fruit Tea Revenue (USD Million) and CAGR (%) by Product (2021-2032)
By Type
Loose Package
Individual Package
By Application
Online
Offline
By floral Source
Chamomile
Calendula
Rose
Blue Lotus
Hibiscus
Chrysanthemum
Rooibos
Others
By Product
Traditional
Unsweetened
Sweetened
Flavored
Chapter 8. Global Flower and Fruit Tea Regional Analysis and Outlook
8.1. Global Flower and Fruit Tea Revenue (USD Million) By Regions (2021- 2032)
8.2. North America Flower and Fruit Tea Revenue (USD Million) by Country (2021-2032)
8.2.1. United States Flower and Fruit Tea Regional Analysis and Outlook
8.2.2. Canada Flower and Fruit Tea Regional Analysis and Outlook
8.2.3. Mexico Flower and Fruit Tea Regional Analysis and Outlook
8.3. Europe Flower and Fruit Tea Revenue (USD Million), by Country (2021-2032)
8.3.1. Germany Flower and Fruit Tea Regional Analysis and Outlook
8.3.2. France Flower and Fruit Tea Regional Analysis and Outlook
8.3.3. United Kingdom Flower and Fruit Tea Regional Analysis and Outlook
8.3.4. Spain Flower and Fruit Tea Regional Analysis and Outlook
8.3.5. Italy Flower and Fruit Tea Regional Analysis and Outlook
8.3.6. Russia Flower and Fruit Tea Regional Analysis and Outlook
8.3.7. Rest of Europe Flower and Fruit Tea Regional Analysis and Outlook
8.4. Asia Pacific Flower and Fruit Tea Revenue (USD Million) by Country (2021-2032)
8.4.1. China Flower and Fruit Tea Regional Analysis and Outlook
8.4.2. Japan Flower and Fruit Tea Regional Analysis and Outlook
8.4.3. India Flower and Fruit Tea Regional Analysis and Outlook
8.4.4. South Korea Flower and Fruit Tea Regional Analysis and Outlook
8.4.5. Australia Flower and Fruit Tea Regional Analysis and Outlook
8.4.6. South East Asia Flower and Fruit Tea Regional Analysis and Outlook
8.4.7. Rest of Asia Pacific Flower and Fruit Tea Regional Analysis and Outlook
8.5. South America Flower and Fruit Tea Revenue (USD Million), by Country (2021-2032)
8.5.1. Brazil Flower and Fruit Tea Regional Analysis and Outlook
8.5.2. Argentina Flower and Fruit Tea Regional Analysis and Outlook
8.5.3. Rest of South America Flower and Fruit Tea Regional Analysis and Outlook
8.6. Middle East and Africa Flower and Fruit Tea Revenue (USD Million) by Country (2021-2032)
8.6.1. Middle East Flower and Fruit Tea Regional Analysis and Outlook
8.6.2. Africa Flower and Fruit Tea Regional Analysis and Outlook
Chapter 9. North America Flower and Fruit Tea Analysis and Outlook
9.1. North America Flower and Fruit Tea Revenue (USD Million) by Segments (2021-2032)
9.1.1. North America Flower and Fruit Tea Revenue (USD Million) by Type (2021-2032)
9.1.2. North America Flower and Fruit Tea Revenue (USD Million) by Application (2021-2032)
9.1.3. North America Flower and Fruit Tea Revenue (USD Million) by Product (2021-2032)
By Type
Loose Package
Individual Package
By Application
Online
Offline
By floral Source
Chamomile
Calendula
Rose
Blue Lotus
Hibiscus
Chrysanthemum
Rooibos
Others
By Product
Traditional
Unsweetened
Sweetened
Flavored
Chapter 10. Europe Flower and Fruit Tea Analysis and Outlook
10.1. Europe Flower and Fruit Tea Revenue (USD Million), by Segments (USD Million) (2021-2032)
10.1.1. Europe Flower and Fruit Tea Revenue (USD Million) by Type (2021-2032)
10.1.2. Europe Flower and Fruit Tea Revenue (USD Million) by Application (2021-2032)
10.1.3. Europe Flower and Fruit Tea Revenue (USD Million) by Product (2021-2032)
By Type
Loose Package
Individual Package
By Application
Online
Offline
By floral Source
Chamomile
Calendula
Rose
Blue Lotus
Hibiscus
Chrysanthemum
Rooibos
Others
By Product
Traditional
Unsweetened
Sweetened
Flavored
Chapter 11. Asia Pacific Flower and Fruit Tea Analysis and Outlook
11.1. Asia Pacific Flower and Fruit Tea Revenue (USD Million), and Revenue (USD Million) by Segments (2021-2032)
11.1.1. Asia Pacific Flower and Fruit Tea Revenue (USD Million) by Type (2021-2032)
11.1.2. Asia Pacific Flower and Fruit Tea Revenue (USD Million) by Application (2021-2032)
11.1.3. Asia Pacific Flower and Fruit Tea Revenue (USD Million) by Product (2021-2032)
By Type
Loose Package
Individual Package
By Application
Online
Offline
By floral Source
Chamomile
Calendula
Rose
Blue Lotus
Hibiscus
Chrysanthemum
Rooibos
Others
By Product
Traditional
Unsweetened
Sweetened
Flavored
Chapter 12. South America Flower and Fruit Tea Analysis and Outlook
12.1. South America Flower and Fruit Tea Revenue (USD Million), by Segments (2021-2032)
12.1.1. South America Flower and Fruit Tea Revenue (USD Million) by Type (2021-2032)
12.1.2. South America Flower and Fruit Tea Revenue (USD Million) by Application (2021-2032)
12.1.3. South America Flower and Fruit Tea Revenue (USD Million) by Product (2021-2032)
By Type
Loose Package
Individual Package
By Application
Online
Offline
By floral Source
Chamomile
Calendula
Rose
Blue Lotus
Hibiscus
Chrysanthemum
Rooibos
Others
By Product
Traditional
Unsweetened
Sweetened
Flavored
Chapter 13. Middle East and Africa Flower and Fruit Tea Analysis and Outlook
13.1. Middle East and Africa Flower and Fruit Tea Revenue (USD Million), by Segments (2021-2032)
13.1.1. Middle East and Africa Flower and Fruit Tea Revenue (USD Million) by Type (2021-2032)
13.1.2. Middle East and Africa Flower and Fruit Tea Revenue (USD Million) by Application (2021-2032)
13.1.3. Middle East and Africa Flower and Fruit Tea Revenue (USD Million) by Product (2021-2032)
By Type
Loose Package
Individual Package
By Application
Online
Offline
By floral Source
Chamomile
Calendula
Rose
Blue Lotus
Hibiscus
Chrysanthemum
Rooibos
Others
By Product
Traditional
Unsweetened
Sweetened
Flavored
Chapter 14. Flower and Fruit Tea Company Profiles
14.1 Business Overview
14.2 Product Profiles
14.3 SWOT Profiles
14.5 Recent Developments
14.6 Financial Profile
List of Companies
Davidson’s Organics
Dethlefsen & Balk
Hälssen & Lyon
Jing Tea
Madhu Jayanti
Sonnentor
Teabloom
TeBella Tea Company
Teekanne
Twinings
15. Methodology and Data Sources
15.1 Customization Offerings
15.2 Subscription Services
15.3 Related Reports
15.4 Publisher Expertise
LIST OF TABLES
Table 1 Market Segmentation Analysis
Table 2 Global Flower and Fruit Tea Market Share of Leading Companies, 2023
Table 3 Product Offerings of Leading Companies
Table 4 Low Growth Scenario Forecasts
Table 5 Reference Case Growth Scenario
Table 6 High Growth Case Scenario
Table 7 Global Flower and Fruit Tea Revenue (USD Million) And CAGR (%) By Type (2021-2032)
Table 8 Global Flower and Fruit Tea Revenue (USD Million) And CAGR (%) By Application (2021-2032)
Table 9 Global Flower and Fruit Tea Revenue (USD Million) And CAGR (%) By Product (2021-2032)
Table 10 Global Flower and Fruit Tea Market Revenue (USD Million) By Regions (2021-2032)
Table 11 Global Flower and Fruit Tea Market Share (%) By Regions (2021-2032)
Table 12 North America Flower and Fruit Tea Revenue (USD Million) By Country (2021-2032)
Table 13 Europe Flower and Fruit Tea Revenue (USD Million) By Country (2021-2032)
Table 14 Asia Pacific Flower and Fruit Tea Revenue (USD Million) By Country (2021-2032)
Table 15 South America Flower and Fruit Tea Revenue (USD Million) By Country (2021-2032)
Table 16 Middle East and Africa Flower and Fruit Tea Revenue (USD Million) By Region (2021-2032)
Table 17 North America Flower and Fruit Tea Revenue (USD Million) By Type (2021-2032)
Table 18 North America Flower and Fruit Tea Revenue (USD Million) By Application (2021-2032)
Table 19 North America Flower and Fruit Tea Revenue (USD Million) By Product (2021-2032)
Table 20 Europe Flower and Fruit Tea Revenue (USD Million) By Type (2021-2032)
Table 21 Europe Flower and Fruit Tea Revenue (USD Million) By Application (2021-2032)
Table 22 Europe Flower and Fruit Tea Revenue (USD Million) By Product (2021-2032)
Table 23 Asia Pacific Flower and Fruit Tea Revenue (USD Million) By Type (2021-2032)
Table 24 Asia Pacific Flower and Fruit Tea Revenue (USD Million) By Application (2021-2032)
Table 25 Asia Pacific Flower and Fruit Tea Revenue (USD Million) By Product (2021-2032)
Table 26 South America Flower and Fruit Tea Revenue (USD Million) By Type (2021-2032)
Table 27 South America Flower and Fruit Tea Revenue (USD Million) By Application (2021-2032)
Table 28 South America Flower and Fruit Tea Revenue (USD Million) By Product (2021-2032)
Table 29 Middle East and Africa Flower and Fruit Tea Revenue (USD Million) By Type (2021-2032)
Table 30 Middle East and Africa Flower and Fruit Tea Revenue (USD Million) By Application (2021-2032)
Table 31 Middle East and Africa Flower and Fruit Tea Revenue (USD Million) By Product (2021-2032)
LIST OF FIGURES
Figure 1. Market Scope
Figure 2. Pricing Forecasts Per Unit, 2023- 2032
Figure 3. Porter’s Five Forces
Figure 4. Global Flower and Fruit Tea Market Revenue (USD Million) By Regions (2021-2032)
Figure 5. Global Flower and Fruit Tea Market Share (%) By Regions (2023)
Figure 6. North America Flower and Fruit Tea Revenue (USD Million) By Country (2021-2032)
Figure 7. United States Flower and Fruit Tea Revenue (USD Million) By Country (2021-2032)
Figure 8. Canada Flower and Fruit Tea Revenue (USD Million) By Country (2021-2032)
Figure 9. Mexico Flower and Fruit Tea Revenue (USD Million) By Country (2021-2032)
Figure 10. Europe Flower and Fruit Tea Revenue (USD Million) By Country (2021-2032)
Figure 11. Germany Flower and Fruit Tea Revenue (USD Million) By Country (2021-2032)
Figure 12. France Flower and Fruit Tea Revenue (USD Million) By Country (2021-2032)
Figure 13. United Kingdom Flower and Fruit Tea Revenue (USD Million) By Country (2021-2032)
Figure 14. Spain Flower and Fruit Tea Revenue (USD Million) By Country (2021-2032)
Figure 15. Italy Flower and Fruit Tea Revenue (USD Million) By Country (2021-2032)
Figure 16. Russia Flower and Fruit Tea Revenue (USD Million) By Country (2021-2032)
Figure 17. Rest of Europe Flower and Fruit Tea Revenue (USD Million) By Country (2021-2032)
Figure 11. Asia Pacific Flower and Fruit Tea Revenue (USD Million) By Country (2021-2032)
Figure 12. China Flower and Fruit Tea Revenue (USD Million) By Country (2021-2032)
Figure 13. Japan Flower and Fruit Tea Revenue (USD Million) By Country (2021-2032)
Figure 14. India Flower and Fruit Tea Revenue (USD Million) By Country (2021-2032)
Figure 15. South Korea Flower and Fruit Tea Revenue (USD Million) By Country (2021-2032)
Figure 16. Australia Flower and Fruit Tea Revenue (USD Million) By Country (2021-2032)
Figure 17. South East Asia Flower and Fruit Tea Revenue (USD Million) By Country (2021-2032)
Figure 18. South America Flower and Fruit Tea Revenue (USD Million) By Country (2021-2032)
Figure 19. Brazil Flower and Fruit Tea Revenue (USD Million) By Country (2021-2032)
Figure 20. Argentina Flower and Fruit Tea Revenue (USD Million) By Country (2021-2032)
Figure 21. Rest of Asia Pacific Flower and Fruit Tea Revenue (USD Million) By Country (2021-2032)
Figure 22. Middle East and Africa Flower and Fruit Tea Revenue (USD Million) By Region (2021-2032)
Figure 23. Saudi Arabia Flower and Fruit Tea Revenue (USD Million) By Region (2021-2032)
Figure 24. The UAE Flower and Fruit Tea Revenue (USD Million) By Region (2021-2032)
Figure 25. Rest of Middle East Flower and Fruit Tea Revenue (USD Million) By Region (2021-2032)
Figure 26. South Africa Flower and Fruit Tea Revenue (USD Million) By Region (2021-2032)
Figure 27. Africa Flower and Fruit Tea Revenue (USD Million) By Region (2021-2032)
Figure 28. North America Flower and Fruit Tea Revenue (USD Million) By Type (2021-2032)
Figure 29. North America Flower and Fruit Tea Revenue (USD Million) By Application (2021-2032)
Figure 30. North America Flower and Fruit Tea Revenue (USD Million) By Product (2021-2032)
Figure 31. Europe Flower and Fruit Tea Revenue (USD Million) By Type (2021-2032)
Figure 32. Europe Flower and Fruit Tea Revenue (USD Million) By Application (2021-2032)
Figure 33. Europe Flower and Fruit Tea Revenue (USD Million) By Product (2021-2032)
Figure 34. Asia Pacific Flower and Fruit Tea Revenue (USD Million) By Type (2021-2032)
Figure 35. Asia Pacific Flower and Fruit Tea Revenue (USD Million) By Application (2021-2032)
Figure 36. Asia Pacific Flower and Fruit Tea Revenue (USD Million) By Product (2021-2032)
Figure 37. South America Flower and Fruit Tea Revenue (USD Million) By Type (2021-2032)
Figure 38. South America Flower and Fruit Tea Revenue (USD Million) By Application (2021-2032)
Figure 39. South America Flower and Fruit Tea Revenue (USD Million) By Product (2021-2032)
Figure 40. Middle East and Africa Flower and Fruit Tea Revenue (USD Million) By Type (2021-2032)
Figure 41. Middle East and Africa Flower and Fruit Tea Revenue (USD Million) By Application (2021-2032)
Figure 42. Middle East and Africa Flower and Fruit Tea Revenue (USD Million) By Product (2021-2032)
By Type
Loose Package
Individual Package
By Application
Online
Offline
By floral Source
Chamomile
Calendula
Rose
Blue Lotus
Hibiscus
Chrysanthemum
Rooibos
Others
By Product
Traditional
Unsweetened
Sweetened
Flavored
Countries Analyzed
North America (US, Canada, Mexico)
Europe (Germany, UK, France, Spain, Italy, Russia, Rest of Europe)
Asia Pacific (China, India, Japan, South Korea, Australia, South East Asia, Rest of Asia)
South America (Brazil, Argentina, Rest of South America)
Middle East and Africa (Saudi Arabia, UAE, Rest of Middle East, South Africa, Egypt, Rest of Africa)
