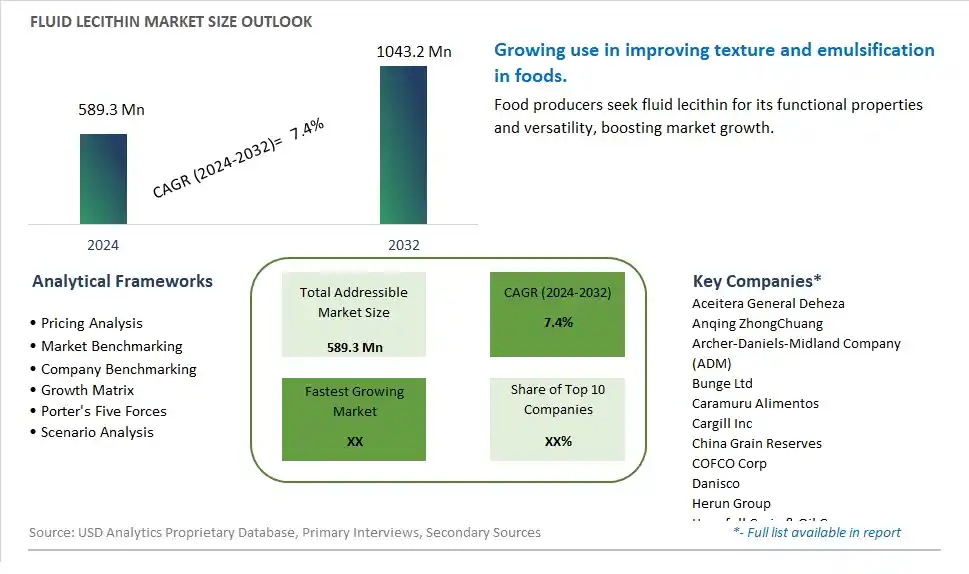
Global Fluid Lecithin Market Size is valued at $589.3 Million in 2024 and is forecast to register a growth rate (CAGR) of 7.4% to reach $1043.2 Million by 2032.
The global Fluid Lecithin Market Comprehensive Study analyzes and forecasts the market size across 6 regions and 24 countries for diverse segments -By Type (GMO Soy, GMO Sunflower, GMO Rapeseed, Non-GMO Soy, Non-GMO Sunflower, Non-GMO Rapeseed, Others), By Application (Feed, Food and Beverage, Healthcare & Pharmaceutical, Others)
An Introduction to Fluid Lecithin Market
The Fluid Lecithin market in 2024 is experiencing significant growth, driven by the increasing demand for versatile and natural emulsifiers in the food, pharmaceutical, and cosmetic industries. Fluid lecithin, derived from soybeans, sunflower seeds, or eggs, is used to improve the texture, stability, and shelf life of various products. The market benefits from advancements in lecithin extraction and processing technologies, the growing trend of clean label and natural ingredients, and the expansion of the functional food and nutraceutical sectors. Additionally, the rising awareness of the benefits of lecithin for health and product formulation is contributing to market growth.
Fluid Lecithin Competitive Landscape
The market report analyses the leading companies in the industry including Aceitera General Deheza, Anqing ZhongChuang, Archer-Daniels-Midland Company (ADM), Bunge Ltd, Caramuru Alimentos, Cargill Inc, China Grain Reserves, COFCO Corp, Danisco, Herun Group, Hopefull Grain & Oil Group, Jiusan Group, Lipoid GmbH, Louis Dreyfus, Molinos Agro, Renova, Ruchi Soya, Shandong Bohi, Shankar Soya Concepts, Wilmar International Ltd, and Others.
Fluid Lecithin Market Dynamics
Fluid Lecithin Market Trend: Shift Towards Clean Label and Natural Ingredients
One prominent trend in the fluid lecithin market is the industry-wide shift towards clean label and natural ingredients. Consumers and food manufacturers alike are increasingly prioritizing products that are free from artificial additives, preservatives, and chemicals. Fluid lecithin, derived from natural sources such as soybeans, sunflower seeds, or rapeseed, aligns with this trend due to its clean label profile and versatile functionality as an emulsifier and stabilizer in various food and beverage applications. This trend reflects the growing demand for transparency, sustainability, and health-conscious choices in the food industry, driving the adoption of fluid lecithin as a preferred ingredient in clean label formulations.
Fluid Lecithin Market Driver: Functional Properties and Versatility in Food Processing
A key driver propelling the fluid lecithin market is its functional properties and versatility in food processing. Fluid lecithin serves as an effective emulsifier, dispersant, and viscosity modifier, enhancing texture, stability, and shelf life in a wide range of food products such as bakery goods, confectionery, dairy alternatives, sauces, dressings, and nutritional supplements. Its ability to improve product uniformity, aid in fat dispersion, and contribute to creamy textures makes it a valuable ingredient for food manufacturers seeking consistent quality and sensory appeal in their formulations. This driver underscores the importance of ingredient functionality, performance, and application flexibility in driving the widespread adoption of fluid lecithin across diverse food segments.
Fluid Lecithin Market Opportunity: Expansion into Clean Label and Functional Food Solutions
A significant opportunity in the fluid lecithin market lies in expanding its applications into clean label and functional food solutions. Manufacturers can capitalize on this opportunity by promoting fluid lecithin as a natural, clean label alternative to synthetic emulsifiers and stabilizers, appealing to health-conscious consumers and clean label product trends. Additionally, there's potential for developing specialized fluid lecithin variants with enhanced functional properties, such as low viscosity options for easier handling in food processing, allergen-free formulations for sensitive consumer groups, or fortified lecithin with added nutritional benefits. By leveraging its functional benefits, natural origin, and adaptability to diverse food formulations, fluid lecithin can further penetrate the market and offer innovative solutions to meet evolving consumer demands for clean label, healthy, and functional food products.
Fluid Lecithin Market Share Analysis: GMO Soy Lecithin segment generated the highest revenue share in the industry
In the Fluid Lecithin Market segmented by type, GMO Soy Lecithin emerges as the largest segment. This dominance can be attributed to the widespread use of genetically modified soybeans in industrial processing, particularly for their high lecithin content. GMO soy lecithin is valued for its emulsifying properties, which find extensive applications across various industries, including food and beverage, pharmaceuticals, cosmetics, and animal feed. Its versatility and cost-effectiveness make it a preferred choice for manufacturers seeking stable emulsions, improved texture, and extended shelf life in their products. The industrial-scale cultivation and processing of GMO soybeans also contribute to the availability and affordability of soy lecithin in global markets, solidifying its position as the largest segment in the fluid lecithin market.
Fluid Lecithin Market Share Analysis: Healthcare & Pharmaceutical Application is the fastest growing segment over the forecast period to 2032
The Fluid Lecithin Market segmented by application highlights Healthcare & Pharmaceutical as the fastest growing segment leading up to 2032. This growth is driven by increasing awareness and utilization of lecithin's health benefits in pharmaceutical formulations and healthcare products. Lecithin is recognized for its role as a natural emulsifier and its ability to improve absorption of nutrients and active ingredients in pharmaceutical preparations. Further, its use in healthcare supplements, dietary supplements, and infant nutrition contributes to its rapid adoption in the healthcare sector. As consumer preferences shift towards natural and functional ingredients, lecithin's presence in health-oriented products continues to expand, propelling the healthcare and pharmaceutical application segment to significant growth in the fluid lecithin market.
Fluid Lecithin Market Segmentation
By Type
GMO Soy
GMO Sunflower
GMO Rapeseed
Non-GMO Soy
Non-GMO Sunflower
Non-GMO Rapeseed
Others
By Application
Feed
Food and Beverage
Healthcare & Pharmaceutical
Others
Countries Analyzed
North America (US, Canada, Mexico)
Europe (Germany, UK, France, Spain, Italy, Russia, Rest of Europe)
Asia Pacific (China, India, Japan, South Korea, Australia, South East Asia, Rest of Asia)
South America (Brazil, Argentina, Rest of South America)
Middle East and Africa (Saudi Arabia, UAE, Rest of Middle East, South Africa, Egypt, Rest of Africa)
Fluid Lecithin Companies Profiled in the Study
Aceitera General Deheza
Anqing ZhongChuang
Archer-Daniels-Midland Company (ADM)
Bunge Ltd
Caramuru Alimentos
Cargill Inc
China Grain Reserves
COFCO Corp
Danisco
Herun Group
Hopefull Grain & Oil Group
Jiusan Group
Lipoid GmbH
Louis Dreyfus
Molinos Agro
Renova
Ruchi Soya
Shandong Bohi
Shankar Soya Concepts
Wilmar International Ltd
*- List Not Exhaustive
Chapter 1. TABLE OF CONTENTS
Chapter 2. Introduction to Fluid Lecithin Market
2.1. Market Overview
2.2. Key Statistics and Report Highlights
2.3. Scope of the Comprehensive Study
2.3.1. Market Definition
2.3.2 Countries and Regions Covered
2.3.3 Research Objective
2.3.4 Units, Currency, and Conversions
2.3.5 Industry Value Chain
2.4. Key Market Segments
2.5. Key Companies
2.6. Study Period
Chapter 3. Strategic Analysis Review
3.1. Fluid Lecithin Pricing Analysis and Forecast
3.2. Porter’s Five Forces
3.3. Market Ecosystem
3.4. SWOT Analysis
3.5. Regulatory Scenario
3.3. Effects of Inflation, Russia-Ukraine War, moderating economic growth, and other macroeconomic factors
Chapter 4. Competitive Landscape
4.1. Market Share Analysis
4.1.1. Global Fluid Lecithin Market Share by Company, 2023
4.1.2. Product Offerings of Leading Fluid Lecithin Companies
4.2. Market Entropy
4.2.1. New Product Launches in the Industry
4.2.2. Mergers, Acquisitions, Joint ventures, and Partnerships
4.3. Key Strategies and Best Practices
Chapter 5. Global Market Projections: Best, Reference, and Low Case Scenarios
5.1. Growth Analysis- Case Scenario Definitions
5.2. Low Growth Case Scenario Forecasts
5.3. Reference Growth Case Scenario Forecasts
5.4. High Growth Case Scenario Forecasts
Chapter 6. Market Dynamics
6.1. Fluid Lecithin Market Drivers
6.2. Fluid Lecithin Market Challenges
6.6. Fluid Lecithin Market Opportunities
6.4. Fluid Lecithin Market Trends
Chapter 7. Global Fluid Lecithin Market Outlook Trends
7.1. Global Fluid Lecithin Revenue (USD Million) and CAGR (%) by Type (2021-2032)
7.2. Global Fluid Lecithin Revenue (USD Million) and CAGR (%) by Application (2021-2032)
7.3. Global Fluid Lecithin Revenue (USD Million) and CAGR (%) by Product (2021-2032)
By Type
GMO Soy
GMO Sunflower
GMO Rapeseed
Non-GMO Soy
Non-GMO Sunflower
Non-GMO Rapeseed
Others
By Application
Feed
Food and Beverage
Healthcare & Pharmaceutical
Others
Chapter 8. Global Fluid Lecithin Regional Analysis and Outlook
8.1. Global Fluid Lecithin Revenue (USD Million) By Regions (2021- 2032)
8.2. North America Fluid Lecithin Revenue (USD Million) by Country (2021-2032)
8.2.1. United States Fluid Lecithin Regional Analysis and Outlook
8.2.2. Canada Fluid Lecithin Regional Analysis and Outlook
8.2.3. Mexico Fluid Lecithin Regional Analysis and Outlook
8.3. Europe Fluid Lecithin Revenue (USD Million), by Country (2021-2032)
8.3.1. Germany Fluid Lecithin Regional Analysis and Outlook
8.3.2. France Fluid Lecithin Regional Analysis and Outlook
8.3.3. United Kingdom Fluid Lecithin Regional Analysis and Outlook
8.3.4. Spain Fluid Lecithin Regional Analysis and Outlook
8.3.5. Italy Fluid Lecithin Regional Analysis and Outlook
8.3.6. Russia Fluid Lecithin Regional Analysis and Outlook
8.3.7. Rest of Europe Fluid Lecithin Regional Analysis and Outlook
8.4. Asia Pacific Fluid Lecithin Revenue (USD Million) by Country (2021-2032)
8.4.1. China Fluid Lecithin Regional Analysis and Outlook
8.4.2. Japan Fluid Lecithin Regional Analysis and Outlook
8.4.3. India Fluid Lecithin Regional Analysis and Outlook
8.4.4. South Korea Fluid Lecithin Regional Analysis and Outlook
8.4.5. Australia Fluid Lecithin Regional Analysis and Outlook
8.4.6. South East Asia Fluid Lecithin Regional Analysis and Outlook
8.4.7. Rest of Asia Pacific Fluid Lecithin Regional Analysis and Outlook
8.5. South America Fluid Lecithin Revenue (USD Million), by Country (2021-2032)
8.5.1. Brazil Fluid Lecithin Regional Analysis and Outlook
8.5.2. Argentina Fluid Lecithin Regional Analysis and Outlook
8.5.3. Rest of South America Fluid Lecithin Regional Analysis and Outlook
8.6. Middle East and Africa Fluid Lecithin Revenue (USD Million) by Country (2021-2032)
8.6.1. Middle East Fluid Lecithin Regional Analysis and Outlook
8.6.2. Africa Fluid Lecithin Regional Analysis and Outlook
Chapter 9. North America Fluid Lecithin Analysis and Outlook
9.1. North America Fluid Lecithin Revenue (USD Million) by Segments (2021-2032)
9.1.1. North America Fluid Lecithin Revenue (USD Million) by Type (2021-2032)
9.1.2. North America Fluid Lecithin Revenue (USD Million) by Application (2021-2032)
9.1.3. North America Fluid Lecithin Revenue (USD Million) by Product (2021-2032)
By Type
GMO Soy
GMO Sunflower
GMO Rapeseed
Non-GMO Soy
Non-GMO Sunflower
Non-GMO Rapeseed
Others
By Application
Feed
Food and Beverage
Healthcare & Pharmaceutical
Others
Chapter 10. Europe Fluid Lecithin Analysis and Outlook
10.1. Europe Fluid Lecithin Revenue (USD Million), by Segments (USD Million) (2021-2032)
10.1.1. Europe Fluid Lecithin Revenue (USD Million) by Type (2021-2032)
10.1.2. Europe Fluid Lecithin Revenue (USD Million) by Application (2021-2032)
10.1.3. Europe Fluid Lecithin Revenue (USD Million) by Product (2021-2032)
By Type
GMO Soy
GMO Sunflower
GMO Rapeseed
Non-GMO Soy
Non-GMO Sunflower
Non-GMO Rapeseed
Others
By Application
Feed
Food and Beverage
Healthcare & Pharmaceutical
Others
Chapter 11. Asia Pacific Fluid Lecithin Analysis and Outlook
11.1. Asia Pacific Fluid Lecithin Revenue (USD Million), and Revenue (USD Million) by Segments (2021-2032)
11.1.1. Asia Pacific Fluid Lecithin Revenue (USD Million) by Type (2021-2032)
11.1.2. Asia Pacific Fluid Lecithin Revenue (USD Million) by Application (2021-2032)
11.1.3. Asia Pacific Fluid Lecithin Revenue (USD Million) by Product (2021-2032)
By Type
GMO Soy
GMO Sunflower
GMO Rapeseed
Non-GMO Soy
Non-GMO Sunflower
Non-GMO Rapeseed
Others
By Application
Feed
Food and Beverage
Healthcare & Pharmaceutical
Others
Chapter 12. South America Fluid Lecithin Analysis and Outlook
12.1. South America Fluid Lecithin Revenue (USD Million), by Segments (2021-2032)
12.1.1. South America Fluid Lecithin Revenue (USD Million) by Type (2021-2032)
12.1.2. South America Fluid Lecithin Revenue (USD Million) by Application (2021-2032)
12.1.3. South America Fluid Lecithin Revenue (USD Million) by Product (2021-2032)
By Type
GMO Soy
GMO Sunflower
GMO Rapeseed
Non-GMO Soy
Non-GMO Sunflower
Non-GMO Rapeseed
Others
By Application
Feed
Food and Beverage
Healthcare & Pharmaceutical
Others
Chapter 13. Middle East and Africa Fluid Lecithin Analysis and Outlook
13.1. Middle East and Africa Fluid Lecithin Revenue (USD Million), by Segments (2021-2032)
13.1.1. Middle East and Africa Fluid Lecithin Revenue (USD Million) by Type (2021-2032)
13.1.2. Middle East and Africa Fluid Lecithin Revenue (USD Million) by Application (2021-2032)
13.1.3. Middle East and Africa Fluid Lecithin Revenue (USD Million) by Product (2021-2032)
By Type
GMO Soy
GMO Sunflower
GMO Rapeseed
Non-GMO Soy
Non-GMO Sunflower
Non-GMO Rapeseed
Others
By Application
Feed
Food and Beverage
Healthcare & Pharmaceutical
Others
Chapter 14. Fluid Lecithin Company Profiles
14.1 Business Overview
14.2 Product Profiles
14.3 SWOT Profiles
14.5 Recent Developments
14.6 Financial Profile
List of Companies
Aceitera General Deheza
Anqing ZhongChuang
Archer-Daniels-Midland Company (ADM)
Bunge Ltd
Caramuru Alimentos
Cargill Inc
China Grain Reserves
COFCO Corp
Danisco
Herun Group
Hopefull Grain & Oil Group
Jiusan Group
Lipoid GmbH
Louis Dreyfus
Molinos Agro
Renova
Ruchi Soya
Shandong Bohi
Shankar Soya Concepts
Wilmar International Ltd
15. Methodology and Data Sources
15.1 Customization Offerings
15.2 Subscription Services
15.3 Related Reports
15.4 Publisher Expertise
LIST OF TABLES
Table 1 Market Segmentation Analysis
Table 2 Global Fluid Lecithin Market Share of Leading Companies, 2023
Table 3 Product Offerings of Leading Companies
Table 4 Low Growth Scenario Forecasts
Table 5 Reference Case Growth Scenario
Table 6 High Growth Case Scenario
Table 7 Global Fluid Lecithin Revenue (USD Million) And CAGR (%) By Type (2021-2032)
Table 8 Global Fluid Lecithin Revenue (USD Million) And CAGR (%) By Application (2021-2032)
Table 9 Global Fluid Lecithin Revenue (USD Million) And CAGR (%) By Product (2021-2032)
Table 10 Global Fluid Lecithin Market Revenue (USD Million) By Regions (2021-2032)
Table 11 Global Fluid Lecithin Market Share (%) By Regions (2021-2032)
Table 12 North America Fluid Lecithin Revenue (USD Million) By Country (2021-2032)
Table 13 Europe Fluid Lecithin Revenue (USD Million) By Country (2021-2032)
Table 14 Asia Pacific Fluid Lecithin Revenue (USD Million) By Country (2021-2032)
Table 15 South America Fluid Lecithin Revenue (USD Million) By Country (2021-2032)
Table 16 Middle East and Africa Fluid Lecithin Revenue (USD Million) By Region (2021-2032)
Table 17 North America Fluid Lecithin Revenue (USD Million) By Type (2021-2032)
Table 18 North America Fluid Lecithin Revenue (USD Million) By Application (2021-2032)
Table 19 North America Fluid Lecithin Revenue (USD Million) By Product (2021-2032)
Table 20 Europe Fluid Lecithin Revenue (USD Million) By Type (2021-2032)
Table 21 Europe Fluid Lecithin Revenue (USD Million) By Application (2021-2032)
Table 22 Europe Fluid Lecithin Revenue (USD Million) By Product (2021-2032)
Table 23 Asia Pacific Fluid Lecithin Revenue (USD Million) By Type (2021-2032)
Table 24 Asia Pacific Fluid Lecithin Revenue (USD Million) By Application (2021-2032)
Table 25 Asia Pacific Fluid Lecithin Revenue (USD Million) By Product (2021-2032)
Table 26 South America Fluid Lecithin Revenue (USD Million) By Type (2021-2032)
Table 27 South America Fluid Lecithin Revenue (USD Million) By Application (2021-2032)
Table 28 South America Fluid Lecithin Revenue (USD Million) By Product (2021-2032)
Table 29 Middle East and Africa Fluid Lecithin Revenue (USD Million) By Type (2021-2032)
Table 30 Middle East and Africa Fluid Lecithin Revenue (USD Million) By Application (2021-2032)
Table 31 Middle East and Africa Fluid Lecithin Revenue (USD Million) By Product (2021-2032)
LIST OF FIGURES
Figure 1. Market Scope
Figure 2. Pricing Forecasts Per Unit, 2023- 2032
Figure 3. Porter’s Five Forces
Figure 4. Global Fluid Lecithin Market Revenue (USD Million) By Regions (2021-2032)
Figure 5. Global Fluid Lecithin Market Share (%) By Regions (2023)
Figure 6. North America Fluid Lecithin Revenue (USD Million) By Country (2021-2032)
Figure 7. United States Fluid Lecithin Revenue (USD Million) By Country (2021-2032)
Figure 8. Canada Fluid Lecithin Revenue (USD Million) By Country (2021-2032)
Figure 9. Mexico Fluid Lecithin Revenue (USD Million) By Country (2021-2032)
Figure 10. Europe Fluid Lecithin Revenue (USD Million) By Country (2021-2032)
Figure 11. Germany Fluid Lecithin Revenue (USD Million) By Country (2021-2032)
Figure 12. France Fluid Lecithin Revenue (USD Million) By Country (2021-2032)
Figure 13. United Kingdom Fluid Lecithin Revenue (USD Million) By Country (2021-2032)
Figure 14. Spain Fluid Lecithin Revenue (USD Million) By Country (2021-2032)
Figure 15. Italy Fluid Lecithin Revenue (USD Million) By Country (2021-2032)
Figure 16. Russia Fluid Lecithin Revenue (USD Million) By Country (2021-2032)
Figure 17. Rest of Europe Fluid Lecithin Revenue (USD Million) By Country (2021-2032)
Figure 11. Asia Pacific Fluid Lecithin Revenue (USD Million) By Country (2021-2032)
Figure 12. China Fluid Lecithin Revenue (USD Million) By Country (2021-2032)
Figure 13. Japan Fluid Lecithin Revenue (USD Million) By Country (2021-2032)
Figure 14. India Fluid Lecithin Revenue (USD Million) By Country (2021-2032)
Figure 15. South Korea Fluid Lecithin Revenue (USD Million) By Country (2021-2032)
Figure 16. Australia Fluid Lecithin Revenue (USD Million) By Country (2021-2032)
Figure 17. South East Asia Fluid Lecithin Revenue (USD Million) By Country (2021-2032)
Figure 18. South America Fluid Lecithin Revenue (USD Million) By Country (2021-2032)
Figure 19. Brazil Fluid Lecithin Revenue (USD Million) By Country (2021-2032)
Figure 20. Argentina Fluid Lecithin Revenue (USD Million) By Country (2021-2032)
Figure 21. Rest of Asia Pacific Fluid Lecithin Revenue (USD Million) By Country (2021-2032)
Figure 22. Middle East and Africa Fluid Lecithin Revenue (USD Million) By Region (2021-2032)
Figure 23. Saudi Arabia Fluid Lecithin Revenue (USD Million) By Region (2021-2032)
Figure 24. The UAE Fluid Lecithin Revenue (USD Million) By Region (2021-2032)
Figure 25. Rest of Middle East Fluid Lecithin Revenue (USD Million) By Region (2021-2032)
Figure 26. South Africa Fluid Lecithin Revenue (USD Million) By Region (2021-2032)
Figure 27. Africa Fluid Lecithin Revenue (USD Million) By Region (2021-2032)
Figure 28. North America Fluid Lecithin Revenue (USD Million) By Type (2021-2032)
Figure 29. North America Fluid Lecithin Revenue (USD Million) By Application (2021-2032)
Figure 30. North America Fluid Lecithin Revenue (USD Million) By Product (2021-2032)
Figure 31. Europe Fluid Lecithin Revenue (USD Million) By Type (2021-2032)
Figure 32. Europe Fluid Lecithin Revenue (USD Million) By Application (2021-2032)
Figure 33. Europe Fluid Lecithin Revenue (USD Million) By Product (2021-2032)
Figure 34. Asia Pacific Fluid Lecithin Revenue (USD Million) By Type (2021-2032)
Figure 35. Asia Pacific Fluid Lecithin Revenue (USD Million) By Application (2021-2032)
Figure 36. Asia Pacific Fluid Lecithin Revenue (USD Million) By Product (2021-2032)
Figure 37. South America Fluid Lecithin Revenue (USD Million) By Type (2021-2032)
Figure 38. South America Fluid Lecithin Revenue (USD Million) By Application (2021-2032)
Figure 39. South America Fluid Lecithin Revenue (USD Million) By Product (2021-2032)
Figure 40. Middle East and Africa Fluid Lecithin Revenue (USD Million) By Type (2021-2032)
Figure 41. Middle East and Africa Fluid Lecithin Revenue (USD Million) By Application (2021-2032)
Figure 42. Middle East and Africa Fluid Lecithin Revenue (USD Million) By Product (2021-2032)
By Type
GMO Soy
GMO Sunflower
GMO Rapeseed
Non-GMO Soy
Non-GMO Sunflower
Non-GMO Rapeseed
Others
By Application
Feed
Food and Beverage
Healthcare & Pharmaceutical
Others
Countries Analyzed
North America (US, Canada, Mexico)
Europe (Germany, UK, France, Spain, Italy, Russia, Rest of Europe)
Asia Pacific (China, India, Japan, South Korea, Australia, South East Asia, Rest of Asia)
South America (Brazil, Argentina, Rest of South America)
Middle East and Africa (Saudi Arabia, UAE, Rest of Middle East, South Africa, Egypt, Rest of Africa)
