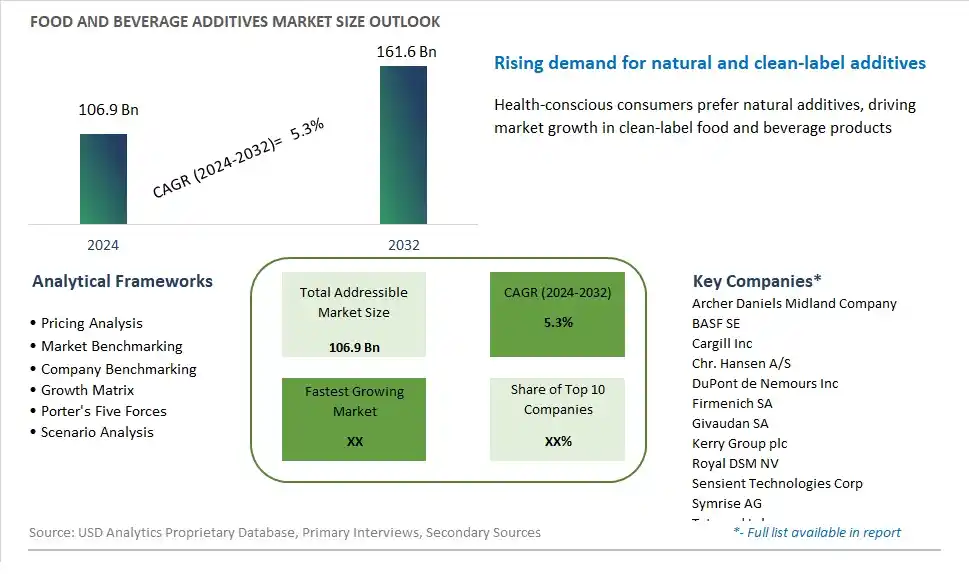
Global Food and Beverage Additives Market Size is valued at $121.8 Billion in 2024 and is forecast to register a growth rate (CAGR) of 5.7% to reach $189.8 Billion by 2032.
The global Food and Beverage Additives Market Comprehensive Study analyzes and forecasts the market size across 6 regions and 24 countries for diverse segments -By Product (Acidulants, Anti-caking Agents, Colors, Emulsifiers, Flavors, Sweeteners, Preservatives, Others), By Source (Natural, Synthetic), By Distribution Channel (Hypermarkets/Supermarkets, Convenience Stores, Online Retail, Others), By Application (Bakery & Confectionary, Beverages, Dairy, Frozen Foods, Others)
An Introduction to Food and Beverage Additives Market
In 2024, the Food and Beverage Additives market is experiencing significant growth, driven by the increasing demand for additives that enhance the taste, texture, and shelf life of food and beverages. Additives such as preservatives, flavor enhancers, colorants, and emulsifiers are widely used in various food and beverage applications. The market benefits from advancements in additive formulation and regulatory approvals, the growing trend of convenience and processed foods, and the expansion of the global food and beverage sector. Additionally, the rising focus on clean label and natural additives is contributing to market growth.
Food and Beverage Additives Competitive Landscape
The market report analyses the leading companies in the industry including Archer Daniels Midland Company (ADM), BASF SE, Cargill Inc, Evonik Industries AG, Ingredion Inc, Kerry Group Plc, Novozymes A/S, Tate & Lyle PLC, and Others.
Food and Beverage Additives Market Dynamics
Food and Beverage Additives Market Trend: Shift Towards Clean Label and Natural Ingredients
One prominent trend in the food and beverage additives market is the industry-wide shift towards clean label and natural ingredients. Consumers are increasingly seeking food products with transparent ingredient lists, free from artificial additives, preservatives, and synthetic chemicals. This trend is driven by a growing awareness of health and wellness, sustainability concerns, and the desire for wholesome, minimally processed foods. Manufacturers are responding by reformulating their additives using natural sources such as plant extracts, fermentation processes, and bio-based materials, aligning with clean label trends and meeting consumer preferences for clean, recognizable ingredients in their food and beverage choices.
Food and Beverage Additives Market Driver: Demand for Functional and Innovative Food Solutions
A key driver propelling the food and beverage additives market is the demand for functional and innovative food solutions that enhance taste, texture, shelf life, and nutritional value. Additives play a crucial role in food processing, product formulation, and sensory optimization, providing functionalities such as emulsification, stabilization, color enhancement, flavor enhancement, and preservation. The driver behind this demand is consumer expectations for high-quality, convenient, and enjoyable food experiences, driving manufacturers to invest in research and development to create additives that meet evolving consumer needs, address industry challenges, and drive product differentiation in competitive markets.
Food and Beverage Additives Market Opportunity: Development of Clean Label Functional Additives
A significant opportunity in the food and beverage additives market lies in the development of clean label functional additives that combine functionality with natural and clean label attributes. Manufacturers can capitalize on this opportunity by innovating additives that offer multiple functionalities while maintaining clean label status, such as natural emulsifiers, plant-based stabilizers, antioxidant-rich preservatives, and flavor enhancers derived from natural sources. Additionally, there's potential for additives that target specific health and wellness trends, such as probiotic additives for gut health, plant-based protein fortifiers, and natural colorants with health benefits. By focusing on clean label innovation, functionality, and meeting consumer demand for natural, healthy food options, companies can unlock new opportunities for growth and market expansion in the dynamic food and beverage additives sector.
Food and Beverage Additives Market Share Analysis: Flavors segment generated the highest revenue share in the industry
In the Food and Beverage Additives Market, segmented by product type, Flavors emerge as the largest segment. Flavors play a pivotal role in enhancing the sensory appeal of food and beverage products, catering to diverse consumer preferences and market demands. They are widely used across various categories, including beverages, dairy products, confectionery, snacks, and processed foods, to impart specific tastes and aromas. Flavors can range from natural extracts derived from fruits, herbs, and spices to synthetic compounds formulated to mimic natural flavors. Their versatility allows food manufacturers to innovate and differentiate their products in a competitive market landscape. With consumer expectations leaning towards novel taste experiences and cleaner label declarations, the demand for diverse and high-quality flavors continues to drive growth in the additives sector.
Food and Beverage Additives Market Share Analysis: Natural Sources is the fastest growing segment over the forecast period to 2032
Among the sources in the Food and Beverage Additives Market, the segment focusing on Natural Sources is identified as the fastest growing to 2032. This trend is driven by increasing consumer awareness and preference for natural ingredients due to health and wellness concerns. Natural additives, derived from plants, animals, or minerals, are perceived as safer alternatives to synthetic counterparts, aligning with clean label trends and sustainability practices. They offer food manufacturers the opportunity to meet consumer demand for transparency and authenticity in product formulations. Regulatory support for natural additives further bolsters market growth, encouraging innovation in sourcing, extraction methods, and application technologies. As the industry continues to prioritize natural solutions that balance sensory enhancement with nutritional integrity, the natural sources segment is poised for significant expansion across global food and beverage markets.
Food and Beverage Additives Market Share Analysis: Hypermarkets/Supermarkets segment generated the highest revenue share in the industry
In the Food and Beverage Additives Market, segmented by distribution channel, Hypermarkets/Supermarkets stand out as the largest segment. These retail channels serve as key points of sale for a wide range of food and beverage products, including additives. Hypermarkets and supermarkets offer extensive shelf space, enabling them to stock a diverse array of additives catering to both consumer and industrial needs. They provide convenience and accessibility to a broad customer base, from individual consumers purchasing for household use to food manufacturers sourcing ingredients in bulk quantities. The prominence of hypermarkets and supermarkets in urban and suburban areas contributes significantly to the distribution and sales volume of food and beverage additives globally.
Food and Beverage Additives Market Share Analysis: Bakery & Confectionary is the fastest growing segment over the forecast period to 2032
Among the applications in the Food and Beverage Additives Market, the segment focused on Bakery & Confectionary is identified as the fastest growing to 2032. This growth is driven by evolving consumer preferences for indulgent and innovative bakery products and confectioneries that offer unique flavors, textures, and extended shelf life. Additives play a crucial role in enhancing product quality, improving texture, ensuring freshness, and extending shelf stability, all while maintaining sensory appeal. The bakery and confectionery sector benefits from ongoing research and development efforts aimed at introducing natural and clean label additives that meet regulatory standards and consumer expectations for healthier options. As consumer demand for diverse and premium bakery and confectionery products continues to rise globally, so does the adoption of food and beverage additives tailored for these applications.
Food and Beverage Additives Market Segmentation
By Product
Acidulants
Anti-caking Agents
Colors
Emulsifiers
Flavors
Sweeteners
Preservatives
Others
By Source
Natural
Synthetic
By Distribution Channel
Hypermarkets/Supermarkets
Convenience Stores
Online Retail
Others
By Application
Bakery & Confectionary
Beverages
Dairy
Frozen Foods
Others
Countries Analyzed
North America (US, Canada, Mexico)
Europe (Germany, UK, France, Spain, Italy, Russia, Rest of Europe)
Asia Pacific (China, India, Japan, South Korea, Australia, South East Asia, Rest of Asia)
South America (Brazil, Argentina, Rest of South America)
Middle East and Africa (Saudi Arabia, UAE, Rest of Middle East, South Africa, Egypt, Rest of Africa)
Food and Beverage Additives Companies Profiled in the Study
Archer Daniels Midland Company (ADM)
BASF SE
Cargill Inc
Evonik Industries AG
Ingredion Inc
Kerry Group Plc
Novozymes A/S
Tate & Lyle PLC
*- List Not Exhaustive
Chapter 1. TABLE OF CONTENTS
Chapter 2. Introduction to Food and Beverage Additives Market
2.1. Market Overview
2.2. Key Statistics and Report Highlights
2.3. Scope of the Comprehensive Study
2.3.1. Market Definition
2.3.2 Countries and Regions Covered
2.3.3 Research Objective
2.3.4 Units, Currency, and Conversions
2.3.5 Industry Value Chain
2.4. Key Market Segments
2.5. Key Companies
2.6. Study Period
Chapter 3. Strategic Analysis Review
3.1. Food and Beverage Additives Pricing Analysis and Forecast
3.2. Porter’s Five Forces
3.3. Market Ecosystem
3.4. SWOT Analysis
3.5. Regulatory Scenario
3.3. Effects of Inflation, Russia-Ukraine War, moderating economic growth, and other macroeconomic factors
Chapter 4. Competitive Landscape
4.1. Market Share Analysis
4.1.1. Global Food and Beverage Additives Market Share by Company, 2023
4.1.2. Product Offerings of Leading Food and Beverage Additives Companies
4.2. Market Entropy
4.2.1. New Product Launches in the Industry
4.2.2. Mergers, Acquisitions, Joint ventures, and Partnerships
4.3. Key Strategies and Best Practices
Chapter 5. Global Market Projections: Best, Reference, and Low Case Scenarios
5.1. Growth Analysis- Case Scenario Definitions
5.2. Low Growth Case Scenario Forecasts
5.3. Reference Growth Case Scenario Forecasts
5.4. High Growth Case Scenario Forecasts
Chapter 6. Market Dynamics
6.1. Food and Beverage Additives Market Drivers
6.2. Food and Beverage Additives Market Challenges
6.6. Food and Beverage Additives Market Opportunities
6.4. Food and Beverage Additives Market Trends
Chapter 7. Global Food and Beverage Additives Market Outlook Trends
7.1. Global Food and Beverage Additives Revenue (USD Million) and CAGR (%) by Type (2021-2032)
7.2. Global Food and Beverage Additives Revenue (USD Million) and CAGR (%) by Application (2021-2032)
7.3. Global Food and Beverage Additives Revenue (USD Million) and CAGR (%) by Product (2021-2032)
By Product
Acidulants
Anti-caking Agents
Colors
Emulsifiers
Flavors
Sweeteners
Preservatives
Others
By Source
Natural
Synthetic
By Distribution Channel
Hypermarkets/Supermarkets
Convenience Stores
Online Retail
Others
By Application
Bakery & Confectionary
Beverages
Dairy
Frozen Foods
Others
Chapter 8. Global Food and Beverage Additives Regional Analysis and Outlook
8.1. Global Food and Beverage Additives Revenue (USD Million) By Regions (2021- 2032)
8.2. North America Food and Beverage Additives Revenue (USD Million) by Country (2021-2032)
8.2.1. United States Food and Beverage Additives Regional Analysis and Outlook
8.2.2. Canada Food and Beverage Additives Regional Analysis and Outlook
8.2.3. Mexico Food and Beverage Additives Regional Analysis and Outlook
8.3. Europe Food and Beverage Additives Revenue (USD Million), by Country (2021-2032)
8.3.1. Germany Food and Beverage Additives Regional Analysis and Outlook
8.3.2. France Food and Beverage Additives Regional Analysis and Outlook
8.3.3. United Kingdom Food and Beverage Additives Regional Analysis and Outlook
8.3.4. Spain Food and Beverage Additives Regional Analysis and Outlook
8.3.5. Italy Food and Beverage Additives Regional Analysis and Outlook
8.3.6. Russia Food and Beverage Additives Regional Analysis and Outlook
8.3.7. Rest of Europe Food and Beverage Additives Regional Analysis and Outlook
8.4. Asia Pacific Food and Beverage Additives Revenue (USD Million) by Country (2021-2032)
8.4.1. China Food and Beverage Additives Regional Analysis and Outlook
8.4.2. Japan Food and Beverage Additives Regional Analysis and Outlook
8.4.3. India Food and Beverage Additives Regional Analysis and Outlook
8.4.4. South Korea Food and Beverage Additives Regional Analysis and Outlook
8.4.5. Australia Food and Beverage Additives Regional Analysis and Outlook
8.4.6. South East Asia Food and Beverage Additives Regional Analysis and Outlook
8.4.7. Rest of Asia Pacific Food and Beverage Additives Regional Analysis and Outlook
8.5. South America Food and Beverage Additives Revenue (USD Million), by Country (2021-2032)
8.5.1. Brazil Food and Beverage Additives Regional Analysis and Outlook
8.5.2. Argentina Food and Beverage Additives Regional Analysis and Outlook
8.5.3. Rest of South America Food and Beverage Additives Regional Analysis and Outlook
8.6. Middle East and Africa Food and Beverage Additives Revenue (USD Million) by Country (2021-2032)
8.6.1. Middle East Food and Beverage Additives Regional Analysis and Outlook
8.6.2. Africa Food and Beverage Additives Regional Analysis and Outlook
Chapter 9. North America Food and Beverage Additives Analysis and Outlook
9.1. North America Food and Beverage Additives Revenue (USD Million) by Segments (2021-2032)
9.1.1. North America Food and Beverage Additives Revenue (USD Million) by Type (2021-2032)
9.1.2. North America Food and Beverage Additives Revenue (USD Million) by Application (2021-2032)
9.1.3. North America Food and Beverage Additives Revenue (USD Million) by Product (2021-2032)
By Product
Acidulants
Anti-caking Agents
Colors
Emulsifiers
Flavors
Sweeteners
Preservatives
Others
By Source
Natural
Synthetic
By Distribution Channel
Hypermarkets/Supermarkets
Convenience Stores
Online Retail
Others
By Application
Bakery & Confectionary
Beverages
Dairy
Frozen Foods
Others
Chapter 10. Europe Food and Beverage Additives Analysis and Outlook
10.1. Europe Food and Beverage Additives Revenue (USD Million), by Segments (USD Million) (2021-2032)
10.1.1. Europe Food and Beverage Additives Revenue (USD Million) by Type (2021-2032)
10.1.2. Europe Food and Beverage Additives Revenue (USD Million) by Application (2021-2032)
10.1.3. Europe Food and Beverage Additives Revenue (USD Million) by Product (2021-2032)
By Product
Acidulants
Anti-caking Agents
Colors
Emulsifiers
Flavors
Sweeteners
Preservatives
Others
By Source
Natural
Synthetic
By Distribution Channel
Hypermarkets/Supermarkets
Convenience Stores
Online Retail
Others
By Application
Bakery & Confectionary
Beverages
Dairy
Frozen Foods
Others
Chapter 11. Asia Pacific Food and Beverage Additives Analysis and Outlook
11.1. Asia Pacific Food and Beverage Additives Revenue (USD Million), and Revenue (USD Million) by Segments (2021-2032)
11.1.1. Asia Pacific Food and Beverage Additives Revenue (USD Million) by Type (2021-2032)
11.1.2. Asia Pacific Food and Beverage Additives Revenue (USD Million) by Application (2021-2032)
11.1.3. Asia Pacific Food and Beverage Additives Revenue (USD Million) by Product (2021-2032)
By Product
Acidulants
Anti-caking Agents
Colors
Emulsifiers
Flavors
Sweeteners
Preservatives
Others
By Source
Natural
Synthetic
By Distribution Channel
Hypermarkets/Supermarkets
Convenience Stores
Online Retail
Others
By Application
Bakery & Confectionary
Beverages
Dairy
Frozen Foods
Others
Chapter 12. South America Food and Beverage Additives Analysis and Outlook
12.1. South America Food and Beverage Additives Revenue (USD Million), by Segments (2021-2032)
12.1.1. South America Food and Beverage Additives Revenue (USD Million) by Type (2021-2032)
12.1.2. South America Food and Beverage Additives Revenue (USD Million) by Application (2021-2032)
12.1.3. South America Food and Beverage Additives Revenue (USD Million) by Product (2021-2032)
By Product
Acidulants
Anti-caking Agents
Colors
Emulsifiers
Flavors
Sweeteners
Preservatives
Others
By Source
Natural
Synthetic
By Distribution Channel
Hypermarkets/Supermarkets
Convenience Stores
Online Retail
Others
By Application
Bakery & Confectionary
Beverages
Dairy
Frozen Foods
Others
Chapter 13. Middle East and Africa Food and Beverage Additives Analysis and Outlook
13.1. Middle East and Africa Food and Beverage Additives Revenue (USD Million), by Segments (2021-2032)
13.1.1. Middle East and Africa Food and Beverage Additives Revenue (USD Million) by Type (2021-2032)
13.1.2. Middle East and Africa Food and Beverage Additives Revenue (USD Million) by Application (2021-2032)
13.1.3. Middle East and Africa Food and Beverage Additives Revenue (USD Million) by Product (2021-2032)
By Product
Acidulants
Anti-caking Agents
Colors
Emulsifiers
Flavors
Sweeteners
Preservatives
Others
By Source
Natural
Synthetic
By Distribution Channel
Hypermarkets/Supermarkets
Convenience Stores
Online Retail
Others
By Application
Bakery & Confectionary
Beverages
Dairy
Frozen Foods
Others
Chapter 14. Food and Beverage Additives Company Profiles
14.1 Business Overview
14.2 Product Profiles
14.3 SWOT Profiles
14.5 Recent Developments
14.6 Financial Profile
List of Companies
Archer Daniels Midland Company (ADM)
BASF SE
Cargill Inc
Evonik Industries AG
Ingredion Inc
Kerry Group Plc
Novozymes A/S
Tate & Lyle PLC
15. Methodology and Data Sources
15.1 Customization Offerings
15.2 Subscription Services
15.3 Related Reports
15.4 Publisher Expertise
LIST OF TABLES
Table 1 Market Segmentation Analysis
Table 2 Global Food and Beverage Additives Market Share of Leading Companies, 2023
Table 3 Product Offerings of Leading Companies
Table 4 Low Growth Scenario Forecasts
Table 5 Reference Case Growth Scenario
Table 6 High Growth Case Scenario
Table 7 Global Food and Beverage Additives Revenue (USD Million) And CAGR (%) By Type (2021-2032)
Table 8 Global Food and Beverage Additives Revenue (USD Million) And CAGR (%) By Application (2021-2032)
Table 9 Global Food and Beverage Additives Revenue (USD Million) And CAGR (%) By Product (2021-2032)
Table 10 Global Food and Beverage Additives Market Revenue (USD Million) By Regions (2021-2032)
Table 11 Global Food and Beverage Additives Market Share (%) By Regions (2021-2032)
Table 12 North America Food and Beverage Additives Revenue (USD Million) By Country (2021-2032)
Table 13 Europe Food and Beverage Additives Revenue (USD Million) By Country (2021-2032)
Table 14 Asia Pacific Food and Beverage Additives Revenue (USD Million) By Country (2021-2032)
Table 15 South America Food and Beverage Additives Revenue (USD Million) By Country (2021-2032)
Table 16 Middle East and Africa Food and Beverage Additives Revenue (USD Million) By Region (2021-2032)
Table 17 North America Food and Beverage Additives Revenue (USD Million) By Type (2021-2032)
Table 18 North America Food and Beverage Additives Revenue (USD Million) By Application (2021-2032)
Table 19 North America Food and Beverage Additives Revenue (USD Million) By Product (2021-2032)
Table 20 Europe Food and Beverage Additives Revenue (USD Million) By Type (2021-2032)
Table 21 Europe Food and Beverage Additives Revenue (USD Million) By Application (2021-2032)
Table 22 Europe Food and Beverage Additives Revenue (USD Million) By Product (2021-2032)
Table 23 Asia Pacific Food and Beverage Additives Revenue (USD Million) By Type (2021-2032)
Table 24 Asia Pacific Food and Beverage Additives Revenue (USD Million) By Application (2021-2032)
Table 25 Asia Pacific Food and Beverage Additives Revenue (USD Million) By Product (2021-2032)
Table 26 South America Food and Beverage Additives Revenue (USD Million) By Type (2021-2032)
Table 27 South America Food and Beverage Additives Revenue (USD Million) By Application (2021-2032)
Table 28 South America Food and Beverage Additives Revenue (USD Million) By Product (2021-2032)
Table 29 Middle East and Africa Food and Beverage Additives Revenue (USD Million) By Type (2021-2032)
Table 30 Middle East and Africa Food and Beverage Additives Revenue (USD Million) By Application (2021-2032)
Table 31 Middle East and Africa Food and Beverage Additives Revenue (USD Million) By Product (2021-2032)
LIST OF FIGURES
Figure 1. Market Scope
Figure 2. Pricing Forecasts Per Unit, 2023- 2032
Figure 3. Porter’s Five Forces
Figure 4. Global Food and Beverage Additives Market Revenue (USD Million) By Regions (2021-2032)
Figure 5. Global Food and Beverage Additives Market Share (%) By Regions (2023)
Figure 6. North America Food and Beverage Additives Revenue (USD Million) By Country (2021-2032)
Figure 7. United States Food and Beverage Additives Revenue (USD Million) By Country (2021-2032)
Figure 8. Canada Food and Beverage Additives Revenue (USD Million) By Country (2021-2032)
Figure 9. Mexico Food and Beverage Additives Revenue (USD Million) By Country (2021-2032)
Figure 10. Europe Food and Beverage Additives Revenue (USD Million) By Country (2021-2032)
Figure 11. Germany Food and Beverage Additives Revenue (USD Million) By Country (2021-2032)
Figure 12. France Food and Beverage Additives Revenue (USD Million) By Country (2021-2032)
Figure 13. United Kingdom Food and Beverage Additives Revenue (USD Million) By Country (2021-2032)
Figure 14. Spain Food and Beverage Additives Revenue (USD Million) By Country (2021-2032)
Figure 15. Italy Food and Beverage Additives Revenue (USD Million) By Country (2021-2032)
Figure 16. Russia Food and Beverage Additives Revenue (USD Million) By Country (2021-2032)
Figure 17. Rest of Europe Food and Beverage Additives Revenue (USD Million) By Country (2021-2032)
Figure 11. Asia Pacific Food and Beverage Additives Revenue (USD Million) By Country (2021-2032)
Figure 12. China Food and Beverage Additives Revenue (USD Million) By Country (2021-2032)
Figure 13. Japan Food and Beverage Additives Revenue (USD Million) By Country (2021-2032)
Figure 14. India Food and Beverage Additives Revenue (USD Million) By Country (2021-2032)
Figure 15. South Korea Food and Beverage Additives Revenue (USD Million) By Country (2021-2032)
Figure 16. Australia Food and Beverage Additives Revenue (USD Million) By Country (2021-2032)
Figure 17. South East Asia Food and Beverage Additives Revenue (USD Million) By Country (2021-2032)
Figure 18. South America Food and Beverage Additives Revenue (USD Million) By Country (2021-2032)
Figure 19. Brazil Food and Beverage Additives Revenue (USD Million) By Country (2021-2032)
Figure 20. Argentina Food and Beverage Additives Revenue (USD Million) By Country (2021-2032)
Figure 21. Rest of Asia Pacific Food and Beverage Additives Revenue (USD Million) By Country (2021-2032)
Figure 22. Middle East and Africa Food and Beverage Additives Revenue (USD Million) By Region (2021-2032)
Figure 23. Saudi Arabia Food and Beverage Additives Revenue (USD Million) By Region (2021-2032)
Figure 24. The UAE Food and Beverage Additives Revenue (USD Million) By Region (2021-2032)
Figure 25. Rest of Middle East Food and Beverage Additives Revenue (USD Million) By Region (2021-2032)
Figure 26. South Africa Food and Beverage Additives Revenue (USD Million) By Region (2021-2032)
Figure 27. Africa Food and Beverage Additives Revenue (USD Million) By Region (2021-2032)
Figure 28. North America Food and Beverage Additives Revenue (USD Million) By Type (2021-2032)
Figure 29. North America Food and Beverage Additives Revenue (USD Million) By Application (2021-2032)
Figure 30. North America Food and Beverage Additives Revenue (USD Million) By Product (2021-2032)
Figure 31. Europe Food and Beverage Additives Revenue (USD Million) By Type (2021-2032)
Figure 32. Europe Food and Beverage Additives Revenue (USD Million) By Application (2021-2032)
Figure 33. Europe Food and Beverage Additives Revenue (USD Million) By Product (2021-2032)
Figure 34. Asia Pacific Food and Beverage Additives Revenue (USD Million) By Type (2021-2032)
Figure 35. Asia Pacific Food and Beverage Additives Revenue (USD Million) By Application (2021-2032)
Figure 36. Asia Pacific Food and Beverage Additives Revenue (USD Million) By Product (2021-2032)
Figure 37. South America Food and Beverage Additives Revenue (USD Million) By Type (2021-2032)
Figure 38. South America Food and Beverage Additives Revenue (USD Million) By Application (2021-2032)
Figure 39. South America Food and Beverage Additives Revenue (USD Million) By Product (2021-2032)
Figure 40. Middle East and Africa Food and Beverage Additives Revenue (USD Million) By Type (2021-2032)
Figure 41. Middle East and Africa Food and Beverage Additives Revenue (USD Million) By Application (2021-2032)
Figure 42. Middle East and Africa Food and Beverage Additives Revenue (USD Million) By Product (2021-2032)
By Product
Acidulants
Anti-caking Agents
Colors
Emulsifiers
Flavors
Sweeteners
Preservatives
Others
By Source
Natural
Synthetic
By Distribution Channel
Hypermarkets/Supermarkets
Convenience Stores
Online Retail
Others
By Application
Bakery & Confectionary
Beverages
Dairy
Frozen Foods
Others
Countries Analyzed
North America (US, Canada, Mexico)
Europe (Germany, UK, France, Spain, Italy, Russia, Rest of Europe)
Asia Pacific (China, India, Japan, South Korea, Australia, South East Asia, Rest of Asia)
South America (Brazil, Argentina, Rest of South America)
Middle East and Africa (Saudi Arabia, UAE, Rest of Middle East, South Africa, Egypt, Rest of Africa)
