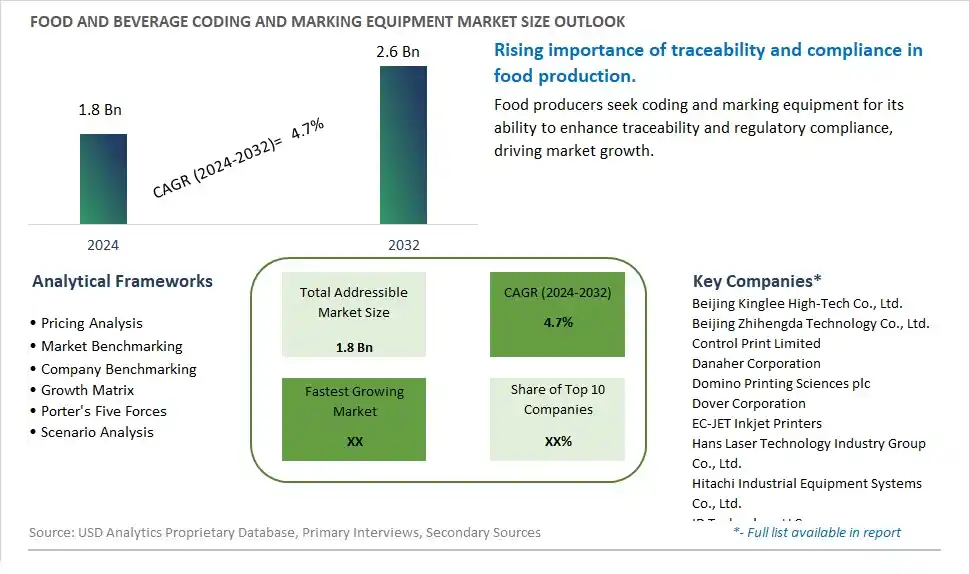
Global Food and Beverage Coding and Marking Equipment Market Size is valued at $1.8 Billion in 2024 and is forecast to register a growth rate (CAGR) of 4.7% to reach $2.6 Billion by 2032.
The global Food and Beverage Coding and Marking Equipment Market Comprehensive Study analyzes and forecasts the market size across 6 regions and 24 countries for diverse segments -By Type (Inkjet Printers, Laser Printers, HI-Resolution Printers), By Application (Food, Beverage)
An Introduction to Food and Beverage Coding and Marking Equipment Market
The Food and Beverage Coding and Marking Equipment market in 2024 is witnessing robust growth, driven by the increasing demand for accurate and efficient coding and marking solutions in the food and beverage industry. Coding and marking equipment, used for labeling, date coding, and traceability, are essential for compliance and quality control. The market benefits from advancements in coding technologies, the growing trend of automation in manufacturing, and the expansion of the global food and beverage sector. Additionally, the increasing focus on product traceability and regulatory compliance is driving market growth.
Food and Beverage Coding and Marking Equipment Competitive Landscape
The market report analyses the leading companies in the industry including Beijing Kinglee High-Tech Co., Ltd., Beijing Zhihengda Technology Co., Ltd., Control Print Limited, Danaher Corporation, Domino Printing Sciences plc, Dover Corporation, EC-JET Inkjet Printers, Hans Laser Technology Industry Group Co., Ltd., Hitachi Industrial Equipment Systems Co., Ltd., ID Technology LLC, Illinois Tool Works Inc., KBA-Metronic AG, KGK Co., Ltd., Macsa ID, S.A., Matthews International Corporation, Paul Leibinger GmbH & Co. KG, REA Elektronik GmbH, Squid Ink Manufacturing, Inc., SUNINE Technology, Trumpf GmbH, and Others.
Food and Beverage Coding and Marking Equipment Market Dynamics
Food and Beverage Coding and Marking Equipment Market Trend: Adoption of Traceability and Compliance Solutions
One prominent trend in the food and beverage coding and marking equipment market is the widespread adoption of traceability and compliance solutions. With increasing regulatory requirements and consumer demand for transparency in the food supply chain, manufacturers are investing in coding and marking equipment that enables accurate tracking, labeling, and serialization of products. This trend is driven by concerns over food safety, authenticity, and sustainability, as well as the need to comply with labeling regulations and industry standards. The adoption of advanced coding and marking technologies facilitates traceability from production to distribution, enhances product safety, reduces the risk of recalls, and builds consumer trust in food and beverage brands.
Food and Beverage Coding and Marking Equipment Market Driver: Industry 4.0 Integration and Automation
A key driver propelling the food and beverage coding and marking equipment market is the integration of Industry 4.0 technologies and automation solutions. Manufacturers are leveraging digitalization, connectivity, data analytics, and artificial intelligence to optimize production processes, improve efficiency, and ensure accurate coding and marking of products. The driver behind this trend is the need for speed, precision, flexibility, and scalability in coding and marking operations, driven by evolving consumer demands, supply chain complexities, and competitive pressures. Industry 4.0 integration enables real-time monitoring, predictive maintenance, remote diagnostics, and seamless integration with enterprise systems, empowering food and beverage companies to enhance productivity, reduce downtime, and meet changing market dynamics.
Food and Beverage Coding and Marking Equipment Market Opportunity: Development of Sustainable and Eco-Friendly Marking Solutions
A significant opportunity in the food and beverage coding and marking equipment market lies in the development of sustainable and eco-friendly marking solutions. With increasing emphasis on environmental responsibility and circular economy principles, there's a growing demand for coding and marking equipment that uses sustainable inks, substrates, and packaging materials. Manufacturers can capitalize on this opportunity by offering solutions that minimize waste, reduce carbon footprint, and support recyclability while maintaining high-quality printing and marking capabilities. Additionally, there's potential for developing innovative marking technologies, such as laser marking, edible inks, or RFID tags, that align with sustainable packaging trends and enhance product differentiation for food and beverage brands committed to environmental stewardship. By addressing sustainability challenges and providing eco-conscious solutions, companies can attract environmentally conscious customers, drive market share, and contribute to a more sustainable food and beverage industry.
Food and Beverage Coding and Marking Equipment Market Share Analysis: Inkjet Printers segment generated the highest revenue share in the industry
In the Food and Beverage Coding and Marking Equipment Market, segmented by type, Inkjet Printers emerge as the largest segment. Inkjet printers are widely used in the food and beverage industry for their versatility, cost-effectiveness, and ability to print high-quality codes and marks on various packaging materials. They are capable of printing alphanumeric codes, barcodes, logos, and expiration dates with precision and speed, making them suitable for both primary and secondary packaging applications. Inkjet printers offer advantages such as quick drying inks, minimal maintenance requirements, and the ability to adapt to different production line speeds, which are crucial in maintaining efficiency and meeting regulatory standards in the food and beverage sector.
Food and Beverage Coding and Marking Equipment Market Share Analysis: Food Application is the fastest growing segment over the forecast period to 2032
Among the applications in the Food and Beverage Coding and Marking Equipment Market, the segment focused on Food is experiencing the fastest growth to 2032. This growth is driven by stringent regulatory requirements for product traceability, batch coding, and expiration date marking in the food industry. Food coding and marking equipment ensure compliance with food safety regulations and facilitate efficient inventory management and recall procedures. With increasing consumer awareness and demands for transparency in food labeling and packaging, the adoption of advanced coding and marking technologies, including inkjet printers, is on the rise. These technologies not only enhance operational efficiency and product integrity but also contribute to brand credibility and consumer trust by ensuring accurate and clear information on food packaging.
Food and Beverage Coding and Marking Equipment Market Segmentation
By Type
Inkjet Printers
Laser Printers
HI-Resolution Printers
By Application
Food
Beverage
Countries Analyzed
North America (US, Canada, Mexico)
Europe (Germany, UK, France, Spain, Italy, Russia, Rest of Europe)
Asia Pacific (China, India, Japan, South Korea, Australia, South East Asia, Rest of Asia)
South America (Brazil, Argentina, Rest of South America)
Middle East and Africa (Saudi Arabia, UAE, Rest of Middle East, South Africa, Egypt, Rest of Africa)
Food and Beverage Coding and Marking Equipment Companies Profiled in the Study
Beijing Kinglee High-Tech Co., Ltd.
Beijing Zhihengda Technology Co., Ltd.
Control Print Limited
Danaher Corporation
Domino Printing Sciences plc
Dover Corporation
EC-JET Inkjet Printers
Hans Laser Technology Industry Group Co., Ltd.
Hitachi Industrial Equipment Systems Co., Ltd.
ID Technology LLC
Illinois Tool Works Inc.
KBA-Metronic AG
KGK Co., Ltd.
Macsa ID, S.A.
Matthews International Corporation
Paul Leibinger GmbH & Co. KG
REA Elektronik GmbH
Squid Ink Manufacturing, Inc.
SUNINE Technology
Trumpf GmbH
*- List Not Exhaustive
Chapter 1. TABLE OF CONTENTS
Chapter 2. Introduction to Food and Beverage Coding and Marking Equipment Market
2.1. Market Overview
2.2. Key Statistics and Report Highlights
2.3. Scope of the Comprehensive Study
2.3.1. Market Definition
2.3.2 Countries and Regions Covered
2.3.3 Research Objective
2.3.4 Units, Currency, and Conversions
2.3.5 Industry Value Chain
2.4. Key Market Segments
2.5. Key Companies
2.6. Study Period
Chapter 3. Strategic Analysis Review
3.1. Food and Beverage Coding and Marking Equipment Pricing Analysis and Forecast
3.2. Porter’s Five Forces
3.3. Market Ecosystem
3.4. SWOT Analysis
3.5. Regulatory Scenario
3.3. Effects of Inflation, Russia-Ukraine War, moderating economic growth, and other macroeconomic factors
Chapter 4. Competitive Landscape
4.1. Market Share Analysis
4.1.1. Global Food and Beverage Coding and Marking Equipment Market Share by Company, 2023
4.1.2. Product Offerings of Leading Food and Beverage Coding and Marking Equipment Companies
4.2. Market Entropy
4.2.1. New Product Launches in the Industry
4.2.2. Mergers, Acquisitions, Joint ventures, and Partnerships
4.3. Key Strategies and Best Practices
Chapter 5. Global Market Projections: Best, Reference, and Low Case Scenarios
5.1. Growth Analysis- Case Scenario Definitions
5.2. Low Growth Case Scenario Forecasts
5.3. Reference Growth Case Scenario Forecasts
5.4. High Growth Case Scenario Forecasts
Chapter 6. Market Dynamics
6.1. Food and Beverage Coding and Marking Equipment Market Drivers
6.2. Food and Beverage Coding and Marking Equipment Market Challenges
6.6. Food and Beverage Coding and Marking Equipment Market Opportunities
6.4. Food and Beverage Coding and Marking Equipment Market Trends
Chapter 7. Global Food and Beverage Coding and Marking Equipment Market Outlook Trends
7.1. Global Food and Beverage Coding and Marking Equipment Revenue (USD Million) and CAGR (%) by Type (2021-2032)
7.2. Global Food and Beverage Coding and Marking Equipment Revenue (USD Million) and CAGR (%) by Application (2021-2032)
7.3. Global Food and Beverage Coding and Marking Equipment Revenue (USD Million) and CAGR (%) by Product (2021-2032)
By Type
Inkjet Printers
Laser Printers
HI-Resolution Printers
By Application
Food
Beverage
Chapter 8. Global Food and Beverage Coding and Marking Equipment Regional Analysis and Outlook
8.1. Global Food and Beverage Coding and Marking Equipment Revenue (USD Million) By Regions (2021- 2032)
8.2. North America Food and Beverage Coding and Marking Equipment Revenue (USD Million) by Country (2021-2032)
8.2.1. United States Food and Beverage Coding and Marking Equipment Regional Analysis and Outlook
8.2.2. Canada Food and Beverage Coding and Marking Equipment Regional Analysis and Outlook
8.2.3. Mexico Food and Beverage Coding and Marking Equipment Regional Analysis and Outlook
8.3. Europe Food and Beverage Coding and Marking Equipment Revenue (USD Million), by Country (2021-2032)
8.3.1. Germany Food and Beverage Coding and Marking Equipment Regional Analysis and Outlook
8.3.2. France Food and Beverage Coding and Marking Equipment Regional Analysis and Outlook
8.3.3. United Kingdom Food and Beverage Coding and Marking Equipment Regional Analysis and Outlook
8.3.4. Spain Food and Beverage Coding and Marking Equipment Regional Analysis and Outlook
8.3.5. Italy Food and Beverage Coding and Marking Equipment Regional Analysis and Outlook
8.3.6. Russia Food and Beverage Coding and Marking Equipment Regional Analysis and Outlook
8.3.7. Rest of Europe Food and Beverage Coding and Marking Equipment Regional Analysis and Outlook
8.4. Asia Pacific Food and Beverage Coding and Marking Equipment Revenue (USD Million) by Country (2021-2032)
8.4.1. China Food and Beverage Coding and Marking Equipment Regional Analysis and Outlook
8.4.2. Japan Food and Beverage Coding and Marking Equipment Regional Analysis and Outlook
8.4.3. India Food and Beverage Coding and Marking Equipment Regional Analysis and Outlook
8.4.4. South Korea Food and Beverage Coding and Marking Equipment Regional Analysis and Outlook
8.4.5. Australia Food and Beverage Coding and Marking Equipment Regional Analysis and Outlook
8.4.6. South East Asia Food and Beverage Coding and Marking Equipment Regional Analysis and Outlook
8.4.7. Rest of Asia Pacific Food and Beverage Coding and Marking Equipment Regional Analysis and Outlook
8.5. South America Food and Beverage Coding and Marking Equipment Revenue (USD Million), by Country (2021-2032)
8.5.1. Brazil Food and Beverage Coding and Marking Equipment Regional Analysis and Outlook
8.5.2. Argentina Food and Beverage Coding and Marking Equipment Regional Analysis and Outlook
8.5.3. Rest of South America Food and Beverage Coding and Marking Equipment Regional Analysis and Outlook
8.6. Middle East and Africa Food and Beverage Coding and Marking Equipment Revenue (USD Million) by Country (2021-2032)
8.6.1. Middle East Food and Beverage Coding and Marking Equipment Regional Analysis and Outlook
8.6.2. Africa Food and Beverage Coding and Marking Equipment Regional Analysis and Outlook
Chapter 9. North America Food and Beverage Coding and Marking Equipment Analysis and Outlook
9.1. North America Food and Beverage Coding and Marking Equipment Revenue (USD Million) by Segments (2021-2032)
9.1.1. North America Food and Beverage Coding and Marking Equipment Revenue (USD Million) by Type (2021-2032)
9.1.2. North America Food and Beverage Coding and Marking Equipment Revenue (USD Million) by Application (2021-2032)
9.1.3. North America Food and Beverage Coding and Marking Equipment Revenue (USD Million) by Product (2021-2032)
By Type
Inkjet Printers
Laser Printers
HI-Resolution Printers
By Application
Food
Beverage
Chapter 10. Europe Food and Beverage Coding and Marking Equipment Analysis and Outlook
10.1. Europe Food and Beverage Coding and Marking Equipment Revenue (USD Million), by Segments (USD Million) (2021-2032)
10.1.1. Europe Food and Beverage Coding and Marking Equipment Revenue (USD Million) by Type (2021-2032)
10.1.2. Europe Food and Beverage Coding and Marking Equipment Revenue (USD Million) by Application (2021-2032)
10.1.3. Europe Food and Beverage Coding and Marking Equipment Revenue (USD Million) by Product (2021-2032)
By Type
Inkjet Printers
Laser Printers
HI-Resolution Printers
By Application
Food
Beverage
Chapter 11. Asia Pacific Food and Beverage Coding and Marking Equipment Analysis and Outlook
11.1. Asia Pacific Food and Beverage Coding and Marking Equipment Revenue (USD Million), and Revenue (USD Million) by Segments (2021-2032)
11.1.1. Asia Pacific Food and Beverage Coding and Marking Equipment Revenue (USD Million) by Type (2021-2032)
11.1.2. Asia Pacific Food and Beverage Coding and Marking Equipment Revenue (USD Million) by Application (2021-2032)
11.1.3. Asia Pacific Food and Beverage Coding and Marking Equipment Revenue (USD Million) by Product (2021-2032)
By Type
Inkjet Printers
Laser Printers
HI-Resolution Printers
By Application
Food
Beverage
Chapter 12. South America Food and Beverage Coding and Marking Equipment Analysis and Outlook
12.1. South America Food and Beverage Coding and Marking Equipment Revenue (USD Million), by Segments (2021-2032)
12.1.1. South America Food and Beverage Coding and Marking Equipment Revenue (USD Million) by Type (2021-2032)
12.1.2. South America Food and Beverage Coding and Marking Equipment Revenue (USD Million) by Application (2021-2032)
12.1.3. South America Food and Beverage Coding and Marking Equipment Revenue (USD Million) by Product (2021-2032)
By Type
Inkjet Printers
Laser Printers
HI-Resolution Printers
By Application
Food
Beverage
Chapter 13. Middle East and Africa Food and Beverage Coding and Marking Equipment Analysis and Outlook
13.1. Middle East and Africa Food and Beverage Coding and Marking Equipment Revenue (USD Million), by Segments (2021-2032)
13.1.1. Middle East and Africa Food and Beverage Coding and Marking Equipment Revenue (USD Million) by Type (2021-2032)
13.1.2. Middle East and Africa Food and Beverage Coding and Marking Equipment Revenue (USD Million) by Application (2021-2032)
13.1.3. Middle East and Africa Food and Beverage Coding and Marking Equipment Revenue (USD Million) by Product (2021-2032)
By Type
Inkjet Printers
Laser Printers
HI-Resolution Printers
By Application
Food
Beverage
Chapter 14. Food and Beverage Coding and Marking Equipment Company Profiles
14.1 Business Overview
14.2 Product Profiles
14.3 SWOT Profiles
14.5 Recent Developments
14.6 Financial Profile
List of Companies
Beijing Kinglee High-Tech Co., Ltd.
Beijing Zhihengda Technology Co., Ltd.
Control Print Limited
Danaher Corporation
Domino Printing Sciences plc
Dover Corporation
EC-JET Inkjet Printers
Hans Laser Technology Industry Group Co., Ltd.
Hitachi Industrial Equipment Systems Co., Ltd.
ID Technology LLC
Illinois Tool Works Inc.
KBA-Metronic AG
KGK Co., Ltd.
Macsa ID, S.A.
Matthews International Corporation
Paul Leibinger GmbH & Co. KG
REA Elektronik GmbH
Squid Ink Manufacturing, Inc.
SUNINE Technology
Trumpf GmbH
15. Methodology and Data Sources
15.1 Customization Offerings
15.2 Subscription Services
15.3 Related Reports
15.4 Publisher Expertise
LIST OF TABLES
Table 1 Market Segmentation Analysis
Table 2 Global Food and Beverage Coding and Marking Equipment Market Share of Leading Companies, 2023
Table 3 Product Offerings of Leading Companies
Table 4 Low Growth Scenario Forecasts
Table 5 Reference Case Growth Scenario
Table 6 High Growth Case Scenario
Table 7 Global Food and Beverage Coding and Marking Equipment Revenue (USD Million) And CAGR (%) By Type (2021-2032)
Table 8 Global Food and Beverage Coding and Marking Equipment Revenue (USD Million) And CAGR (%) By Application (2021-2032)
Table 9 Global Food and Beverage Coding and Marking Equipment Revenue (USD Million) And CAGR (%) By Product (2021-2032)
Table 10 Global Food and Beverage Coding and Marking Equipment Market Revenue (USD Million) By Regions (2021-2032)
Table 11 Global Food and Beverage Coding and Marking Equipment Market Share (%) By Regions (2021-2032)
Table 12 North America Food and Beverage Coding and Marking Equipment Revenue (USD Million) By Country (2021-2032)
Table 13 Europe Food and Beverage Coding and Marking Equipment Revenue (USD Million) By Country (2021-2032)
Table 14 Asia Pacific Food and Beverage Coding and Marking Equipment Revenue (USD Million) By Country (2021-2032)
Table 15 South America Food and Beverage Coding and Marking Equipment Revenue (USD Million) By Country (2021-2032)
Table 16 Middle East and Africa Food and Beverage Coding and Marking Equipment Revenue (USD Million) By Region (2021-2032)
Table 17 North America Food and Beverage Coding and Marking Equipment Revenue (USD Million) By Type (2021-2032)
Table 18 North America Food and Beverage Coding and Marking Equipment Revenue (USD Million) By Application (2021-2032)
Table 19 North America Food and Beverage Coding and Marking Equipment Revenue (USD Million) By Product (2021-2032)
Table 20 Europe Food and Beverage Coding and Marking Equipment Revenue (USD Million) By Type (2021-2032)
Table 21 Europe Food and Beverage Coding and Marking Equipment Revenue (USD Million) By Application (2021-2032)
Table 22 Europe Food and Beverage Coding and Marking Equipment Revenue (USD Million) By Product (2021-2032)
Table 23 Asia Pacific Food and Beverage Coding and Marking Equipment Revenue (USD Million) By Type (2021-2032)
Table 24 Asia Pacific Food and Beverage Coding and Marking Equipment Revenue (USD Million) By Application (2021-2032)
Table 25 Asia Pacific Food and Beverage Coding and Marking Equipment Revenue (USD Million) By Product (2021-2032)
Table 26 South America Food and Beverage Coding and Marking Equipment Revenue (USD Million) By Type (2021-2032)
Table 27 South America Food and Beverage Coding and Marking Equipment Revenue (USD Million) By Application (2021-2032)
Table 28 South America Food and Beverage Coding and Marking Equipment Revenue (USD Million) By Product (2021-2032)
Table 29 Middle East and Africa Food and Beverage Coding and Marking Equipment Revenue (USD Million) By Type (2021-2032)
Table 30 Middle East and Africa Food and Beverage Coding and Marking Equipment Revenue (USD Million) By Application (2021-2032)
Table 31 Middle East and Africa Food and Beverage Coding and Marking Equipment Revenue (USD Million) By Product (2021-2032)
LIST OF FIGURES
Figure 1. Market Scope
Figure 2. Pricing Forecasts Per Unit, 2023- 2032
Figure 3. Porter’s Five Forces
Figure 4. Global Food and Beverage Coding and Marking Equipment Market Revenue (USD Million) By Regions (2021-2032)
Figure 5. Global Food and Beverage Coding and Marking Equipment Market Share (%) By Regions (2023)
Figure 6. North America Food and Beverage Coding and Marking Equipment Revenue (USD Million) By Country (2021-2032)
Figure 7. United States Food and Beverage Coding and Marking Equipment Revenue (USD Million) By Country (2021-2032)
Figure 8. Canada Food and Beverage Coding and Marking Equipment Revenue (USD Million) By Country (2021-2032)
Figure 9. Mexico Food and Beverage Coding and Marking Equipment Revenue (USD Million) By Country (2021-2032)
Figure 10. Europe Food and Beverage Coding and Marking Equipment Revenue (USD Million) By Country (2021-2032)
Figure 11. Germany Food and Beverage Coding and Marking Equipment Revenue (USD Million) By Country (2021-2032)
Figure 12. France Food and Beverage Coding and Marking Equipment Revenue (USD Million) By Country (2021-2032)
Figure 13. United Kingdom Food and Beverage Coding and Marking Equipment Revenue (USD Million) By Country (2021-2032)
Figure 14. Spain Food and Beverage Coding and Marking Equipment Revenue (USD Million) By Country (2021-2032)
Figure 15. Italy Food and Beverage Coding and Marking Equipment Revenue (USD Million) By Country (2021-2032)
Figure 16. Russia Food and Beverage Coding and Marking Equipment Revenue (USD Million) By Country (2021-2032)
Figure 17. Rest of Europe Food and Beverage Coding and Marking Equipment Revenue (USD Million) By Country (2021-2032)
Figure 11. Asia Pacific Food and Beverage Coding and Marking Equipment Revenue (USD Million) By Country (2021-2032)
Figure 12. China Food and Beverage Coding and Marking Equipment Revenue (USD Million) By Country (2021-2032)
Figure 13. Japan Food and Beverage Coding and Marking Equipment Revenue (USD Million) By Country (2021-2032)
Figure 14. India Food and Beverage Coding and Marking Equipment Revenue (USD Million) By Country (2021-2032)
Figure 15. South Korea Food and Beverage Coding and Marking Equipment Revenue (USD Million) By Country (2021-2032)
Figure 16. Australia Food and Beverage Coding and Marking Equipment Revenue (USD Million) By Country (2021-2032)
Figure 17. South East Asia Food and Beverage Coding and Marking Equipment Revenue (USD Million) By Country (2021-2032)
Figure 18. South America Food and Beverage Coding and Marking Equipment Revenue (USD Million) By Country (2021-2032)
Figure 19. Brazil Food and Beverage Coding and Marking Equipment Revenue (USD Million) By Country (2021-2032)
Figure 20. Argentina Food and Beverage Coding and Marking Equipment Revenue (USD Million) By Country (2021-2032)
Figure 21. Rest of Asia Pacific Food and Beverage Coding and Marking Equipment Revenue (USD Million) By Country (2021-2032)
Figure 22. Middle East and Africa Food and Beverage Coding and Marking Equipment Revenue (USD Million) By Region (2021-2032)
Figure 23. Saudi Arabia Food and Beverage Coding and Marking Equipment Revenue (USD Million) By Region (2021-2032)
Figure 24. The UAE Food and Beverage Coding and Marking Equipment Revenue (USD Million) By Region (2021-2032)
Figure 25. Rest of Middle East Food and Beverage Coding and Marking Equipment Revenue (USD Million) By Region (2021-2032)
Figure 26. South Africa Food and Beverage Coding and Marking Equipment Revenue (USD Million) By Region (2021-2032)
Figure 27. Africa Food and Beverage Coding and Marking Equipment Revenue (USD Million) By Region (2021-2032)
Figure 28. North America Food and Beverage Coding and Marking Equipment Revenue (USD Million) By Type (2021-2032)
Figure 29. North America Food and Beverage Coding and Marking Equipment Revenue (USD Million) By Application (2021-2032)
Figure 30. North America Food and Beverage Coding and Marking Equipment Revenue (USD Million) By Product (2021-2032)
Figure 31. Europe Food and Beverage Coding and Marking Equipment Revenue (USD Million) By Type (2021-2032)
Figure 32. Europe Food and Beverage Coding and Marking Equipment Revenue (USD Million) By Application (2021-2032)
Figure 33. Europe Food and Beverage Coding and Marking Equipment Revenue (USD Million) By Product (2021-2032)
Figure 34. Asia Pacific Food and Beverage Coding and Marking Equipment Revenue (USD Million) By Type (2021-2032)
Figure 35. Asia Pacific Food and Beverage Coding and Marking Equipment Revenue (USD Million) By Application (2021-2032)
Figure 36. Asia Pacific Food and Beverage Coding and Marking Equipment Revenue (USD Million) By Product (2021-2032)
Figure 37. South America Food and Beverage Coding and Marking Equipment Revenue (USD Million) By Type (2021-2032)
Figure 38. South America Food and Beverage Coding and Marking Equipment Revenue (USD Million) By Application (2021-2032)
Figure 39. South America Food and Beverage Coding and Marking Equipment Revenue (USD Million) By Product (2021-2032)
Figure 40. Middle East and Africa Food and Beverage Coding and Marking Equipment Revenue (USD Million) By Type (2021-2032)
Figure 41. Middle East and Africa Food and Beverage Coding and Marking Equipment Revenue (USD Million) By Application (2021-2032)
Figure 42. Middle East and Africa Food and Beverage Coding and Marking Equipment Revenue (USD Million) By Product (2021-2032)
By Type
Inkjet Printers
Laser Printers
HI-Resolution Printers
By Application
Food
Beverage
Countries Analyzed
North America (US, Canada, Mexico)
Europe (Germany, UK, France, Spain, Italy, Russia, Rest of Europe)
Asia Pacific (China, India, Japan, South Korea, Australia, South East Asia, Rest of Asia)
South America (Brazil, Argentina, Rest of South America)
Middle East and Africa (Saudi Arabia, UAE, Rest of Middle East, South Africa, Egypt, Rest of Africa)
