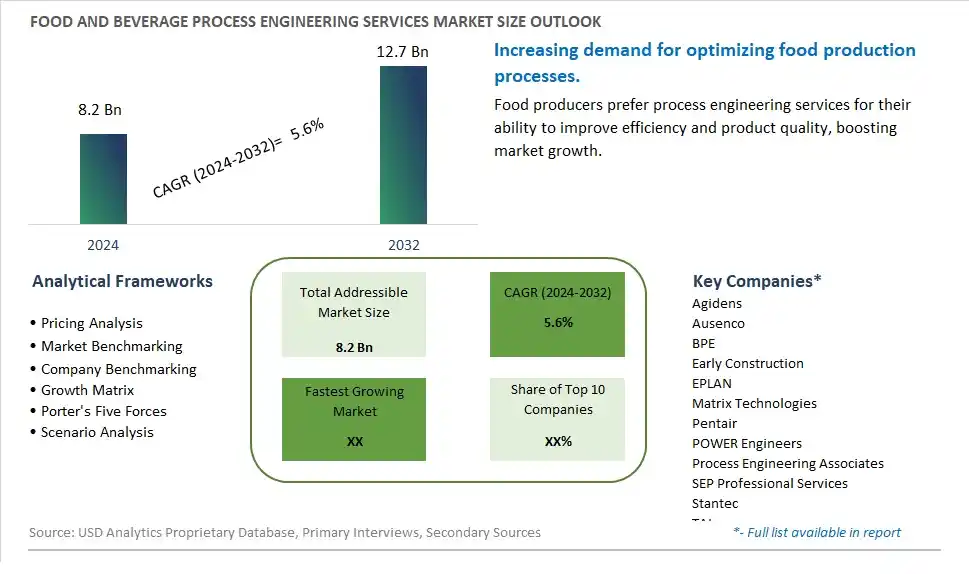
Global Food and Beverage Process Engineering Services Market Size is valued at $8.2 Billion in 2024 and is forecast to register a growth rate (CAGR) of 5.6% to reach $12.7 Billion by 2032.
The global Food and Beverage Process Engineering Services Market Comprehensive Study analyzes and forecasts the market size across 6 regions and 24 countries for diverse segments -By Type (Food, Beverage), By Application (Large Enterprises, SMEs)
An Introduction to Food and Beverage Process Engineering Services Market
In 2024, the Food and Beverage Process Engineering Services market is thriving, fueled by the rising demand for expertise in optimizing food and beverage manufacturing processes. Process engineering services, including process design, equipment selection, and system integration, are essential for improving efficiency, quality, and sustainability. The market benefits from advancements in food processing technologies, the growing trend of automation and digitalization, and the expansion of the global food and beverage sector. Additionally, the increasing focus on sustainability and energy efficiency is contributing to market growth.
Food and Beverage Process Engineering Services Competitive Landscape
The market report analyses the leading companies in the industry including Agidens, Ausenco, BPE, Early Construction, EPLAN, Matrix Technologies, Pentair, POWER Engineers, Process Engineering Associates, SEP Professional Services, Stantec, TAI, and Others.
Food and Beverage Process Engineering Services Market Dynamics
Food and Beverage Process Engineering Services Market Trend: Emphasis on Efficiency and Optimization in Food Processing
One prominent trend in the food and beverage process engineering services market is the increasing emphasis on efficiency and optimization in food processing operations. Food manufacturers are seeking engineering services that can streamline production processes, reduce waste, improve resource utilization, and enhance overall operational efficiency. This trend is driven by the need to meet consumer demand for high-quality products, minimize production costs, comply with regulatory standards, and adapt to market trends swiftly. As the food industry becomes more competitive and complex, process engineering services play a crucial role in helping companies achieve operational excellence, sustainability, and competitiveness in the market.
Food and Beverage Process Engineering Services Market Driver: Technological Advancements and Automation Integration
A key driver propelling the food and beverage process engineering services market is the continuous evolution of technological advancements and the integration of automation solutions. Process engineers are leveraging technologies such as data analytics, artificial intelligence, robotics, Internet of Things (IoT), and digital twins to optimize production lines, monitor performance metrics in real time, predict maintenance needs, and implement data-driven decision-making strategies. The driver behind this trend is the quest for operational agility, scalability, cost-effectiveness, and regulatory compliance, as well as the desire to adopt Industry 4.0 principles to transform traditional manufacturing processes into smart, connected ecosystems that enhance productivity and innovation.
Food and Beverage Process Engineering Services Market Opportunity: Development of Sustainable and Energy-Efficient Solutions
A significant opportunity in the food and beverage process engineering services market lies in the development of sustainable and energy-efficient solutions. With increasing focus on environmental sustainability, carbon footprint reduction, and resource conservation, food manufacturers are seeking engineering services that can help them optimize energy usage, implement eco-friendly practices, and achieve sustainability goals. Process engineers can capitalize on this opportunity by offering services such as energy audits, waste minimization strategies, renewable energy integration, water conservation measures, and sustainable packaging solutions. Additionally, there's potential for developing innovative technologies and processes that promote circular economy principles, reduce environmental impact, and enhance the overall sustainability performance of food and beverage production facilities. By aligning with sustainability objectives and providing holistic engineering solutions, companies can differentiate their services, attract environmentally conscious clients, and contribute to a greener and more resilient food industry.
Food and Beverage Process Engineering Services Market Share Analysis: Food segment generated the highest revenue share in the industry
In the Food and Beverage Process Engineering Services Market, the Food segment stands out as the largest. This segment encompasses engineering services tailored specifically for food processing plants, including design, installation, and optimization of equipment and processes. Food process engineering services are essential for ensuring food safety, quality control, and operational efficiency in food production facilities. They cover a wide range of applications from raw material handling and processing to packaging and distribution, addressing unique challenges such as hygiene standards, regulatory compliance, and energy efficiency. The demand for specialized food process engineering services continues to grow as the food industry expands globally and faces increasing complexity in production and supply chain management.
Food and Beverage Process Engineering Services Market Share Analysis: SMEs Application is the fastest growing segment over the forecast period to 2032
Within the Food and Beverage Process Engineering Services Market, the segment catering to Small and Medium Enterprises (SMEs) is experiencing the fastest growth trajectory towards 2032. SMEs in the food and beverage sector are increasingly recognizing the need for specialized engineering expertise to enhance their production capabilities, improve product quality, and comply with stringent regulatory requirements. Food process engineering services tailored for SMEs offer customized solutions that address the unique challenges faced by smaller businesses, such as limited resources, scalability issues, and budget constraints. These services encompass consulting, process optimization, technology integration, and training to empower SMEs to compete effectively in the market while maintaining high standards of food safety and operational efficiency.
Food and Beverage Process Engineering Services Market Segmentation
By Type
Food
Beverage
By Application
Large Enterprises
SMEs
Countries Analyzed
North America (US, Canada, Mexico)
Europe (Germany, UK, France, Spain, Italy, Russia, Rest of Europe)
Asia Pacific (China, India, Japan, South Korea, Australia, South East Asia, Rest of Asia)
South America (Brazil, Argentina, Rest of South America)
Middle East and Africa (Saudi Arabia, UAE, Rest of Middle East, South Africa, Egypt, Rest of Africa)
Food and Beverage Process Engineering Services Companies Profiled in the Study
Agidens
Ausenco
BPE
Early Construction
EPLAN
Matrix Technologies
Pentair
POWER Engineers
Process Engineering Associates
SEP Professional Services
Stantec
TAI
*- List Not Exhaustive
Chapter 1. TABLE OF CONTENTS
Chapter 2. Introduction to Food and Beverage Process Engineering Services Market
2.1. Market Overview
2.2. Key Statistics and Report Highlights
2.3. Scope of the Comprehensive Study
2.3.1. Market Definition
2.3.2 Countries and Regions Covered
2.3.3 Research Objective
2.3.4 Units, Currency, and Conversions
2.3.5 Industry Value Chain
2.4. Key Market Segments
2.5. Key Companies
2.6. Study Period
Chapter 3. Strategic Analysis Review
3.1. Food and Beverage Process Engineering Services Pricing Analysis and Forecast
3.2. Porter’s Five Forces
3.3. Market Ecosystem
3.4. SWOT Analysis
3.5. Regulatory Scenario
3.3. Effects of Inflation, Russia-Ukraine War, moderating economic growth, and other macroeconomic factors
Chapter 4. Competitive Landscape
4.1. Market Share Analysis
4.1.1. Global Food and Beverage Process Engineering Services Market Share by Company, 2023
4.1.2. Product Offerings of Leading Food and Beverage Process Engineering Services Companies
4.2. Market Entropy
4.2.1. New Product Launches in the Industry
4.2.2. Mergers, Acquisitions, Joint ventures, and Partnerships
4.3. Key Strategies and Best Practices
Chapter 5. Global Market Projections: Best, Reference, and Low Case Scenarios
5.1. Growth Analysis- Case Scenario Definitions
5.2. Low Growth Case Scenario Forecasts
5.3. Reference Growth Case Scenario Forecasts
5.4. High Growth Case Scenario Forecasts
Chapter 6. Market Dynamics
6.1. Food and Beverage Process Engineering Services Market Drivers
6.2. Food and Beverage Process Engineering Services Market Challenges
6.6. Food and Beverage Process Engineering Services Market Opportunities
6.4. Food and Beverage Process Engineering Services Market Trends
Chapter 7. Global Food and Beverage Process Engineering Services Market Outlook Trends
7.1. Global Food and Beverage Process Engineering Services Revenue (USD Million) and CAGR (%) by Type (2021-2032)
7.2. Global Food and Beverage Process Engineering Services Revenue (USD Million) and CAGR (%) by Application (2021-2032)
7.3. Global Food and Beverage Process Engineering Services Revenue (USD Million) and CAGR (%) by Product (2021-2032)
By Type
Food
Beverage
By Application
Large Enterprises
SMEs
Chapter 8. Global Food and Beverage Process Engineering Services Regional Analysis and Outlook
8.1. Global Food and Beverage Process Engineering Services Revenue (USD Million) By Regions (2021- 2032)
8.2. North America Food and Beverage Process Engineering Services Revenue (USD Million) by Country (2021-2032)
8.2.1. United States Food and Beverage Process Engineering Services Regional Analysis and Outlook
8.2.2. Canada Food and Beverage Process Engineering Services Regional Analysis and Outlook
8.2.3. Mexico Food and Beverage Process Engineering Services Regional Analysis and Outlook
8.3. Europe Food and Beverage Process Engineering Services Revenue (USD Million), by Country (2021-2032)
8.3.1. Germany Food and Beverage Process Engineering Services Regional Analysis and Outlook
8.3.2. France Food and Beverage Process Engineering Services Regional Analysis and Outlook
8.3.3. United Kingdom Food and Beverage Process Engineering Services Regional Analysis and Outlook
8.3.4. Spain Food and Beverage Process Engineering Services Regional Analysis and Outlook
8.3.5. Italy Food and Beverage Process Engineering Services Regional Analysis and Outlook
8.3.6. Russia Food and Beverage Process Engineering Services Regional Analysis and Outlook
8.3.7. Rest of Europe Food and Beverage Process Engineering Services Regional Analysis and Outlook
8.4. Asia Pacific Food and Beverage Process Engineering Services Revenue (USD Million) by Country (2021-2032)
8.4.1. China Food and Beverage Process Engineering Services Regional Analysis and Outlook
8.4.2. Japan Food and Beverage Process Engineering Services Regional Analysis and Outlook
8.4.3. India Food and Beverage Process Engineering Services Regional Analysis and Outlook
8.4.4. South Korea Food and Beverage Process Engineering Services Regional Analysis and Outlook
8.4.5. Australia Food and Beverage Process Engineering Services Regional Analysis and Outlook
8.4.6. South East Asia Food and Beverage Process Engineering Services Regional Analysis and Outlook
8.4.7. Rest of Asia Pacific Food and Beverage Process Engineering Services Regional Analysis and Outlook
8.5. South America Food and Beverage Process Engineering Services Revenue (USD Million), by Country (2021-2032)
8.5.1. Brazil Food and Beverage Process Engineering Services Regional Analysis and Outlook
8.5.2. Argentina Food and Beverage Process Engineering Services Regional Analysis and Outlook
8.5.3. Rest of South America Food and Beverage Process Engineering Services Regional Analysis and Outlook
8.6. Middle East and Africa Food and Beverage Process Engineering Services Revenue (USD Million) by Country (2021-2032)
8.6.1. Middle East Food and Beverage Process Engineering Services Regional Analysis and Outlook
8.6.2. Africa Food and Beverage Process Engineering Services Regional Analysis and Outlook
Chapter 9. North America Food and Beverage Process Engineering Services Analysis and Outlook
9.1. North America Food and Beverage Process Engineering Services Revenue (USD Million) by Segments (2021-2032)
9.1.1. North America Food and Beverage Process Engineering Services Revenue (USD Million) by Type (2021-2032)
9.1.2. North America Food and Beverage Process Engineering Services Revenue (USD Million) by Application (2021-2032)
9.1.3. North America Food and Beverage Process Engineering Services Revenue (USD Million) by Product (2021-2032)
By Type
Food
Beverage
By Application
Large Enterprises
SMEs
Chapter 10. Europe Food and Beverage Process Engineering Services Analysis and Outlook
10.1. Europe Food and Beverage Process Engineering Services Revenue (USD Million), by Segments (USD Million) (2021-2032)
10.1.1. Europe Food and Beverage Process Engineering Services Revenue (USD Million) by Type (2021-2032)
10.1.2. Europe Food and Beverage Process Engineering Services Revenue (USD Million) by Application (2021-2032)
10.1.3. Europe Food and Beverage Process Engineering Services Revenue (USD Million) by Product (2021-2032)
By Type
Food
Beverage
By Application
Large Enterprises
SMEs
Chapter 11. Asia Pacific Food and Beverage Process Engineering Services Analysis and Outlook
11.1. Asia Pacific Food and Beverage Process Engineering Services Revenue (USD Million), and Revenue (USD Million) by Segments (2021-2032)
11.1.1. Asia Pacific Food and Beverage Process Engineering Services Revenue (USD Million) by Type (2021-2032)
11.1.2. Asia Pacific Food and Beverage Process Engineering Services Revenue (USD Million) by Application (2021-2032)
11.1.3. Asia Pacific Food and Beverage Process Engineering Services Revenue (USD Million) by Product (2021-2032)
By Type
Food
Beverage
By Application
Large Enterprises
SMEs
Chapter 12. South America Food and Beverage Process Engineering Services Analysis and Outlook
12.1. South America Food and Beverage Process Engineering Services Revenue (USD Million), by Segments (2021-2032)
12.1.1. South America Food and Beverage Process Engineering Services Revenue (USD Million) by Type (2021-2032)
12.1.2. South America Food and Beverage Process Engineering Services Revenue (USD Million) by Application (2021-2032)
12.1.3. South America Food and Beverage Process Engineering Services Revenue (USD Million) by Product (2021-2032)
By Type
Food
Beverage
By Application
Large Enterprises
SMEs
Chapter 13. Middle East and Africa Food and Beverage Process Engineering Services Analysis and Outlook
13.1. Middle East and Africa Food and Beverage Process Engineering Services Revenue (USD Million), by Segments (2021-2032)
13.1.1. Middle East and Africa Food and Beverage Process Engineering Services Revenue (USD Million) by Type (2021-2032)
13.1.2. Middle East and Africa Food and Beverage Process Engineering Services Revenue (USD Million) by Application (2021-2032)
13.1.3. Middle East and Africa Food and Beverage Process Engineering Services Revenue (USD Million) by Product (2021-2032)
By Type
Food
Beverage
By Application
Large Enterprises
SMEs
Chapter 14. Food and Beverage Process Engineering Services Company Profiles
14.1 Business Overview
14.2 Product Profiles
14.3 SWOT Profiles
14.5 Recent Developments
14.6 Financial Profile
List of Companies
Agidens
Ausenco
BPE
Early Construction
EPLAN
Matrix Technologies
Pentair
POWER Engineers
Process Engineering Associates
SEP Professional Services
Stantec
TAI
15. Methodology and Data Sources
15.1 Customization Offerings
15.2 Subscription Services
15.3 Related Reports
15.4 Publisher Expertise
LIST OF TABLES
Table 1 Market Segmentation Analysis
Table 2 Global Food and Beverage Process Engineering Services Market Share of Leading Companies, 2023
Table 3 Product Offerings of Leading Companies
Table 4 Low Growth Scenario Forecasts
Table 5 Reference Case Growth Scenario
Table 6 High Growth Case Scenario
Table 7 Global Food and Beverage Process Engineering Services Revenue (USD Million) And CAGR (%) By Type (2021-2032)
Table 8 Global Food and Beverage Process Engineering Services Revenue (USD Million) And CAGR (%) By Application (2021-2032)
Table 9 Global Food and Beverage Process Engineering Services Revenue (USD Million) And CAGR (%) By Product (2021-2032)
Table 10 Global Food and Beverage Process Engineering Services Market Revenue (USD Million) By Regions (2021-2032)
Table 11 Global Food and Beverage Process Engineering Services Market Share (%) By Regions (2021-2032)
Table 12 North America Food and Beverage Process Engineering Services Revenue (USD Million) By Country (2021-2032)
Table 13 Europe Food and Beverage Process Engineering Services Revenue (USD Million) By Country (2021-2032)
Table 14 Asia Pacific Food and Beverage Process Engineering Services Revenue (USD Million) By Country (2021-2032)
Table 15 South America Food and Beverage Process Engineering Services Revenue (USD Million) By Country (2021-2032)
Table 16 Middle East and Africa Food and Beverage Process Engineering Services Revenue (USD Million) By Region (2021-2032)
Table 17 North America Food and Beverage Process Engineering Services Revenue (USD Million) By Type (2021-2032)
Table 18 North America Food and Beverage Process Engineering Services Revenue (USD Million) By Application (2021-2032)
Table 19 North America Food and Beverage Process Engineering Services Revenue (USD Million) By Product (2021-2032)
Table 20 Europe Food and Beverage Process Engineering Services Revenue (USD Million) By Type (2021-2032)
Table 21 Europe Food and Beverage Process Engineering Services Revenue (USD Million) By Application (2021-2032)
Table 22 Europe Food and Beverage Process Engineering Services Revenue (USD Million) By Product (2021-2032)
Table 23 Asia Pacific Food and Beverage Process Engineering Services Revenue (USD Million) By Type (2021-2032)
Table 24 Asia Pacific Food and Beverage Process Engineering Services Revenue (USD Million) By Application (2021-2032)
Table 25 Asia Pacific Food and Beverage Process Engineering Services Revenue (USD Million) By Product (2021-2032)
Table 26 South America Food and Beverage Process Engineering Services Revenue (USD Million) By Type (2021-2032)
Table 27 South America Food and Beverage Process Engineering Services Revenue (USD Million) By Application (2021-2032)
Table 28 South America Food and Beverage Process Engineering Services Revenue (USD Million) By Product (2021-2032)
Table 29 Middle East and Africa Food and Beverage Process Engineering Services Revenue (USD Million) By Type (2021-2032)
Table 30 Middle East and Africa Food and Beverage Process Engineering Services Revenue (USD Million) By Application (2021-2032)
Table 31 Middle East and Africa Food and Beverage Process Engineering Services Revenue (USD Million) By Product (2021-2032)
LIST OF FIGURES
Figure 1. Market Scope
Figure 2. Pricing Forecasts Per Unit, 2023- 2032
Figure 3. Porter’s Five Forces
Figure 4. Global Food and Beverage Process Engineering Services Market Revenue (USD Million) By Regions (2021-2032)
Figure 5. Global Food and Beverage Process Engineering Services Market Share (%) By Regions (2023)
Figure 6. North America Food and Beverage Process Engineering Services Revenue (USD Million) By Country (2021-2032)
Figure 7. United States Food and Beverage Process Engineering Services Revenue (USD Million) By Country (2021-2032)
Figure 8. Canada Food and Beverage Process Engineering Services Revenue (USD Million) By Country (2021-2032)
Figure 9. Mexico Food and Beverage Process Engineering Services Revenue (USD Million) By Country (2021-2032)
Figure 10. Europe Food and Beverage Process Engineering Services Revenue (USD Million) By Country (2021-2032)
Figure 11. Germany Food and Beverage Process Engineering Services Revenue (USD Million) By Country (2021-2032)
Figure 12. France Food and Beverage Process Engineering Services Revenue (USD Million) By Country (2021-2032)
Figure 13. United Kingdom Food and Beverage Process Engineering Services Revenue (USD Million) By Country (2021-2032)
Figure 14. Spain Food and Beverage Process Engineering Services Revenue (USD Million) By Country (2021-2032)
Figure 15. Italy Food and Beverage Process Engineering Services Revenue (USD Million) By Country (2021-2032)
Figure 16. Russia Food and Beverage Process Engineering Services Revenue (USD Million) By Country (2021-2032)
Figure 17. Rest of Europe Food and Beverage Process Engineering Services Revenue (USD Million) By Country (2021-2032)
Figure 11. Asia Pacific Food and Beverage Process Engineering Services Revenue (USD Million) By Country (2021-2032)
Figure 12. China Food and Beverage Process Engineering Services Revenue (USD Million) By Country (2021-2032)
Figure 13. Japan Food and Beverage Process Engineering Services Revenue (USD Million) By Country (2021-2032)
Figure 14. India Food and Beverage Process Engineering Services Revenue (USD Million) By Country (2021-2032)
Figure 15. South Korea Food and Beverage Process Engineering Services Revenue (USD Million) By Country (2021-2032)
Figure 16. Australia Food and Beverage Process Engineering Services Revenue (USD Million) By Country (2021-2032)
Figure 17. South East Asia Food and Beverage Process Engineering Services Revenue (USD Million) By Country (2021-2032)
Figure 18. South America Food and Beverage Process Engineering Services Revenue (USD Million) By Country (2021-2032)
Figure 19. Brazil Food and Beverage Process Engineering Services Revenue (USD Million) By Country (2021-2032)
Figure 20. Argentina Food and Beverage Process Engineering Services Revenue (USD Million) By Country (2021-2032)
Figure 21. Rest of Asia Pacific Food and Beverage Process Engineering Services Revenue (USD Million) By Country (2021-2032)
Figure 22. Middle East and Africa Food and Beverage Process Engineering Services Revenue (USD Million) By Region (2021-2032)
Figure 23. Saudi Arabia Food and Beverage Process Engineering Services Revenue (USD Million) By Region (2021-2032)
Figure 24. The UAE Food and Beverage Process Engineering Services Revenue (USD Million) By Region (2021-2032)
Figure 25. Rest of Middle East Food and Beverage Process Engineering Services Revenue (USD Million) By Region (2021-2032)
Figure 26. South Africa Food and Beverage Process Engineering Services Revenue (USD Million) By Region (2021-2032)
Figure 27. Africa Food and Beverage Process Engineering Services Revenue (USD Million) By Region (2021-2032)
Figure 28. North America Food and Beverage Process Engineering Services Revenue (USD Million) By Type (2021-2032)
Figure 29. North America Food and Beverage Process Engineering Services Revenue (USD Million) By Application (2021-2032)
Figure 30. North America Food and Beverage Process Engineering Services Revenue (USD Million) By Product (2021-2032)
Figure 31. Europe Food and Beverage Process Engineering Services Revenue (USD Million) By Type (2021-2032)
Figure 32. Europe Food and Beverage Process Engineering Services Revenue (USD Million) By Application (2021-2032)
Figure 33. Europe Food and Beverage Process Engineering Services Revenue (USD Million) By Product (2021-2032)
Figure 34. Asia Pacific Food and Beverage Process Engineering Services Revenue (USD Million) By Type (2021-2032)
Figure 35. Asia Pacific Food and Beverage Process Engineering Services Revenue (USD Million) By Application (2021-2032)
Figure 36. Asia Pacific Food and Beverage Process Engineering Services Revenue (USD Million) By Product (2021-2032)
Figure 37. South America Food and Beverage Process Engineering Services Revenue (USD Million) By Type (2021-2032)
Figure 38. South America Food and Beverage Process Engineering Services Revenue (USD Million) By Application (2021-2032)
Figure 39. South America Food and Beverage Process Engineering Services Revenue (USD Million) By Product (2021-2032)
Figure 40. Middle East and Africa Food and Beverage Process Engineering Services Revenue (USD Million) By Type (2021-2032)
Figure 41. Middle East and Africa Food and Beverage Process Engineering Services Revenue (USD Million) By Application (2021-2032)
Figure 42. Middle East and Africa Food and Beverage Process Engineering Services Revenue (USD Million) By Product (2021-2032)
By Type
Food
Beverage
By Application
Large Enterprises
SMEs
Countries Analyzed
North America (US, Canada, Mexico)
Europe (Germany, UK, France, Spain, Italy, Russia, Rest of Europe)
Asia Pacific (China, India, Japan, South Korea, Australia, South East Asia, Rest of Asia)
South America (Brazil, Argentina, Rest of South America)
Middle East and Africa (Saudi Arabia, UAE, Rest of Middle East, South Africa, Egypt, Rest of Africa)
