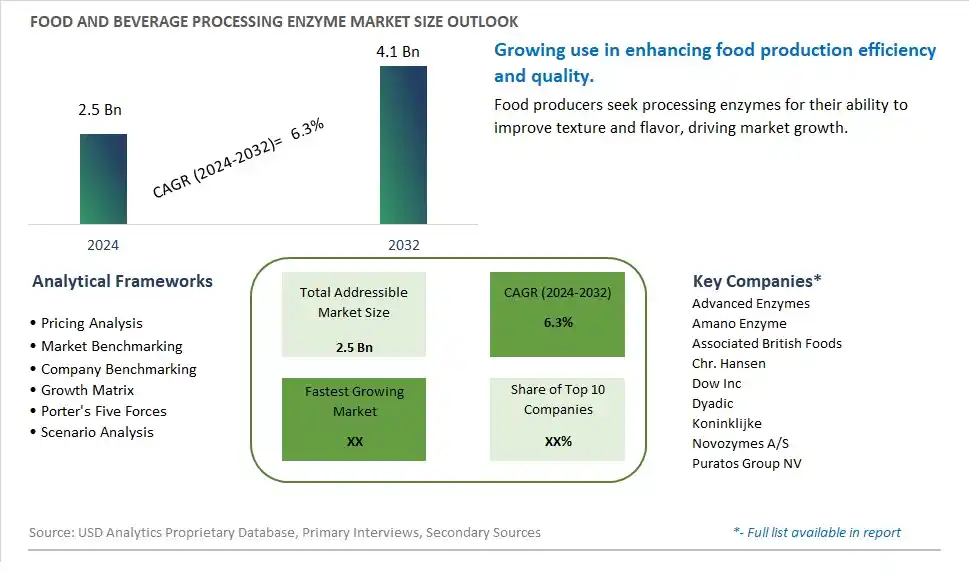
Global Food and Beverage Processing Enzyme Market Size is valued at $2.5 Billion in 2024 and is forecast to register a growth rate (CAGR) of 6.3% to reach $4.1 Billion by 2032.
The global Food and Beverage Processing Enzyme Market Comprehensive Study analyzes and forecasts the market size across 6 regions and 24 countries for diverse segments -By Type (Carbohydrase, Protease, Lipase), By Application (Beverage, Processed Food, Dairy, Bakery, Confectionery)
An Introduction to Food and Beverage Processing Enzyme Market
The Food and Beverage Processing Enzyme market in 2024 is experiencing significant growth, driven by the increasing demand for natural and efficient processing aids in the food and beverage industry. Processing enzymes, used to enhance the texture, flavor, and nutritional value of products, are essential in various applications, including baking, brewing, and dairy. The market benefits from advancements in enzyme technology, the growing trend of clean label and natural ingredients, and the expansion of the functional food and beverage sectors. Additionally, the rising awareness of the benefits of enzymes for food quality and sustainability is contributing to market growth.
Food and Beverage Processing Enzyme Competitive Landscape
The market report analyses the leading companies in the industry including Advanced Enzymes, Amano Enzyme, Associated British Foods, Chr. Hansen, Dow Inc, Dyadic, Koninklijke, Novozymes A/S, Puratos Group NV, and Others.
Food and Beverage Processing Enzyme Market Dynamics
Food and Beverage Processing Enzyme Market Trend: Demand for Natural and Sustainable Ingredients
One prominent trend in the food and beverage processing enzyme market is the increasing demand for natural and sustainable ingredients. Consumers and food manufacturers are prioritizing enzymes derived from natural sources such as plants, fungi, and microorganisms, over synthetic or chemical-based alternatives. This trend is driven by the growing awareness of health and environmental concerns, as well as the desire for clean label products with transparent ingredient lists. Enzymes offer various functionalities in food processing, including improving texture, enhancing flavor, accelerating fermentation, and reducing processing time, while aligning with sustainability goals and consumer preferences for natural, eco-friendly solutions in food and beverage formulations.
Food and Beverage Processing Enzyme Market Driver: Innovation in Food Processing and Product Development
A key driver propelling the food and beverage processing enzyme market is continuous innovation in food processing techniques and product development. Enzymes play a crucial role in optimizing manufacturing processes, increasing efficiency, and improving product quality and consistency. The driver behind this trend is the need for food manufacturers to meet consumer demands for diverse, flavorful, and nutritious products, while also addressing challenges such as shelf life extension, texture modification, and clean label requirements. Enzymes offer solutions to these challenges by enabling innovative formulations, reducing production costs, and enhancing the sensory attributes of food and beverage products, driving market growth and competitiveness.
Food and Beverage Processing Enzyme Market Opportunity: Expansion into Specialty Enzyme Applications
A significant opportunity in the food and beverage processing enzyme market lies in expanding into specialty enzyme applications that cater to specific food processing needs and emerging trends. Manufacturers can capitalize on this opportunity by developing enzymes tailored for applications such as plant-based meat alternatives, dairy alternatives, gluten-free products, functional beverages, and sustainable packaging solutions. Specialty enzymes can offer functionalities such as improving the texture of plant-based proteins, reducing bitterness in alternative dairy products, enhancing the stability of functional beverages, or facilitating biodegradation of packaging materials. By focusing on specialty enzyme development and addressing evolving market demands, companies can diversify their product portfolios, capture niche segments, and drive innovation in the dynamic food and beverage processing enzyme industry.
Food and Beverage Processing Enzyme Market Share Analysis: Carbohydrase segment generated the highest revenue share in the industry
In the Food and Beverage Processing Enzyme Market, the Carbohydrase segment emerges as the largest. Carbohydrases play a crucial role in food processing by breaking down complex carbohydrates into simpler sugars, facilitating easier digestion, enhancing texture, and improving product consistency. They find extensive applications in various food and beverage products, including bread, beer, fruit juices, and processed foods. The demand for carbohydrases is driven by the growing consumer preference for natural and clean-label ingredients, as carbohydrases enable manufacturers to reduce sugar content, improve nutritional profiles, and achieve desired product textures without compromising taste or quality.
Food and Beverage Processing Enzyme Market Share Analysis: Beverage Application is the fastest growing segment over the forecast period to 2032
Among the segments in the Food and Beverage Processing Enzyme Market, the Beverage application is experiencing the fastest growth trajectory up to 2032. Enzymes are increasingly utilized in beverage production to enhance process efficiency, flavor development, and product quality. In beverages like juices, wines, and beer, enzymes aid in clarifying liquids, reducing cloudiness, and improving overall clarity and stability. Further, enzymes are pivotal in brewing processes for modifying flavors, reducing fermentation time, and optimizing production costs. The expanding demand for enzymatic solutions in the beverage industry reflects ongoing innovations in enzymology and the continuous quest for sustainable and cost-effective production methods in the beverage sector.
Food and Beverage Processing Enzyme Market Segmentation
By Type
Carbohydrase
Protease
Lipase
By Application
Beverage
Processed Food
Dairy
Bakery
Confectionery
Countries Analyzed
North America (US, Canada, Mexico)
Europe (Germany, UK, France, Spain, Italy, Russia, Rest of Europe)
Asia Pacific (China, India, Japan, South Korea, Australia, South East Asia, Rest of Asia)
South America (Brazil, Argentina, Rest of South America)
Middle East and Africa (Saudi Arabia, UAE, Rest of Middle East, South Africa, Egypt, Rest of Africa)
Food and Beverage Processing Enzyme Companies Profiled in the Study
Advanced Enzymes
Amano Enzyme
Associated British Foods
Chr. Hansen
Dow Inc
Dyadic
Koninklijke
Novozymes A/S
Puratos Group NV
*- List Not Exhaustive
Chapter 1. TABLE OF CONTENTS
Chapter 2. Introduction to Food and Beverage Processing Enzyme Market
2.1. Market Overview
2.2. Key Statistics and Report Highlights
2.3. Scope of the Comprehensive Study
2.3.1. Market Definition
2.3.2 Countries and Regions Covered
2.3.3 Research Objective
2.3.4 Units, Currency, and Conversions
2.3.5 Industry Value Chain
2.4. Key Market Segments
2.5. Key Companies
2.6. Study Period
Chapter 3. Strategic Analysis Review
3.1. Food and Beverage Processing Enzyme Pricing Analysis and Forecast
3.2. Porter’s Five Forces
3.3. Market Ecosystem
3.4. SWOT Analysis
3.5. Regulatory Scenario
3.3. Effects of Inflation, Russia-Ukraine War, moderating economic growth, and other macroeconomic factors
Chapter 4. Competitive Landscape
4.1. Market Share Analysis
4.1.1. Global Food and Beverage Processing Enzyme Market Share by Company, 2023
4.1.2. Product Offerings of Leading Food and Beverage Processing Enzyme Companies
4.2. Market Entropy
4.2.1. New Product Launches in the Industry
4.2.2. Mergers, Acquisitions, Joint ventures, and Partnerships
4.3. Key Strategies and Best Practices
Chapter 5. Global Market Projections: Best, Reference, and Low Case Scenarios
5.1. Growth Analysis- Case Scenario Definitions
5.2. Low Growth Case Scenario Forecasts
5.3. Reference Growth Case Scenario Forecasts
5.4. High Growth Case Scenario Forecasts
Chapter 6. Market Dynamics
6.1. Food and Beverage Processing Enzyme Market Drivers
6.2. Food and Beverage Processing Enzyme Market Challenges
6.6. Food and Beverage Processing Enzyme Market Opportunities
6.4. Food and Beverage Processing Enzyme Market Trends
Chapter 7. Global Food and Beverage Processing Enzyme Market Outlook Trends
7.1. Global Food and Beverage Processing Enzyme Revenue (USD Million) and CAGR (%) by Type (2021-2032)
7.2. Global Food and Beverage Processing Enzyme Revenue (USD Million) and CAGR (%) by Application (2021-2032)
7.3. Global Food and Beverage Processing Enzyme Revenue (USD Million) and CAGR (%) by Product (2021-2032)
By Type
Carbohydrase
Protease
Lipase
By Application
Beverage
Processed Food
Dairy
Bakery
Confectionery
Chapter 8. Global Food and Beverage Processing Enzyme Regional Analysis and Outlook
8.1. Global Food and Beverage Processing Enzyme Revenue (USD Million) By Regions (2021- 2032)
8.2. North America Food and Beverage Processing Enzyme Revenue (USD Million) by Country (2021-2032)
8.2.1. United States Food and Beverage Processing Enzyme Regional Analysis and Outlook
8.2.2. Canada Food and Beverage Processing Enzyme Regional Analysis and Outlook
8.2.3. Mexico Food and Beverage Processing Enzyme Regional Analysis and Outlook
8.3. Europe Food and Beverage Processing Enzyme Revenue (USD Million), by Country (2021-2032)
8.3.1. Germany Food and Beverage Processing Enzyme Regional Analysis and Outlook
8.3.2. France Food and Beverage Processing Enzyme Regional Analysis and Outlook
8.3.3. United Kingdom Food and Beverage Processing Enzyme Regional Analysis and Outlook
8.3.4. Spain Food and Beverage Processing Enzyme Regional Analysis and Outlook
8.3.5. Italy Food and Beverage Processing Enzyme Regional Analysis and Outlook
8.3.6. Russia Food and Beverage Processing Enzyme Regional Analysis and Outlook
8.3.7. Rest of Europe Food and Beverage Processing Enzyme Regional Analysis and Outlook
8.4. Asia Pacific Food and Beverage Processing Enzyme Revenue (USD Million) by Country (2021-2032)
8.4.1. China Food and Beverage Processing Enzyme Regional Analysis and Outlook
8.4.2. Japan Food and Beverage Processing Enzyme Regional Analysis and Outlook
8.4.3. India Food and Beverage Processing Enzyme Regional Analysis and Outlook
8.4.4. South Korea Food and Beverage Processing Enzyme Regional Analysis and Outlook
8.4.5. Australia Food and Beverage Processing Enzyme Regional Analysis and Outlook
8.4.6. South East Asia Food and Beverage Processing Enzyme Regional Analysis and Outlook
8.4.7. Rest of Asia Pacific Food and Beverage Processing Enzyme Regional Analysis and Outlook
8.5. South America Food and Beverage Processing Enzyme Revenue (USD Million), by Country (2021-2032)
8.5.1. Brazil Food and Beverage Processing Enzyme Regional Analysis and Outlook
8.5.2. Argentina Food and Beverage Processing Enzyme Regional Analysis and Outlook
8.5.3. Rest of South America Food and Beverage Processing Enzyme Regional Analysis and Outlook
8.6. Middle East and Africa Food and Beverage Processing Enzyme Revenue (USD Million) by Country (2021-2032)
8.6.1. Middle East Food and Beverage Processing Enzyme Regional Analysis and Outlook
8.6.2. Africa Food and Beverage Processing Enzyme Regional Analysis and Outlook
Chapter 9. North America Food and Beverage Processing Enzyme Analysis and Outlook
9.1. North America Food and Beverage Processing Enzyme Revenue (USD Million) by Segments (2021-2032)
9.1.1. North America Food and Beverage Processing Enzyme Revenue (USD Million) by Type (2021-2032)
9.1.2. North America Food and Beverage Processing Enzyme Revenue (USD Million) by Application (2021-2032)
9.1.3. North America Food and Beverage Processing Enzyme Revenue (USD Million) by Product (2021-2032)
By Type
Carbohydrase
Protease
Lipase
By Application
Beverage
Processed Food
Dairy
Bakery
Confectionery
Chapter 10. Europe Food and Beverage Processing Enzyme Analysis and Outlook
10.1. Europe Food and Beverage Processing Enzyme Revenue (USD Million), by Segments (USD Million) (2021-2032)
10.1.1. Europe Food and Beverage Processing Enzyme Revenue (USD Million) by Type (2021-2032)
10.1.2. Europe Food and Beverage Processing Enzyme Revenue (USD Million) by Application (2021-2032)
10.1.3. Europe Food and Beverage Processing Enzyme Revenue (USD Million) by Product (2021-2032)
By Type
Carbohydrase
Protease
Lipase
By Application
Beverage
Processed Food
Dairy
Bakery
Confectionery
Chapter 11. Asia Pacific Food and Beverage Processing Enzyme Analysis and Outlook
11.1. Asia Pacific Food and Beverage Processing Enzyme Revenue (USD Million), and Revenue (USD Million) by Segments (2021-2032)
11.1.1. Asia Pacific Food and Beverage Processing Enzyme Revenue (USD Million) by Type (2021-2032)
11.1.2. Asia Pacific Food and Beverage Processing Enzyme Revenue (USD Million) by Application (2021-2032)
11.1.3. Asia Pacific Food and Beverage Processing Enzyme Revenue (USD Million) by Product (2021-2032)
By Type
Carbohydrase
Protease
Lipase
By Application
Beverage
Processed Food
Dairy
Bakery
Confectionery
Chapter 12. South America Food and Beverage Processing Enzyme Analysis and Outlook
12.1. South America Food and Beverage Processing Enzyme Revenue (USD Million), by Segments (2021-2032)
12.1.1. South America Food and Beverage Processing Enzyme Revenue (USD Million) by Type (2021-2032)
12.1.2. South America Food and Beverage Processing Enzyme Revenue (USD Million) by Application (2021-2032)
12.1.3. South America Food and Beverage Processing Enzyme Revenue (USD Million) by Product (2021-2032)
By Type
Carbohydrase
Protease
Lipase
By Application
Beverage
Processed Food
Dairy
Bakery
Confectionery
Chapter 13. Middle East and Africa Food and Beverage Processing Enzyme Analysis and Outlook
13.1. Middle East and Africa Food and Beverage Processing Enzyme Revenue (USD Million), by Segments (2021-2032)
13.1.1. Middle East and Africa Food and Beverage Processing Enzyme Revenue (USD Million) by Type (2021-2032)
13.1.2. Middle East and Africa Food and Beverage Processing Enzyme Revenue (USD Million) by Application (2021-2032)
13.1.3. Middle East and Africa Food and Beverage Processing Enzyme Revenue (USD Million) by Product (2021-2032)
By Type
Carbohydrase
Protease
Lipase
By Application
Beverage
Processed Food
Dairy
Bakery
Confectionery
Chapter 14. Food and Beverage Processing Enzyme Company Profiles
14.1 Business Overview
14.2 Product Profiles
14.3 SWOT Profiles
14.5 Recent Developments
14.6 Financial Profile
List of Companies
Advanced Enzymes
Amano Enzyme
Associated British Foods
Chr. Hansen
Dow Inc
Dyadic
Koninklijke
Novozymes A/S
Puratos Group NV
15. Methodology and Data Sources
15.1 Customization Offerings
15.2 Subscription Services
15.3 Related Reports
15.4 Publisher Expertise
LIST OF TABLES
Table 1 Market Segmentation Analysis
Table 2 Global Food and Beverage Processing Enzyme Market Share of Leading Companies, 2023
Table 3 Product Offerings of Leading Companies
Table 4 Low Growth Scenario Forecasts
Table 5 Reference Case Growth Scenario
Table 6 High Growth Case Scenario
Table 7 Global Food and Beverage Processing Enzyme Revenue (USD Million) And CAGR (%) By Type (2021-2032)
Table 8 Global Food and Beverage Processing Enzyme Revenue (USD Million) And CAGR (%) By Application (2021-2032)
Table 9 Global Food and Beverage Processing Enzyme Revenue (USD Million) And CAGR (%) By Product (2021-2032)
Table 10 Global Food and Beverage Processing Enzyme Market Revenue (USD Million) By Regions (2021-2032)
Table 11 Global Food and Beverage Processing Enzyme Market Share (%) By Regions (2021-2032)
Table 12 North America Food and Beverage Processing Enzyme Revenue (USD Million) By Country (2021-2032)
Table 13 Europe Food and Beverage Processing Enzyme Revenue (USD Million) By Country (2021-2032)
Table 14 Asia Pacific Food and Beverage Processing Enzyme Revenue (USD Million) By Country (2021-2032)
Table 15 South America Food and Beverage Processing Enzyme Revenue (USD Million) By Country (2021-2032)
Table 16 Middle East and Africa Food and Beverage Processing Enzyme Revenue (USD Million) By Region (2021-2032)
Table 17 North America Food and Beverage Processing Enzyme Revenue (USD Million) By Type (2021-2032)
Table 18 North America Food and Beverage Processing Enzyme Revenue (USD Million) By Application (2021-2032)
Table 19 North America Food and Beverage Processing Enzyme Revenue (USD Million) By Product (2021-2032)
Table 20 Europe Food and Beverage Processing Enzyme Revenue (USD Million) By Type (2021-2032)
Table 21 Europe Food and Beverage Processing Enzyme Revenue (USD Million) By Application (2021-2032)
Table 22 Europe Food and Beverage Processing Enzyme Revenue (USD Million) By Product (2021-2032)
Table 23 Asia Pacific Food and Beverage Processing Enzyme Revenue (USD Million) By Type (2021-2032)
Table 24 Asia Pacific Food and Beverage Processing Enzyme Revenue (USD Million) By Application (2021-2032)
Table 25 Asia Pacific Food and Beverage Processing Enzyme Revenue (USD Million) By Product (2021-2032)
Table 26 South America Food and Beverage Processing Enzyme Revenue (USD Million) By Type (2021-2032)
Table 27 South America Food and Beverage Processing Enzyme Revenue (USD Million) By Application (2021-2032)
Table 28 South America Food and Beverage Processing Enzyme Revenue (USD Million) By Product (2021-2032)
Table 29 Middle East and Africa Food and Beverage Processing Enzyme Revenue (USD Million) By Type (2021-2032)
Table 30 Middle East and Africa Food and Beverage Processing Enzyme Revenue (USD Million) By Application (2021-2032)
Table 31 Middle East and Africa Food and Beverage Processing Enzyme Revenue (USD Million) By Product (2021-2032)
LIST OF FIGURES
Figure 1. Market Scope
Figure 2. Pricing Forecasts Per Unit, 2023- 2032
Figure 3. Porter’s Five Forces
Figure 4. Global Food and Beverage Processing Enzyme Market Revenue (USD Million) By Regions (2021-2032)
Figure 5. Global Food and Beverage Processing Enzyme Market Share (%) By Regions (2023)
Figure 6. North America Food and Beverage Processing Enzyme Revenue (USD Million) By Country (2021-2032)
Figure 7. United States Food and Beverage Processing Enzyme Revenue (USD Million) By Country (2021-2032)
Figure 8. Canada Food and Beverage Processing Enzyme Revenue (USD Million) By Country (2021-2032)
Figure 9. Mexico Food and Beverage Processing Enzyme Revenue (USD Million) By Country (2021-2032)
Figure 10. Europe Food and Beverage Processing Enzyme Revenue (USD Million) By Country (2021-2032)
Figure 11. Germany Food and Beverage Processing Enzyme Revenue (USD Million) By Country (2021-2032)
Figure 12. France Food and Beverage Processing Enzyme Revenue (USD Million) By Country (2021-2032)
Figure 13. United Kingdom Food and Beverage Processing Enzyme Revenue (USD Million) By Country (2021-2032)
Figure 14. Spain Food and Beverage Processing Enzyme Revenue (USD Million) By Country (2021-2032)
Figure 15. Italy Food and Beverage Processing Enzyme Revenue (USD Million) By Country (2021-2032)
Figure 16. Russia Food and Beverage Processing Enzyme Revenue (USD Million) By Country (2021-2032)
Figure 17. Rest of Europe Food and Beverage Processing Enzyme Revenue (USD Million) By Country (2021-2032)
Figure 11. Asia Pacific Food and Beverage Processing Enzyme Revenue (USD Million) By Country (2021-2032)
Figure 12. China Food and Beverage Processing Enzyme Revenue (USD Million) By Country (2021-2032)
Figure 13. Japan Food and Beverage Processing Enzyme Revenue (USD Million) By Country (2021-2032)
Figure 14. India Food and Beverage Processing Enzyme Revenue (USD Million) By Country (2021-2032)
Figure 15. South Korea Food and Beverage Processing Enzyme Revenue (USD Million) By Country (2021-2032)
Figure 16. Australia Food and Beverage Processing Enzyme Revenue (USD Million) By Country (2021-2032)
Figure 17. South East Asia Food and Beverage Processing Enzyme Revenue (USD Million) By Country (2021-2032)
Figure 18. South America Food and Beverage Processing Enzyme Revenue (USD Million) By Country (2021-2032)
Figure 19. Brazil Food and Beverage Processing Enzyme Revenue (USD Million) By Country (2021-2032)
Figure 20. Argentina Food and Beverage Processing Enzyme Revenue (USD Million) By Country (2021-2032)
Figure 21. Rest of Asia Pacific Food and Beverage Processing Enzyme Revenue (USD Million) By Country (2021-2032)
Figure 22. Middle East and Africa Food and Beverage Processing Enzyme Revenue (USD Million) By Region (2021-2032)
Figure 23. Saudi Arabia Food and Beverage Processing Enzyme Revenue (USD Million) By Region (2021-2032)
Figure 24. The UAE Food and Beverage Processing Enzyme Revenue (USD Million) By Region (2021-2032)
Figure 25. Rest of Middle East Food and Beverage Processing Enzyme Revenue (USD Million) By Region (2021-2032)
Figure 26. South Africa Food and Beverage Processing Enzyme Revenue (USD Million) By Region (2021-2032)
Figure 27. Africa Food and Beverage Processing Enzyme Revenue (USD Million) By Region (2021-2032)
Figure 28. North America Food and Beverage Processing Enzyme Revenue (USD Million) By Type (2021-2032)
Figure 29. North America Food and Beverage Processing Enzyme Revenue (USD Million) By Application (2021-2032)
Figure 30. North America Food and Beverage Processing Enzyme Revenue (USD Million) By Product (2021-2032)
Figure 31. Europe Food and Beverage Processing Enzyme Revenue (USD Million) By Type (2021-2032)
Figure 32. Europe Food and Beverage Processing Enzyme Revenue (USD Million) By Application (2021-2032)
Figure 33. Europe Food and Beverage Processing Enzyme Revenue (USD Million) By Product (2021-2032)
Figure 34. Asia Pacific Food and Beverage Processing Enzyme Revenue (USD Million) By Type (2021-2032)
Figure 35. Asia Pacific Food and Beverage Processing Enzyme Revenue (USD Million) By Application (2021-2032)
Figure 36. Asia Pacific Food and Beverage Processing Enzyme Revenue (USD Million) By Product (2021-2032)
Figure 37. South America Food and Beverage Processing Enzyme Revenue (USD Million) By Type (2021-2032)
Figure 38. South America Food and Beverage Processing Enzyme Revenue (USD Million) By Application (2021-2032)
Figure 39. South America Food and Beverage Processing Enzyme Revenue (USD Million) By Product (2021-2032)
Figure 40. Middle East and Africa Food and Beverage Processing Enzyme Revenue (USD Million) By Type (2021-2032)
Figure 41. Middle East and Africa Food and Beverage Processing Enzyme Revenue (USD Million) By Application (2021-2032)
Figure 42. Middle East and Africa Food and Beverage Processing Enzyme Revenue (USD Million) By Product (2021-2032)
By Type
Carbohydrase
Protease
Lipase
By Application
Beverage
Processed Food
Dairy
Bakery
Confectionery
Countries Analyzed
North America (US, Canada, Mexico)
Europe (Germany, UK, France, Spain, Italy, Russia, Rest of Europe)
Asia Pacific (China, India, Japan, South Korea, Australia, South East Asia, Rest of Asia)
South America (Brazil, Argentina, Rest of South America)
Middle East and Africa (Saudi Arabia, UAE, Rest of Middle East, South Africa, Egypt, Rest of Africa)
