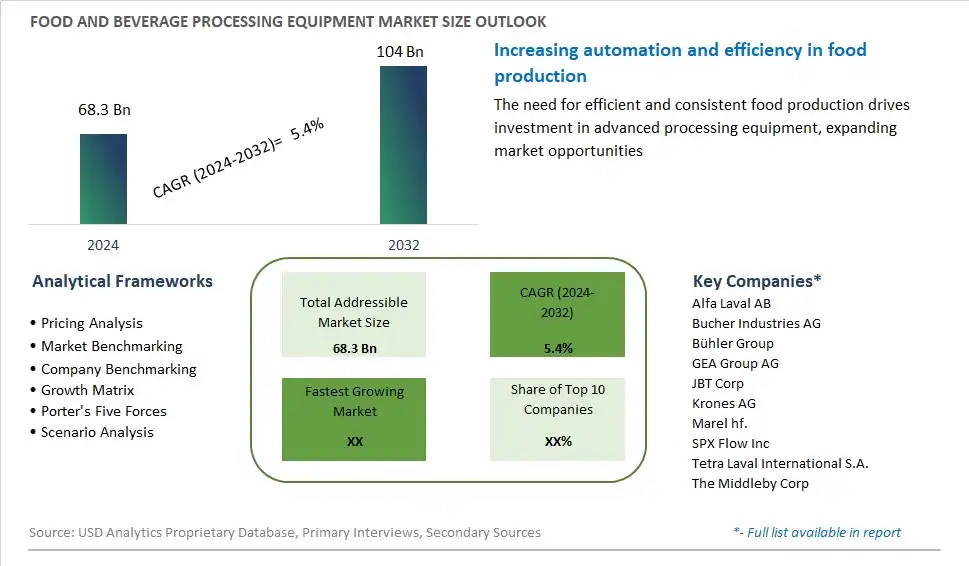
Global Food and Beverage Processing Equipment Market Size is valued at $68.3 Billion in 2024 and is forecast to register a growth rate (CAGR) of 5.4% to reach $104 Billion by 2032.
The global Food and Beverage Processing Equipment Market Comprehensive Study analyzes and forecasts the market size across 6 regions and 24 countries for diverse segments -By Type (Pre-Processing, -Sorting & Grading, -Cutting, Peeling, Grinding, Slicing, Washing, Processing, Cooling, Freezing), By Application (Bakery & confectionery products, Meat & poultry, Dairy products, Fish & seafood, Alcoholic beverages, Non-alcoholic beverages, Others), By End Product Form (Solid, Liquid, Semi-solid), By Mode of Operation (Semi-automatic, Automatic)
An Introduction to Food and Beverage Processing Equipment Market
Food and beverage processing equipment encompasses a wide range of machinery and systems used in the production, processing, and packaging of food and beverage products in 2024. From mixing and cooking to filling and packaging, processing equipment plays a critical role in transforming raw ingredients into finished products that meet consumer expectations for taste, quality, and safety. With advancements in automation, sanitation, and energy efficiency, modern processing equipment offers increased productivity, reliability, and flexibility, enabling manufacturers to optimize production processes while minimizing waste and downtime. Whether producing baked goods, dairy products, snacks, or beverages, food and beverage manufacturers rely on specialized equipment such as mixers, ovens, pasteurizers, and fillers to achieve consistent product quality and meet regulatory standards. As consumer preferences for convenient, healthy, and sustainable food and beverage options grow, the market for processing equipment is expected to expand, driven by investments in technology, innovation, and capacity expansion that enable manufacturers to meet evolving market demands and trends.
Food and Beverage Processing Equipment Competitive Landscape
The market report analyses the leading companies in the industry including Alfa Laval AB, Bucher Industries AG, Bühler Group, GEA Group AG, JBT Corp, Krones AG, Marel hf., SPX Flow Inc, Tetra Laval International S.A., The Middleby Corp, and Others.
Food and Beverage Processing Equipment Market Dynamics
Food and Beverage Processing Equipment Market Trend: Automation and Industry 4.0 Integration
A prominent trend in the food and beverage processing equipment market is the increasing adoption of automation and integration of Industry 4.0 technologies. As manufacturers strive for greater efficiency, productivity, and consistency in their production processes, there is a growing demand for advanced processing equipment equipped with automation features such as robotics, artificial intelligence, and Internet of Things (IoT) connectivity. Automation enables seamless integration and synchronization of various processing stages, leading to optimized production workflows, reduced labor costs, and enhanced product quality and safety. Furthermore, Industry 4.0 integration allows for real-time monitoring, data analytics, and predictive maintenance, enabling proactive decision-making and operational improvements across the food and beverage processing value chain.
Market Driver: Stringent Food Safety and Quality Regulations
A key driver propelling the food and beverage processing equipment market is the stringent regulatory requirements governing food safety and quality standards. With increasing concerns over foodborne illnesses, contamination, and product recalls, regulatory bodies worldwide are imposing stricter guidelines and standards on food processing and manufacturing practices. Compliance with these regulations necessitates the use of technologically advanced processing equipment capable of ensuring hygienic processing conditions, contamination control, and traceability throughout the production process. Consequently, food and beverage manufacturers are investing in state-of-the-art processing equipment to meet regulatory requirements, maintain consumer trust, and safeguard brand reputation, thereby driving the demand for innovative and compliant processing solutions.
Market Opportunity: Customization and Modular Solutions
An opportunity within the food and beverage processing equipment market lies in the provision of customizable and modular solutions tailored to specific industry needs and production requirements. As the food and beverage landscape continues to evolve with changing consumer preferences, product diversification, and emerging trends, manufacturers seek versatile processing equipment that can adapt to varying production demands and accommodate product innovation. Offering customizable and modular processing solutions enables equipment suppliers to cater to diverse applications, production scales, and product types, providing flexibility, scalability, and cost-effectiveness to food and beverage producers. By delivering tailored solutions that align with customers' unique processing challenges and objectives, equipment manufacturers can capitalize on the opportunity to forge long-term partnerships, drive customer satisfaction, and capture a larger share of the market.
Food and Beverage Processing Equipment Market Share Analysis: Processing Equipment held the dominant market share in 2024
Within the Food and Beverage Processing Equipment market segmented by Type, the Processing segment is the largest category. This dominance is due to the critical role processing equipment plays in transforming raw ingredients into finished food and beverage products. Processing equipment encompasses a wide range of machinery and systems, including mixing, cooking, blending, and packaging equipment, providing comprehensive solutions for food and beverage manufacturers. Additionally, advancements in processing technology, such as automation, digitalization, and hygienic design, enhance operational efficiency, product quality, and regulatory compliance, further driving the demand for processing equipment. Further, the growing complexity of food processing operations, evolving consumer preferences, and increasing demand for convenience and ready-to-eat products propel the adoption of advanced processing solutions. As food and beverage manufacturers seek to optimize production processes, ensure product safety, and meet evolving market trends, the Processing Equipment segment remains at the forefront, driving growth and innovation in the Food and Beverage Processing Equipment market.
Food and Beverage Processing Equipment Market Share Analysis: Meat & Poultry Application market is poised to register the fastest growth rae over the forecast period to 2032
In the Food and Beverage Processing Equipment market segmented by Application, the Meat & Poultry segment is the fastest-growing category. This accelerated growth is propelled by several factors, including increasing global meat consumption, rising demand for processed meat products, and the need for advanced processing technologies to enhance efficiency and product quality. With the growing population and changing dietary preferences towards protein-rich diets, the meat and poultry industry faces escalating production demands, driving the adoption of sophisticated processing equipment. Additionally, stringent food safety regulations and the need for hygienic processing practices further incentivize investments in modern processing technologies. Further, consumer preferences for convenience, variety, and value-added meat products fuel the demand for equipment capable of processing diverse meat cuts and formulations. As meat and poultry processors strive to meet evolving market demands while ensuring product safety and quality, the Meat & Poultry application segment continues to witness rapid growth, underscoring its significance in driving innovation and expansion within the Food and Beverage Processing Equipment market.
Food and Beverage Processing Equipment Market Share Analysis: Solid End Product Form held the dominant market share in 2024
In the Food and Beverage Processing Equipment market segmented by End Product Form, the Solid segment is the largest category. This dominance is attributed to the extensive use of processing equipment in the production of a wide range of solid food products, including snacks, baked goods, cereals, confectionery, and processed meats. Solid food products offer versatility, convenience, and a longer shelf life, making them popular choices among consumers worldwide. Additionally, advancements in processing technology enable manufacturers to efficiently handle and process solid ingredients, ensuring uniformity, quality, and safety in the final products. Further, the growing demand for ready-to-eat and convenience foods, coupled with the increasing consumption of snacks and bakery items, drives the adoption of processing equipment tailored for solid end product forms. As food manufacturers continue to innovate and diversify their product portfolios to meet evolving consumer preferences, the Solid segment maintains its leadership position in the Food and Beverage Processing Equipment market, driving growth and innovation across various food categories.
Food and Beverage Processing Equipment Market Segmentation
By Type
Pre-Processing
-Sorting & Grading
-Cutting
Peeling
Grinding
Slicing
Washing
Processing
-Forming
-Extruding
-Coating
-Drying
Cooling
Freezing
-Thermal
-Homogenization
-Filtration
-Pressing
By Application
Bakery & confectionery products
Meat & poultry
Dairy products
Fish & seafood
Alcoholic beverages
Non-alcoholic beverages
Others
By End Product Form
Solid
Liquid
Semi-solid
By Mode of Operation
Semi-automatic
Automatic
Countries Analyzed
North America (US, Canada, Mexico)
Europe (Germany, UK, France, Spain, Italy, Russia, Rest of Europe)
Asia Pacific (China, India, Japan, South Korea, Australia, South East Asia, Rest of Asia)
South America (Brazil, Argentina, Rest of South America)
Middle East and Africa (Saudi Arabia, UAE, Rest of Middle East, South Africa, Egypt, Rest of Africa)
Food and Beverage Processing Equipment Companies Profiled in the Study
Alfa Laval AB
Bucher Industries AG
Bühler Group
GEA Group AG
JBT Corp
Krones AG
Marel hf.
SPX Flow Inc
Tetra Laval International S.A.
The Middleby Corp
*- List Not Exhaustive
Chapter 1. TABLE OF CONTENTS
Chapter 2. Introduction to Food and Beverage Processing Equipment Market
2.1. Market Overview
2.2. Key Statistics and Report Highlights
2.3. Scope of the Comprehensive Study
2.3.1. Market Definition
2.3.2 Countries and Regions Covered
2.3.3 Research Objective
2.3.4 Units, Currency, and Conversions
2.3.5 Industry Value Chain
2.4. Key Market Segments
2.5. Key Companies
2.6. Study Period
Chapter 3. Strategic Analysis Review
3.1. Food and Beverage Processing Equipment Pricing Analysis and Forecast
3.2. Porter’s Five Forces
3.3. Market Ecosystem
3.4. SWOT Analysis
3.5. Regulatory Scenario
3.3. Effects of Inflation, Russia-Ukraine War, moderating economic growth, and other macroeconomic factors
Chapter 4. Competitive Landscape
4.1. Market Share Analysis
4.1.1. Global Food and Beverage Processing Equipment Market Share by Company, 2023
4.1.2. Product Offerings of Leading Food and Beverage Processing Equipment Companies
4.2. Market Entropy
4.2.1. New Product Launches in the Industry
4.2.2. Mergers, Acquisitions, Joint ventures, and Partnerships
4.3. Key Strategies and Best Practices
Chapter 5. Global Market Projections: Best, Reference, and Low Case Scenarios
5.1. Growth Analysis- Case Scenario Definitions
5.2. Low Growth Case Scenario Forecasts
5.3. Reference Growth Case Scenario Forecasts
5.4. High Growth Case Scenario Forecasts
Chapter 6. Market Dynamics
6.1. Food and Beverage Processing Equipment Market Drivers
6.2. Food and Beverage Processing Equipment Market Challenges
6.6. Food and Beverage Processing Equipment Market Opportunities
6.4. Food and Beverage Processing Equipment Market Trends
Chapter 7. Global Food and Beverage Processing Equipment Market Outlook Trends
7.1. Global Food and Beverage Processing Equipment Revenue (USD Million) and CAGR (%) by Type (2021-2032)
7.2. Global Food and Beverage Processing Equipment Revenue (USD Million) and CAGR (%) by Application (2021-2032)
7.3. Global Food and Beverage Processing Equipment Revenue (USD Million) and CAGR (%) by Product (2021-2032)
By Type
Pre-Processing
-Sorting & Grading
-Cutting
Peeling
Grinding
Slicing
Washing
Processing
-Forming
-Extruding
-Coating
-Drying
Cooling
Freezing
-Thermal
-Homogenization
-Filtration
-Pressing
By Application
Bakery & confectionery products
Meat & poultry
Dairy products
Fish & seafood
Alcoholic beverages
Non-alcoholic beverages
Others
By End Product Form
Solid
Liquid
Semi-solid
By Mode of Operation
Semi-automatic
Automatic
Chapter 8. Global Food and Beverage Processing Equipment Regional Analysis and Outlook
8.1. Global Food and Beverage Processing Equipment Revenue (USD Million) By Regions (2021- 2032)
8.2. North America Food and Beverage Processing Equipment Revenue (USD Million) by Country (2021-2032)
8.2.1. United States Food and Beverage Processing Equipment Regional Analysis and Outlook
8.2.2. Canada Food and Beverage Processing Equipment Regional Analysis and Outlook
8.2.3. Mexico Food and Beverage Processing Equipment Regional Analysis and Outlook
8.3. Europe Food and Beverage Processing Equipment Revenue (USD Million), by Country (2021-2032)
8.3.1. Germany Food and Beverage Processing Equipment Regional Analysis and Outlook
8.3.2. France Food and Beverage Processing Equipment Regional Analysis and Outlook
8.3.3. United Kingdom Food and Beverage Processing Equipment Regional Analysis and Outlook
8.3.4. Spain Food and Beverage Processing Equipment Regional Analysis and Outlook
8.3.5. Italy Food and Beverage Processing Equipment Regional Analysis and Outlook
8.3.6. Russia Food and Beverage Processing Equipment Regional Analysis and Outlook
8.3.7. Rest of Europe Food and Beverage Processing Equipment Regional Analysis and Outlook
8.4. Asia Pacific Food and Beverage Processing Equipment Revenue (USD Million) by Country (2021-2032)
8.4.1. China Food and Beverage Processing Equipment Regional Analysis and Outlook
8.4.2. Japan Food and Beverage Processing Equipment Regional Analysis and Outlook
8.4.3. India Food and Beverage Processing Equipment Regional Analysis and Outlook
8.4.4. South Korea Food and Beverage Processing Equipment Regional Analysis and Outlook
8.4.5. Australia Food and Beverage Processing Equipment Regional Analysis and Outlook
8.4.6. South East Asia Food and Beverage Processing Equipment Regional Analysis and Outlook
8.4.7. Rest of Asia Pacific Food and Beverage Processing Equipment Regional Analysis and Outlook
8.5. South America Food and Beverage Processing Equipment Revenue (USD Million), by Country (2021-2032)
8.5.1. Brazil Food and Beverage Processing Equipment Regional Analysis and Outlook
8.5.2. Argentina Food and Beverage Processing Equipment Regional Analysis and Outlook
8.5.3. Rest of South America Food and Beverage Processing Equipment Regional Analysis and Outlook
8.6. Middle East and Africa Food and Beverage Processing Equipment Revenue (USD Million) by Country (2021-2032)
8.6.1. Middle East Food and Beverage Processing Equipment Regional Analysis and Outlook
8.6.2. Africa Food and Beverage Processing Equipment Regional Analysis and Outlook
Chapter 9. North America Food and Beverage Processing Equipment Analysis and Outlook
9.1. North America Food and Beverage Processing Equipment Revenue (USD Million) by Segments (2021-2032)
9.1.1. North America Food and Beverage Processing Equipment Revenue (USD Million) by Type (2021-2032)
9.1.2. North America Food and Beverage Processing Equipment Revenue (USD Million) by Application (2021-2032)
9.1.3. North America Food and Beverage Processing Equipment Revenue (USD Million) by Product (2021-2032)
By Type
Pre-Processing
-Sorting & Grading
-Cutting
Peeling
Grinding
Slicing
Washing
Processing
-Forming
-Extruding
-Coating
-Drying
Cooling
Freezing
-Thermal
-Homogenization
-Filtration
-Pressing
By Application
Bakery & confectionery products
Meat & poultry
Dairy products
Fish & seafood
Alcoholic beverages
Non-alcoholic beverages
Others
By End Product Form
Solid
Liquid
Semi-solid
By Mode of Operation
Semi-automatic
Automatic
Chapter 10. Europe Food and Beverage Processing Equipment Analysis and Outlook
10.1. Europe Food and Beverage Processing Equipment Revenue (USD Million), by Segments (USD Million) (2021-2032)
10.1.1. Europe Food and Beverage Processing Equipment Revenue (USD Million) by Type (2021-2032)
10.1.2. Europe Food and Beverage Processing Equipment Revenue (USD Million) by Application (2021-2032)
10.1.3. Europe Food and Beverage Processing Equipment Revenue (USD Million) by Product (2021-2032)
By Type
Pre-Processing
-Sorting & Grading
-Cutting
Peeling
Grinding
Slicing
Washing
Processing
-Forming
-Extruding
-Coating
-Drying
Cooling
Freezing
-Thermal
-Homogenization
-Filtration
-Pressing
By Application
Bakery & confectionery products
Meat & poultry
Dairy products
Fish & seafood
Alcoholic beverages
Non-alcoholic beverages
Others
By End Product Form
Solid
Liquid
Semi-solid
By Mode of Operation
Semi-automatic
Automatic
Chapter 11. Asia Pacific Food and Beverage Processing Equipment Analysis and Outlook
11.1. Asia Pacific Food and Beverage Processing Equipment Revenue (USD Million), and Revenue (USD Million) by Segments (2021-2032)
11.1.1. Asia Pacific Food and Beverage Processing Equipment Revenue (USD Million) by Type (2021-2032)
11.1.2. Asia Pacific Food and Beverage Processing Equipment Revenue (USD Million) by Application (2021-2032)
11.1.3. Asia Pacific Food and Beverage Processing Equipment Revenue (USD Million) by Product (2021-2032)
By Type
Pre-Processing
-Sorting & Grading
-Cutting
Peeling
Grinding
Slicing
Washing
Processing
-Forming
-Extruding
-Coating
-Drying
Cooling
Freezing
-Thermal
-Homogenization
-Filtration
-Pressing
By Application
Bakery & confectionery products
Meat & poultry
Dairy products
Fish & seafood
Alcoholic beverages
Non-alcoholic beverages
Others
By End Product Form
Solid
Liquid
Semi-solid
By Mode of Operation
Semi-automatic
Automatic
Chapter 12. South America Food and Beverage Processing Equipment Analysis and Outlook
12.1. South America Food and Beverage Processing Equipment Revenue (USD Million), by Segments (2021-2032)
12.1.1. South America Food and Beverage Processing Equipment Revenue (USD Million) by Type (2021-2032)
12.1.2. South America Food and Beverage Processing Equipment Revenue (USD Million) by Application (2021-2032)
12.1.3. South America Food and Beverage Processing Equipment Revenue (USD Million) by Product (2021-2032)
By Type
Pre-Processing
-Sorting & Grading
-Cutting
Peeling
Grinding
Slicing
Washing
Processing
-Forming
-Extruding
-Coating
-Drying
Cooling
Freezing
-Thermal
-Homogenization
-Filtration
-Pressing
By Application
Bakery & confectionery products
Meat & poultry
Dairy products
Fish & seafood
Alcoholic beverages
Non-alcoholic beverages
Others
By End Product Form
Solid
Liquid
Semi-solid
By Mode of Operation
Semi-automatic
Automatic
Chapter 13. Middle East and Africa Food and Beverage Processing Equipment Analysis and Outlook
13.1. Middle East and Africa Food and Beverage Processing Equipment Revenue (USD Million), by Segments (2021-2032)
13.1.1. Middle East and Africa Food and Beverage Processing Equipment Revenue (USD Million) by Type (2021-2032)
13.1.2. Middle East and Africa Food and Beverage Processing Equipment Revenue (USD Million) by Application (2021-2032)
13.1.3. Middle East and Africa Food and Beverage Processing Equipment Revenue (USD Million) by Product (2021-2032)
By Type
Pre-Processing
-Sorting & Grading
-Cutting
Peeling
Grinding
Slicing
Washing
Processing
-Forming
-Extruding
-Coating
-Drying
Cooling
Freezing
-Thermal
-Homogenization
-Filtration
-Pressing
By Application
Bakery & confectionery products
Meat & poultry
Dairy products
Fish & seafood
Alcoholic beverages
Non-alcoholic beverages
Others
By End Product Form
Solid
Liquid
Semi-solid
By Mode of Operation
Semi-automatic
Automatic
Chapter 14. Food and Beverage Processing Equipment Company Profiles
14.1 Business Overview
14.2 Product Profiles
14.3 SWOT Profiles
14.5 Recent Developments
14.6 Financial Profile
List of Companies
Alfa Laval AB
Bucher Industries AG
Bühler Group
GEA Group AG
JBT Corp
Krones AG
Marel hf.
SPX Flow Inc
Tetra Laval International S.A.
The Middleby Corp
15. Methodology and Data Sources
15.1 Customization Offerings
15.2 Subscription Services
15.3 Related Reports
15.4 Publisher Expertise
LIST OF TABLES
Table 1 Market Segmentation Analysis
Table 2 Global Food and Beverage Processing Equipment Market Share of Leading Companies, 2023
Table 3 Product Offerings of Leading Companies
Table 4 Low Growth Scenario Forecasts
Table 5 Reference Case Growth Scenario
Table 6 High Growth Case Scenario
Table 7 Global Food and Beverage Processing Equipment Revenue (USD Million) And CAGR (%) By Type (2021-2032)
Table 8 Global Food and Beverage Processing Equipment Revenue (USD Million) And CAGR (%) By Application (2021-2032)
Table 9 Global Food and Beverage Processing Equipment Revenue (USD Million) And CAGR (%) By Product (2021-2032)
Table 10 Global Food and Beverage Processing Equipment Market Revenue (USD Million) By Regions (2021-2032)
Table 11 Global Food and Beverage Processing Equipment Market Share (%) By Regions (2021-2032)
Table 12 North America Food and Beverage Processing Equipment Revenue (USD Million) By Country (2021-2032)
Table 13 Europe Food and Beverage Processing Equipment Revenue (USD Million) By Country (2021-2032)
Table 14 Asia Pacific Food and Beverage Processing Equipment Revenue (USD Million) By Country (2021-2032)
Table 15 South America Food and Beverage Processing Equipment Revenue (USD Million) By Country (2021-2032)
Table 16 Middle East and Africa Food and Beverage Processing Equipment Revenue (USD Million) By Region (2021-2032)
Table 17 North America Food and Beverage Processing Equipment Revenue (USD Million) By Type (2021-2032)
Table 18 North America Food and Beverage Processing Equipment Revenue (USD Million) By Application (2021-2032)
Table 19 North America Food and Beverage Processing Equipment Revenue (USD Million) By Product (2021-2032)
Table 20 Europe Food and Beverage Processing Equipment Revenue (USD Million) By Type (2021-2032)
Table 21 Europe Food and Beverage Processing Equipment Revenue (USD Million) By Application (2021-2032)
Table 22 Europe Food and Beverage Processing Equipment Revenue (USD Million) By Product (2021-2032)
Table 23 Asia Pacific Food and Beverage Processing Equipment Revenue (USD Million) By Type (2021-2032)
Table 24 Asia Pacific Food and Beverage Processing Equipment Revenue (USD Million) By Application (2021-2032)
Table 25 Asia Pacific Food and Beverage Processing Equipment Revenue (USD Million) By Product (2021-2032)
Table 26 South America Food and Beverage Processing Equipment Revenue (USD Million) By Type (2021-2032)
Table 27 South America Food and Beverage Processing Equipment Revenue (USD Million) By Application (2021-2032)
Table 28 South America Food and Beverage Processing Equipment Revenue (USD Million) By Product (2021-2032)
Table 29 Middle East and Africa Food and Beverage Processing Equipment Revenue (USD Million) By Type (2021-2032)
Table 30 Middle East and Africa Food and Beverage Processing Equipment Revenue (USD Million) By Application (2021-2032)
Table 31 Middle East and Africa Food and Beverage Processing Equipment Revenue (USD Million) By Product (2021-2032)
LIST OF FIGURES
Figure 1. Market Scope
Figure 2. Pricing Forecasts Per Unit, 2023- 2032
Figure 3. Porter’s Five Forces
Figure 4. Global Food and Beverage Processing Equipment Market Revenue (USD Million) By Regions (2021-2032)
Figure 5. Global Food and Beverage Processing Equipment Market Share (%) By Regions (2023)
Figure 6. North America Food and Beverage Processing Equipment Revenue (USD Million) By Country (2021-2032)
Figure 7. United States Food and Beverage Processing Equipment Revenue (USD Million) By Country (2021-2032)
Figure 8. Canada Food and Beverage Processing Equipment Revenue (USD Million) By Country (2021-2032)
Figure 9. Mexico Food and Beverage Processing Equipment Revenue (USD Million) By Country (2021-2032)
Figure 10. Europe Food and Beverage Processing Equipment Revenue (USD Million) By Country (2021-2032)
Figure 11. Germany Food and Beverage Processing Equipment Revenue (USD Million) By Country (2021-2032)
Figure 12. France Food and Beverage Processing Equipment Revenue (USD Million) By Country (2021-2032)
Figure 13. United Kingdom Food and Beverage Processing Equipment Revenue (USD Million) By Country (2021-2032)
Figure 14. Spain Food and Beverage Processing Equipment Revenue (USD Million) By Country (2021-2032)
Figure 15. Italy Food and Beverage Processing Equipment Revenue (USD Million) By Country (2021-2032)
Figure 16. Russia Food and Beverage Processing Equipment Revenue (USD Million) By Country (2021-2032)
Figure 17. Rest of Europe Food and Beverage Processing Equipment Revenue (USD Million) By Country (2021-2032)
Figure 11. Asia Pacific Food and Beverage Processing Equipment Revenue (USD Million) By Country (2021-2032)
Figure 12. China Food and Beverage Processing Equipment Revenue (USD Million) By Country (2021-2032)
Figure 13. Japan Food and Beverage Processing Equipment Revenue (USD Million) By Country (2021-2032)
Figure 14. India Food and Beverage Processing Equipment Revenue (USD Million) By Country (2021-2032)
Figure 15. South Korea Food and Beverage Processing Equipment Revenue (USD Million) By Country (2021-2032)
Figure 16. Australia Food and Beverage Processing Equipment Revenue (USD Million) By Country (2021-2032)
Figure 17. South East Asia Food and Beverage Processing Equipment Revenue (USD Million) By Country (2021-2032)
Figure 18. South America Food and Beverage Processing Equipment Revenue (USD Million) By Country (2021-2032)
Figure 19. Brazil Food and Beverage Processing Equipment Revenue (USD Million) By Country (2021-2032)
Figure 20. Argentina Food and Beverage Processing Equipment Revenue (USD Million) By Country (2021-2032)
Figure 21. Rest of Asia Pacific Food and Beverage Processing Equipment Revenue (USD Million) By Country (2021-2032)
Figure 22. Middle East and Africa Food and Beverage Processing Equipment Revenue (USD Million) By Region (2021-2032)
Figure 23. Saudi Arabia Food and Beverage Processing Equipment Revenue (USD Million) By Region (2021-2032)
Figure 24. The UAE Food and Beverage Processing Equipment Revenue (USD Million) By Region (2021-2032)
Figure 25. Rest of Middle East Food and Beverage Processing Equipment Revenue (USD Million) By Region (2021-2032)
Figure 26. South Africa Food and Beverage Processing Equipment Revenue (USD Million) By Region (2021-2032)
Figure 27. Africa Food and Beverage Processing Equipment Revenue (USD Million) By Region (2021-2032)
Figure 28. North America Food and Beverage Processing Equipment Revenue (USD Million) By Type (2021-2032)
Figure 29. North America Food and Beverage Processing Equipment Revenue (USD Million) By Application (2021-2032)
Figure 30. North America Food and Beverage Processing Equipment Revenue (USD Million) By Product (2021-2032)
Figure 31. Europe Food and Beverage Processing Equipment Revenue (USD Million) By Type (2021-2032)
Figure 32. Europe Food and Beverage Processing Equipment Revenue (USD Million) By Application (2021-2032)
Figure 33. Europe Food and Beverage Processing Equipment Revenue (USD Million) By Product (2021-2032)
Figure 34. Asia Pacific Food and Beverage Processing Equipment Revenue (USD Million) By Type (2021-2032)
Figure 35. Asia Pacific Food and Beverage Processing Equipment Revenue (USD Million) By Application (2021-2032)
Figure 36. Asia Pacific Food and Beverage Processing Equipment Revenue (USD Million) By Product (2021-2032)
Figure 37. South America Food and Beverage Processing Equipment Revenue (USD Million) By Type (2021-2032)
Figure 38. South America Food and Beverage Processing Equipment Revenue (USD Million) By Application (2021-2032)
Figure 39. South America Food and Beverage Processing Equipment Revenue (USD Million) By Product (2021-2032)
Figure 40. Middle East and Africa Food and Beverage Processing Equipment Revenue (USD Million) By Type (2021-2032)
Figure 41. Middle East and Africa Food and Beverage Processing Equipment Revenue (USD Million) By Application (2021-2032)
Figure 42. Middle East and Africa Food and Beverage Processing Equipment Revenue (USD Million) By Product (2021-2032)
By Type
Pre-Processing
-Sorting & Grading
-Cutting
Peeling
Grinding
Slicing
Washing
Processing
-Forming
-Extruding
-Coating
-Drying
Cooling
Freezing
-Thermal
-Homogenization
-Filtration
-Pressing
By Application
Bakery & confectionery products
Meat & poultry
Dairy products
Fish & seafood
Alcoholic beverages
Non-alcoholic beverages
Others
By End Product Form
Solid
Liquid
Semi-solid
By Mode of Operation
Semi-automatic
Automatic
Countries Analyzed
North America (US, Canada, Mexico)
Europe (Germany, UK, France, Spain, Italy, Russia, Rest of Europe)
Asia Pacific (China, India, Japan, South Korea, Australia, South East Asia, Rest of Asia)
South America (Brazil, Argentina, Rest of South America)
Middle East and Africa (Saudi Arabia, UAE, Rest of Middle East, South Africa, Egypt, Rest of Africa)
