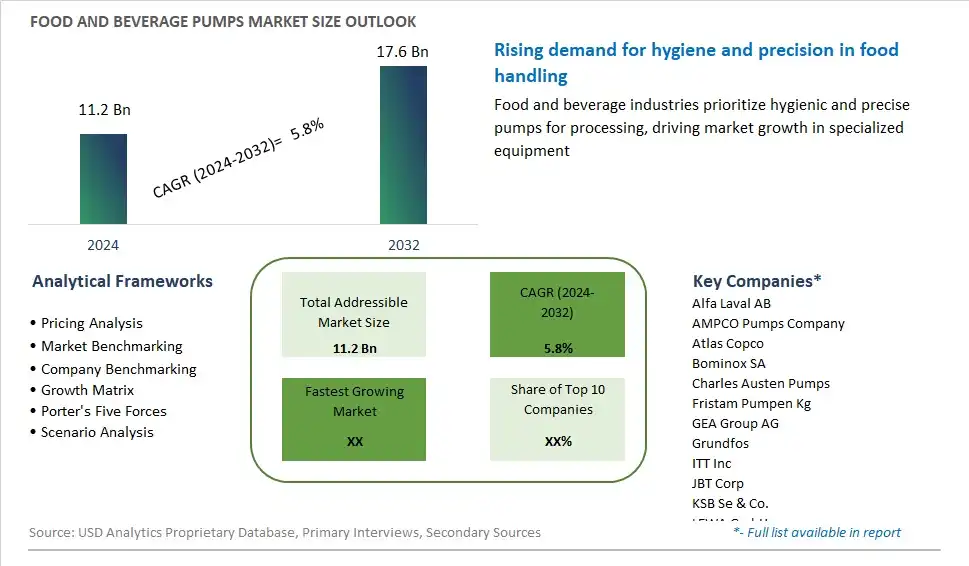
Global Food and Beverage Pumps Market Size is valued at $11.2 Billion in 2024 and is forecast to register a growth rate (CAGR) of 5.8% to reach $17.6 Billion by 2032.
The global Food and Beverage Pumps Market Comprehensive Study analyzes and forecasts the market size across 6 regions and 24 countries for diverse segments -By Type (Pumps, Centrifugal, Positive Displacement, Reciprocating, Rotary, Rotary Lobe, Progressive Cavity, Screw, Mixers, Agitators, Compressors, Others), By Application (Alcoholic Beverages, Non-Alcoholic Beverages, Dairy & Chocolate Products, Fruits & Vegetables, Sugar, Starch & Sweeteners, Bakery & Confectionery, Meat & Poultry), By Degree of Engineering (Engineered, Configured, Standard), By Flow (Below 10 l/s, 10 to 100 l/s, Above 100 l/s)
An Introduction to Food and Beverage Pumps Market
The Food and Beverage Pumps Market involves the manufacturing and distribution of pumps used in the processing, production, and packaging of food and beverages. These pumps ensure the efficient and hygienic handling of liquids and semi-solids in the industry. The market is driven by the increasing demand for processed and packaged foods, advancements in food processing technologies, and stringent hygiene regulations. Additionally, the growth of the food and beverage industry globally fuels market expansion.
Food and Beverage Industry Pumps Competitive Landscape
The market report analyses the leading companies in the industry including Alfa Laval AB, AMPCO Pumps Company, Atlas Copco, Bominox SA, Charles Austen Pumps, Fristam Pumpen Kg, GEA Group AG, Grundfos, ITT Inc, JBT Corp, KSB Se & Co., LEWA GmbH, PCM, Pentair, SPX Flow Inc, and Others.
Food and Beverage Industry Pumps Market Dynamics
Market Trend: Automation and Technological Advancements
The most prominent trend in the Food and Beverage Pumps Market is the increasing adoption of automation and technological advancements. Modern food and beverage processing facilities are integrating advanced pump technologies to enhance efficiency, reduce downtime, and ensure product quality. This trend is driven by the need for precise and reliable pumping solutions that can handle a variety of fluids and viscosities. Innovations in pump design, materials, and control systems are contributing to the growth of the market by offering improved performance and operational benefits
Market Driver: Rising Demand for Processed Foods
The rising demand for processed foods is a major driver of the Food and Beverage Pumps Market. As consumer lifestyles become busier, there is a growing preference for convenient and ready-to-eat food products. The food and beverage industry relies on pumps for various processing applications, including mixing, filling, and packaging. The increasing consumption of processed foods is driving the demand for efficient and hygienic pumping solutions, which are essential for maintaining product quality and safety
Market Opportunity: Expansion of Hygienic Pump Solutions
A significant opportunity in the Food and Beverage Pumps Market lies in the expansion of hygienic pump solutions. As food safety and hygiene standards become more stringent, there is a rising demand for pumps that can meet these requirements. Companies can capitalize on this opportunity by developing and marketing pumps that are designed for easy cleaning, minimal contamination risk, and compliance with food safety regulations. By offering advanced hygienic pump solutions, companies can attract customers in the food and beverage industry who prioritize safety and quality
Food and Beverage Pumps Market Share Analysis: Centrifugal Pumps held the dominant market share in 2024
In the Food and Beverage Pumps market segmented by Type, the Centrifugal Pumps segment is the largest category. This dominance is attributed to several factors, including the widespread use of centrifugal pumps across various food and beverage processing applications due to their efficiency, versatility, and adaptability to diverse operating conditions. Centrifugal pumps are ideal for handling liquids with low to medium viscosity, making them suitable for transferring beverages, dairy products, sauces, and other fluid ingredients in food processing facilities. Additionally, centrifugal pumps offer advantages such as high flow rates, gentle handling of delicate ingredients, and ease of maintenance, further driving their popularity among food and beverage manufacturers. Further, advancements in pump design, materials, and hygienic features ensure compliance with stringent industry standards and regulations, enhancing the suitability of centrifugal pumps for sanitary processing environments. As food and beverage manufacturers prioritize operational efficiency, product quality, and hygiene, the Centrifugal Pumps segment maintains its leadership position in the Food and Beverage Pumps market, driving growth and innovation across the industry.
Food and Beverage Pumps Market Share Analysis: Dairy & Chocolate market is poised to register the fastest growth rae over the forecast period to 2032
In the Food and Beverage Pumps market segmented by Application, the Dairy & Chocolate Products segment is the fastest-growing category. This accelerated growth is propelled by several factors, including increasing consumption of dairy products and chocolate confections globally, coupled with the need for efficient and hygienic pumping solutions in dairy processing and chocolate manufacturing operations. Dairy products such as milk, yogurt, and cheese require precise handling and gentle processing to maintain product integrity and quality, driving the demand for pumps capable of handling viscous and shear-sensitive fluids. Additionally, the growing popularity of premium and specialty dairy products, as well as indulgent chocolate treats, further stimulates the adoption of advanced pumping technologies tailored for dairy and chocolate processing applications. Further, stringent food safety regulations and consumer preferences for clean label and high-quality products emphasize the importance of sanitary pumping solutions in dairy and chocolate production facilities. As dairy and chocolate manufacturers strive to meet rising consumer demands while ensuring product consistency and safety, the Dairy & Chocolate Products application segment continues to witness rapid growth, underscoring its significance in driving innovation and expansion within the Food and Beverage Pumps market.
Food and Beverage Pumps Market Share Analysis: Standard Degree of Engineering held the dominant market share in 2024
In the Food and Beverage Pumps market segmented by Degree of Engineering, the Standard segment is the largest category. This dominance is attributed to the widespread adoption of standard pumps across various food and beverage processing applications due to their simplicity, reliability, and cost-effectiveness. Standard pumps are characterized by their off-the-shelf availability, standardized designs, and ease of installation, making them preferred choices for manufacturers seeking efficient pumping solutions with minimal customization requirements. Additionally, standard pumps offer versatility and compatibility with a wide range of food and beverage products, including liquids with varying viscosities and solids content. Further, the availability of standard pump models from reputable manufacturers ensures consistent performance, spare parts availability, and after-sales support, further enhancing their appeal to food and beverage processors. As manufacturers prioritize operational efficiency, scalability, and cost optimization, the Standard Degree of Engineering segment maintains its leadership position in the Food and Beverage Pumps market, driving widespread adoption and growth across the industry.
Food and Beverage Industry Pumps Market Segmentation
By Type
Pumps
Centrifugal
Positive Displacement
Reciprocating
Rotary
Rotary Lobe
Progressive Cavity
Screw
Mixers
Agitators
Compressors
Others
By Application
Alcoholic Beverages
Non-Alcoholic Beverages
Dairy & Chocolate Products
Fruits & Vegetables
Sugar, Starch & Sweeteners
Bakery & Confectionery
Meat & Poultry
By Degree of Engineering
Engineered
Configured
Standard
By Flow
Below 10 l/s
10 to 100 l/s
Above 100 l/s
Countries Analyzed
North America (US, Canada, Mexico)
Europe (Germany, UK, France, Spain, Italy, Russia, Rest of Europe)
Asia Pacific (China, India, Japan, South Korea, Australia, South East Asia, Rest of Asia)
South America (Brazil, Argentina, Rest of South America)
Middle East and Africa (Saudi Arabia, UAE, Rest of Middle East, South Africa, Egypt, Rest of Africa)
Food and Beverage Industry Pumps Companies Profiled in the Study
Alfa Laval AB
AMPCO Pumps Company
Atlas Copco
Bominox SA
Charles Austen Pumps
Fristam Pumpen Kg
GEA Group AG
Grundfos
ITT Inc
JBT Corp
KSB Se & Co.
LEWA GmbH
PCM
Pentair
SPX Flow Inc
*- List Not Exhaustive
Chapter 1. TABLE OF CONTENTS
Chapter 2. Introduction to Food and Beverage Industry Pumps Market
2.1. Market Overview
2.2. Key Statistics and Report Highlights
2.3. Scope of the Comprehensive Study
2.3.1. Market Definition
2.3.2 Countries and Regions Covered
2.3.3 Research Objective
2.3.4 Units, Currency, and Conversions
2.3.5 Industry Value Chain
2.4. Key Market Segments
2.5. Key Companies
2.6. Study Period
Chapter 3. Strategic Analysis Review
3.1. Food and Beverage Industry Pumps Pricing Analysis and Forecast
3.2. Porter’s Five Forces
3.3. Market Ecosystem
3.4. SWOT Analysis
3.5. Regulatory Scenario
3.3. Effects of Inflation, Russia-Ukraine War, moderating economic growth, and other macroeconomic factors
Chapter 4. Competitive Landscape
4.1. Market Share Analysis
4.1.1. Global Food and Beverage Industry Pumps Market Share by Company, 2023
4.1.2. Product Offerings of Leading Food and Beverage Industry Pumps Companies
4.2. Market Entropy
4.2.1. New Product Launches in the Industry
4.2.2. Mergers, Acquisitions, Joint ventures, and Partnerships
4.3. Key Strategies and Best Practices
Chapter 5. Global Market Projections: Best, Reference, and Low Case Scenarios
5.1. Growth Analysis- Case Scenario Definitions
5.2. Low Growth Case Scenario Forecasts
5.3. Reference Growth Case Scenario Forecasts
5.4. High Growth Case Scenario Forecasts
Chapter 6. Market Dynamics
6.1. Food and Beverage Industry Pumps Market Drivers
6.2. Food and Beverage Industry Pumps Market Challenges
6.6. Food and Beverage Industry Pumps Market Opportunities
6.4. Food and Beverage Industry Pumps Market Trends
Chapter 7. Global Food and Beverage Industry Pumps Market Outlook Trends
7.1. Global Food and Beverage Industry Pumps Revenue (USD Million) and CAGR (%) by Type (2021-2032)
7.2. Global Food and Beverage Industry Pumps Revenue (USD Million) and CAGR (%) by Application (2021-2032)
7.3. Global Food and Beverage Industry Pumps Revenue (USD Million) and CAGR (%) by Product (2021-2032)
By Type
Pumps
Centrifugal
Positive Displacement
Reciprocating
Rotary
Rotary Lobe
Progressive Cavity
Screw
Mixers
Agitators
Compressors
Others
By Application
Alcoholic Beverages
Non-Alcoholic Beverages
Dairy & Chocolate Products
Fruits & Vegetables
Sugar, Starch & Sweeteners
Bakery & Confectionery
Meat & Poultry
By Degree of Engineering
Engineered
Configured
Standard
By Flow
Below 10 l/s
10 to 100 l/s
Above 100 l/s
Chapter 8. Global Food and Beverage Industry Pumps Regional Analysis and Outlook
8.1. Global Food and Beverage Industry Pumps Revenue (USD Million) By Regions (2021- 2032)
8.2. North America Food and Beverage Industry Pumps Revenue (USD Million) by Country (2021-2032)
8.2.1. United States Food and Beverage Industry Pumps Regional Analysis and Outlook
8.2.2. Canada Food and Beverage Industry Pumps Regional Analysis and Outlook
8.2.3. Mexico Food and Beverage Industry Pumps Regional Analysis and Outlook
8.3. Europe Food and Beverage Industry Pumps Revenue (USD Million), by Country (2021-2032)
8.3.1. Germany Food and Beverage Industry Pumps Regional Analysis and Outlook
8.3.2. France Food and Beverage Industry Pumps Regional Analysis and Outlook
8.3.3. United Kingdom Food and Beverage Industry Pumps Regional Analysis and Outlook
8.3.4. Spain Food and Beverage Industry Pumps Regional Analysis and Outlook
8.3.5. Italy Food and Beverage Industry Pumps Regional Analysis and Outlook
8.3.6. Russia Food and Beverage Industry Pumps Regional Analysis and Outlook
8.3.7. Rest of Europe Food and Beverage Industry Pumps Regional Analysis and Outlook
8.4. Asia Pacific Food and Beverage Industry Pumps Revenue (USD Million) by Country (2021-2032)
8.4.1. China Food and Beverage Industry Pumps Regional Analysis and Outlook
8.4.2. Japan Food and Beverage Industry Pumps Regional Analysis and Outlook
8.4.3. India Food and Beverage Industry Pumps Regional Analysis and Outlook
8.4.4. South Korea Food and Beverage Industry Pumps Regional Analysis and Outlook
8.4.5. Australia Food and Beverage Industry Pumps Regional Analysis and Outlook
8.4.6. South East Asia Food and Beverage Industry Pumps Regional Analysis and Outlook
8.4.7. Rest of Asia Pacific Food and Beverage Industry Pumps Regional Analysis and Outlook
8.5. South America Food and Beverage Industry Pumps Revenue (USD Million), by Country (2021-2032)
8.5.1. Brazil Food and Beverage Industry Pumps Regional Analysis and Outlook
8.5.2. Argentina Food and Beverage Industry Pumps Regional Analysis and Outlook
8.5.3. Rest of South America Food and Beverage Industry Pumps Regional Analysis and Outlook
8.6. Middle East and Africa Food and Beverage Industry Pumps Revenue (USD Million) by Country (2021-2032)
8.6.1. Middle East Food and Beverage Industry Pumps Regional Analysis and Outlook
8.6.2. Africa Food and Beverage Industry Pumps Regional Analysis and Outlook
Chapter 9. North America Food and Beverage Industry Pumps Analysis and Outlook
9.1. North America Food and Beverage Industry Pumps Revenue (USD Million) by Segments (2021-2032)
9.1.1. North America Food and Beverage Industry Pumps Revenue (USD Million) by Type (2021-2032)
9.1.2. North America Food and Beverage Industry Pumps Revenue (USD Million) by Application (2021-2032)
9.1.3. North America Food and Beverage Industry Pumps Revenue (USD Million) by Product (2021-2032)
By Type
Pumps
Centrifugal
Positive Displacement
Reciprocating
Rotary
Rotary Lobe
Progressive Cavity
Screw
Mixers
Agitators
Compressors
Others
By Application
Alcoholic Beverages
Non-Alcoholic Beverages
Dairy & Chocolate Products
Fruits & Vegetables
Sugar, Starch & Sweeteners
Bakery & Confectionery
Meat & Poultry
By Degree of Engineering
Engineered
Configured
Standard
By Flow
Below 10 l/s
10 to 100 l/s
Above 100 l/s
Chapter 10. Europe Food and Beverage Industry Pumps Analysis and Outlook
10.1. Europe Food and Beverage Industry Pumps Revenue (USD Million), by Segments (USD Million) (2021-2032)
10.1.1. Europe Food and Beverage Industry Pumps Revenue (USD Million) by Type (2021-2032)
10.1.2. Europe Food and Beverage Industry Pumps Revenue (USD Million) by Application (2021-2032)
10.1.3. Europe Food and Beverage Industry Pumps Revenue (USD Million) by Product (2021-2032)
By Type
Pumps
Centrifugal
Positive Displacement
Reciprocating
Rotary
Rotary Lobe
Progressive Cavity
Screw
Mixers
Agitators
Compressors
Others
By Application
Alcoholic Beverages
Non-Alcoholic Beverages
Dairy & Chocolate Products
Fruits & Vegetables
Sugar, Starch & Sweeteners
Bakery & Confectionery
Meat & Poultry
By Degree of Engineering
Engineered
Configured
Standard
By Flow
Below 10 l/s
10 to 100 l/s
Above 100 l/s
Chapter 11. Asia Pacific Food and Beverage Industry Pumps Analysis and Outlook
11.1. Asia Pacific Food and Beverage Industry Pumps Revenue (USD Million), and Revenue (USD Million) by Segments (2021-2032)
11.1.1. Asia Pacific Food and Beverage Industry Pumps Revenue (USD Million) by Type (2021-2032)
11.1.2. Asia Pacific Food and Beverage Industry Pumps Revenue (USD Million) by Application (2021-2032)
11.1.3. Asia Pacific Food and Beverage Industry Pumps Revenue (USD Million) by Product (2021-2032)
By Type
Pumps
Centrifugal
Positive Displacement
Reciprocating
Rotary
Rotary Lobe
Progressive Cavity
Screw
Mixers
Agitators
Compressors
Others
By Application
Alcoholic Beverages
Non-Alcoholic Beverages
Dairy & Chocolate Products
Fruits & Vegetables
Sugar, Starch & Sweeteners
Bakery & Confectionery
Meat & Poultry
By Degree of Engineering
Engineered
Configured
Standard
By Flow
Below 10 l/s
10 to 100 l/s
Above 100 l/s
Chapter 12. South America Food and Beverage Industry Pumps Analysis and Outlook
12.1. South America Food and Beverage Industry Pumps Revenue (USD Million), by Segments (2021-2032)
12.1.1. South America Food and Beverage Industry Pumps Revenue (USD Million) by Type (2021-2032)
12.1.2. South America Food and Beverage Industry Pumps Revenue (USD Million) by Application (2021-2032)
12.1.3. South America Food and Beverage Industry Pumps Revenue (USD Million) by Product (2021-2032)
By Type
Pumps
Centrifugal
Positive Displacement
Reciprocating
Rotary
Rotary Lobe
Progressive Cavity
Screw
Mixers
Agitators
Compressors
Others
By Application
Alcoholic Beverages
Non-Alcoholic Beverages
Dairy & Chocolate Products
Fruits & Vegetables
Sugar, Starch & Sweeteners
Bakery & Confectionery
Meat & Poultry
By Degree of Engineering
Engineered
Configured
Standard
By Flow
Below 10 l/s
10 to 100 l/s
Above 100 l/s
Chapter 13. Middle East and Africa Food and Beverage Industry Pumps Analysis and Outlook
13.1. Middle East and Africa Food and Beverage Industry Pumps Revenue (USD Million), by Segments (2021-2032)
13.1.1. Middle East and Africa Food and Beverage Industry Pumps Revenue (USD Million) by Type (2021-2032)
13.1.2. Middle East and Africa Food and Beverage Industry Pumps Revenue (USD Million) by Application (2021-2032)
13.1.3. Middle East and Africa Food and Beverage Industry Pumps Revenue (USD Million) by Product (2021-2032)
By Type
Pumps
Centrifugal
Positive Displacement
Reciprocating
Rotary
Rotary Lobe
Progressive Cavity
Screw
Mixers
Agitators
Compressors
Others
By Application
Alcoholic Beverages
Non-Alcoholic Beverages
Dairy & Chocolate Products
Fruits & Vegetables
Sugar, Starch & Sweeteners
Bakery & Confectionery
Meat & Poultry
By Degree of Engineering
Engineered
Configured
Standard
By Flow
Below 10 l/s
10 to 100 l/s
Above 100 l/s
Chapter 14. Food and Beverage Industry Pumps Company Profiles
14.1 Business Overview
14.2 Product Profiles
14.3 SWOT Profiles
14.5 Recent Developments
14.6 Financial Profile
List of Companies
Alfa Laval AB
AMPCO Pumps Company
Atlas Copco
Bominox SA
Charles Austen Pumps
Fristam Pumpen Kg
GEA Group AG
Grundfos
ITT Inc
JBT Corp
KSB Se & Co.
LEWA GmbH
PCM
Pentair
SPX Flow Inc
15. Methodology and Data Sources
15.1 Customization Offerings
15.2 Subscription Services
15.3 Related Reports
15.4 Publisher Expertise
LIST OF TABLES
Table 1 Market Segmentation Analysis
Table 2 Global Food and Beverage Industry Pumps Market Share of Leading Companies, 2023
Table 3 Product Offerings of Leading Companies
Table 4 Low Growth Scenario Forecasts
Table 5 Reference Case Growth Scenario
Table 6 High Growth Case Scenario
Table 7 Global Food and Beverage Industry Pumps Revenue (USD Million) And CAGR (%) By Type (2021-2032)
Table 8 Global Food and Beverage Industry Pumps Revenue (USD Million) And CAGR (%) By Application (2021-2032)
Table 9 Global Food and Beverage Industry Pumps Revenue (USD Million) And CAGR (%) By Product (2021-2032)
Table 10 Global Food and Beverage Industry Pumps Market Revenue (USD Million) By Regions (2021-2032)
Table 11 Global Food and Beverage Industry Pumps Market Share (%) By Regions (2021-2032)
Table 12 North America Food and Beverage Industry Pumps Revenue (USD Million) By Country (2021-2032)
Table 13 Europe Food and Beverage Industry Pumps Revenue (USD Million) By Country (2021-2032)
Table 14 Asia Pacific Food and Beverage Industry Pumps Revenue (USD Million) By Country (2021-2032)
Table 15 South America Food and Beverage Industry Pumps Revenue (USD Million) By Country (2021-2032)
Table 16 Middle East and Africa Food and Beverage Industry Pumps Revenue (USD Million) By Region (2021-2032)
Table 17 North America Food and Beverage Industry Pumps Revenue (USD Million) By Type (2021-2032)
Table 18 North America Food and Beverage Industry Pumps Revenue (USD Million) By Application (2021-2032)
Table 19 North America Food and Beverage Industry Pumps Revenue (USD Million) By Product (2021-2032)
Table 20 Europe Food and Beverage Industry Pumps Revenue (USD Million) By Type (2021-2032)
Table 21 Europe Food and Beverage Industry Pumps Revenue (USD Million) By Application (2021-2032)
Table 22 Europe Food and Beverage Industry Pumps Revenue (USD Million) By Product (2021-2032)
Table 23 Asia Pacific Food and Beverage Industry Pumps Revenue (USD Million) By Type (2021-2032)
Table 24 Asia Pacific Food and Beverage Industry Pumps Revenue (USD Million) By Application (2021-2032)
Table 25 Asia Pacific Food and Beverage Industry Pumps Revenue (USD Million) By Product (2021-2032)
Table 26 South America Food and Beverage Industry Pumps Revenue (USD Million) By Type (2021-2032)
Table 27 South America Food and Beverage Industry Pumps Revenue (USD Million) By Application (2021-2032)
Table 28 South America Food and Beverage Industry Pumps Revenue (USD Million) By Product (2021-2032)
Table 29 Middle East and Africa Food and Beverage Industry Pumps Revenue (USD Million) By Type (2021-2032)
Table 30 Middle East and Africa Food and Beverage Industry Pumps Revenue (USD Million) By Application (2021-2032)
Table 31 Middle East and Africa Food and Beverage Industry Pumps Revenue (USD Million) By Product (2021-2032)
LIST OF FIGURES
Figure 1. Market Scope
Figure 2. Pricing Forecasts Per Unit, 2023- 2032
Figure 3. Porter’s Five Forces
Figure 4. Global Food and Beverage Industry Pumps Market Revenue (USD Million) By Regions (2021-2032)
Figure 5. Global Food and Beverage Industry Pumps Market Share (%) By Regions (2023)
Figure 6. North America Food and Beverage Industry Pumps Revenue (USD Million) By Country (2021-2032)
Figure 7. United States Food and Beverage Industry Pumps Revenue (USD Million) By Country (2021-2032)
Figure 8. Canada Food and Beverage Industry Pumps Revenue (USD Million) By Country (2021-2032)
Figure 9. Mexico Food and Beverage Industry Pumps Revenue (USD Million) By Country (2021-2032)
Figure 10. Europe Food and Beverage Industry Pumps Revenue (USD Million) By Country (2021-2032)
Figure 11. Germany Food and Beverage Industry Pumps Revenue (USD Million) By Country (2021-2032)
Figure 12. France Food and Beverage Industry Pumps Revenue (USD Million) By Country (2021-2032)
Figure 13. United Kingdom Food and Beverage Industry Pumps Revenue (USD Million) By Country (2021-2032)
Figure 14. Spain Food and Beverage Industry Pumps Revenue (USD Million) By Country (2021-2032)
Figure 15. Italy Food and Beverage Industry Pumps Revenue (USD Million) By Country (2021-2032)
Figure 16. Russia Food and Beverage Industry Pumps Revenue (USD Million) By Country (2021-2032)
Figure 17. Rest of Europe Food and Beverage Industry Pumps Revenue (USD Million) By Country (2021-2032)
Figure 11. Asia Pacific Food and Beverage Industry Pumps Revenue (USD Million) By Country (2021-2032)
Figure 12. China Food and Beverage Industry Pumps Revenue (USD Million) By Country (2021-2032)
Figure 13. Japan Food and Beverage Industry Pumps Revenue (USD Million) By Country (2021-2032)
Figure 14. India Food and Beverage Industry Pumps Revenue (USD Million) By Country (2021-2032)
Figure 15. South Korea Food and Beverage Industry Pumps Revenue (USD Million) By Country (2021-2032)
Figure 16. Australia Food and Beverage Industry Pumps Revenue (USD Million) By Country (2021-2032)
Figure 17. South East Asia Food and Beverage Industry Pumps Revenue (USD Million) By Country (2021-2032)
Figure 18. South America Food and Beverage Industry Pumps Revenue (USD Million) By Country (2021-2032)
Figure 19. Brazil Food and Beverage Industry Pumps Revenue (USD Million) By Country (2021-2032)
Figure 20. Argentina Food and Beverage Industry Pumps Revenue (USD Million) By Country (2021-2032)
Figure 21. Rest of Asia Pacific Food and Beverage Industry Pumps Revenue (USD Million) By Country (2021-2032)
Figure 22. Middle East and Africa Food and Beverage Industry Pumps Revenue (USD Million) By Region (2021-2032)
Figure 23. Saudi Arabia Food and Beverage Industry Pumps Revenue (USD Million) By Region (2021-2032)
Figure 24. The UAE Food and Beverage Industry Pumps Revenue (USD Million) By Region (2021-2032)
Figure 25. Rest of Middle East Food and Beverage Industry Pumps Revenue (USD Million) By Region (2021-2032)
Figure 26. South Africa Food and Beverage Industry Pumps Revenue (USD Million) By Region (2021-2032)
Figure 27. Africa Food and Beverage Industry Pumps Revenue (USD Million) By Region (2021-2032)
Figure 28. North America Food and Beverage Industry Pumps Revenue (USD Million) By Type (2021-2032)
Figure 29. North America Food and Beverage Industry Pumps Revenue (USD Million) By Application (2021-2032)
Figure 30. North America Food and Beverage Industry Pumps Revenue (USD Million) By Product (2021-2032)
Figure 31. Europe Food and Beverage Industry Pumps Revenue (USD Million) By Type (2021-2032)
Figure 32. Europe Food and Beverage Industry Pumps Revenue (USD Million) By Application (2021-2032)
Figure 33. Europe Food and Beverage Industry Pumps Revenue (USD Million) By Product (2021-2032)
Figure 34. Asia Pacific Food and Beverage Industry Pumps Revenue (USD Million) By Type (2021-2032)
Figure 35. Asia Pacific Food and Beverage Industry Pumps Revenue (USD Million) By Application (2021-2032)
Figure 36. Asia Pacific Food and Beverage Industry Pumps Revenue (USD Million) By Product (2021-2032)
Figure 37. South America Food and Beverage Industry Pumps Revenue (USD Million) By Type (2021-2032)
Figure 38. South America Food and Beverage Industry Pumps Revenue (USD Million) By Application (2021-2032)
Figure 39. South America Food and Beverage Industry Pumps Revenue (USD Million) By Product (2021-2032)
Figure 40. Middle East and Africa Food and Beverage Industry Pumps Revenue (USD Million) By Type (2021-2032)
Figure 41. Middle East and Africa Food and Beverage Industry Pumps Revenue (USD Million) By Application (2021-2032)
Figure 42. Middle East and Africa Food and Beverage Industry Pumps Revenue (USD Million) By Product (2021-2032)
By Type
Pumps
Centrifugal
Positive Displacement
Reciprocating
Rotary
Rotary Lobe
Progressive Cavity
Screw
Mixers
Agitators
Compressors
Others
By Application
Alcoholic Beverages
Non-Alcoholic Beverages
Dairy & Chocolate Products
Fruits & Vegetables
Sugar, Starch & Sweeteners
Bakery & Confectionery
Meat & Poultry
By Degree of Engineering
Engineered
Configured
Standard
By Flow
Below 10 l/s
10 to 100 l/s
Above 100 l/s
Countries Analyzed
North America (US, Canada, Mexico)
Europe (Germany, UK, France, Spain, Italy, Russia, Rest of Europe)
Asia Pacific (China, India, Japan, South Korea, Australia, South East Asia, Rest of Asia)
South America (Brazil, Argentina, Rest of South America)
Middle East and Africa (Saudi Arabia, UAE, Rest of Middle East, South Africa, Egypt, Rest of Africa)
