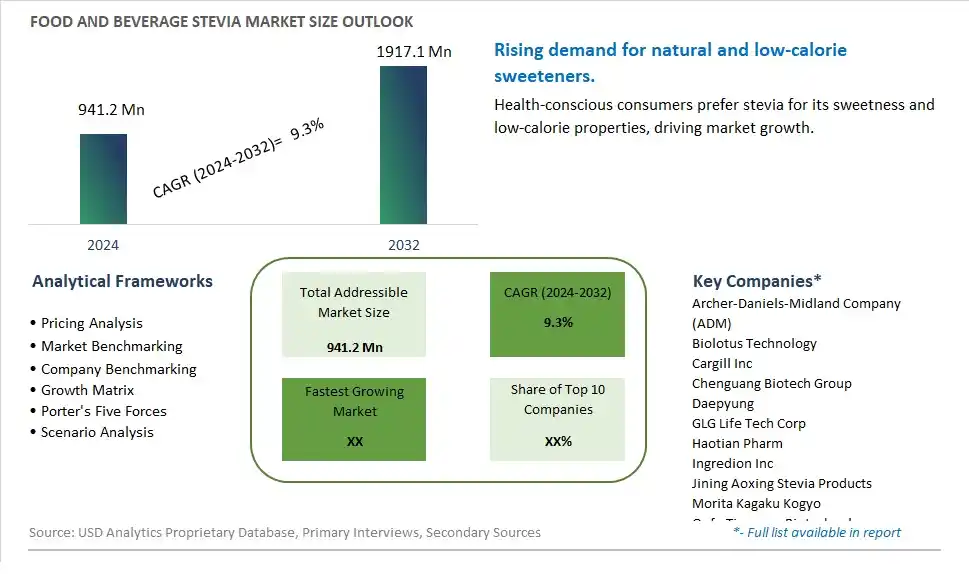
Global Food and Beverage Stevia Market Size is valued at $941.2 Million in 2024 and is forecast to register a growth rate (CAGR) of 9.3% to reach $1917.1 Million by 2032.
The global Food and Beverage Stevia Market Comprehensive Study analyzes and forecasts the market size across 6 regions and 24 countries for diverse segments -By Type (Reb-A Series, Reb D, Reb M, STV Series, Others), By Application (Beverage, Food Ingredient, Table Sweetener)
An Introduction to Food and Beverage Stevia Market
In 2024, the Food and Beverage Stevia market is witnessing robust growth, driven by the increasing demand for natural and low-calorie sweeteners. Stevia, derived from the leaves of the Stevia rebaudiana plant, is popular for its sweetness and minimal impact on blood sugar levels. The market benefits from advancements in stevia extraction and formulation technologies, the growing trend of health-conscious and diabetic-friendly products, and the expansion of the global food and beverage sector. Additionally, the rising focus on reducing sugar intake and promoting natural ingredients is contributing to market growth.
Food and Beverage Stevia Competitive Landscape
The market report analyses the leading companies in the industry including Archer-Daniels-Midland Company (ADM), Biolotus Technology, Cargill Inc, Chenguang Biotech Group, Daepyung, GLG Life Tech Corp, Haotian Pharm, Ingredion Inc, Jining Aoxing Stevia Products, Morita Kagaku Kogyo, Qufu Tianyuan Biotechnology, Shandong Shengxiangyuan, Shangdong Huaxian Stevia, Sunwin Stevia, Tate & Lyle PLC, and Others.
Food and Beverage Stevia Market Dynamics
Food and Beverage Stevia Market Trend: Shift Towards Natural and Low-Calorie Sweeteners
One prominent trend in the food and beverage stevia market is the shift towards natural and low-calorie sweeteners. As consumers become more health-conscious and seek alternatives to sugar and artificial sweeteners, stevia emerges as a popular choice due to its natural origin, zero-calorie profile, and sweetness comparable to sugar. This trend is driven by concerns over obesity, diabetes, and overall well-being, as well as the demand for clean label products with reduced sugar content. Stevia's versatility in various food and beverage applications, including beverages, confectionery, dairy products, and baked goods, contributes to its growing popularity among health-conscious consumers and food manufacturers looking to reformulate products for healthier options.
Food and Beverage Stevia Market Driver: Regulatory Support and Consumer Demand for Clean Label Ingredients
A key driver propelling the food and beverage stevia market is regulatory support and consumer demand for clean label ingredients. Regulatory agencies and health organizations endorse stevia as a safe, natural sweetener, leading to its widespread acceptance and inclusion in food and beverage formulations. Additionally, consumer preferences for clean label products with transparent ingredient lists and minimal additives drive the adoption of stevia as a preferred sweetening agent. The driver behind this trend is the alignment of stevia with dietary guidelines promoting reduced sugar intake, as well as its compatibility with various dietary lifestyles, including low-carb, keto, and diabetic-friendly diets, driving market growth and innovation in stevia-based products.
Food and Beverage Stevia Market Opportunity: Development of Stevia-Based Functional Ingredients
A significant opportunity in the food and beverage stevia market lies in the development of stevia-based functional ingredients that offer additional health benefits beyond sweetness. Manufacturers can capitalize on this opportunity by incorporating stevia extracts into functional formulations such as antioxidant-rich blends, digestive health enhancers, immune system boosters, or energy-boosting blends. Stevia's natural properties and potential synergies with other beneficial ingredients allow for the creation of innovative functional food and beverage products that appeal to health-conscious consumers seeking holistic wellness solutions. By leveraging stevia's sweetness and health-promoting attributes, companies can expand their product portfolios, differentiate their offerings, and capture market share in the evolving functional food and beverage market segment.
Food and Beverage Stevia Market Share Analysis: Reb-A Series segment generated the highest revenue share in the industry
In the Food and Beverage Stevia Market, the Reb-A Series stands out as the largest segment. Reb-A (Rebaudioside A) is the most widely used steviol glycoside due to its high sweetness level and clean, sugar-like taste without the bitter aftertaste often associated with other steviol glycosides. It is extensively used as a natural sweetener in various food and beverage products, including soft drinks, dairy products, desserts, and baked goods. Reb-A's popularity is driven by increasing consumer demand for healthier alternatives to sugar, supported by its zero-calorie nature and its perceived health benefits, such as potentially aiding in weight management and controlling blood sugar levels.
Food and Beverage Stevia Market Share Analysis: Beverage Application is the fastest growing segment over the forecast period to 2032
Among the segments in the Food and Beverage Stevia Market, the Beverage application is witnessing the fastest growth trajectory up to 2032. Stevia is increasingly incorporated into beverages across the spectrum, from carbonated soft drinks and flavored waters to teas and functional beverages. The beverage industry values stevia for its ability to provide sweetness without the calories and negative health effects associated with traditional sugars. Further, as consumers become more health-conscious and regulatory bodies impose stricter regulations on sugar content in beverages, stevia emerges as a preferred natural sweetener option for formulators looking to meet these demands. The ongoing innovation in beverage formulations and the expanding market for natural and clean-label products further propel the growth of stevia in beverages.
Food and Beverage Stevia Market Segmentation
By Type
Reb-A Series
Reb D
Reb M
STV Series
Others
By Application
Beverage
Food Ingredient
Table Sweetener
Countries Analyzed
North America (US, Canada, Mexico)
Europe (Germany, UK, France, Spain, Italy, Russia, Rest of Europe)
Asia Pacific (China, India, Japan, South Korea, Australia, South East Asia, Rest of Asia)
South America (Brazil, Argentina, Rest of South America)
Middle East and Africa (Saudi Arabia, UAE, Rest of Middle East, South Africa, Egypt, Rest of Africa)
Food and Beverage Stevia Companies Profiled in the Study
Archer-Daniels-Midland Company (ADM)
Biolotus Technology
Cargill Inc
Chenguang Biotech Group
Daepyung
GLG Life Tech Corp
Haotian Pharm
Ingredion Inc
Jining Aoxing Stevia Products
Morita Kagaku Kogyo
Qufu Tianyuan Biotechnology
Shandong Shengxiangyuan
Shangdong Huaxian Stevia
Sunwin Stevia
Tate & Lyle PLC
*- List Not Exhaustive
Chapter 1. TABLE OF CONTENTS
Chapter 2. Introduction to Food and Beverage Stevia Market
2.1. Market Overview
2.2. Key Statistics and Report Highlights
2.3. Scope of the Comprehensive Study
2.3.1. Market Definition
2.3.2 Countries and Regions Covered
2.3.3 Research Objective
2.3.4 Units, Currency, and Conversions
2.3.5 Industry Value Chain
2.4. Key Market Segments
2.5. Key Companies
2.6. Study Period
Chapter 3. Strategic Analysis Review
3.1. Food and Beverage Stevia Pricing Analysis and Forecast
3.2. Porter’s Five Forces
3.3. Market Ecosystem
3.4. SWOT Analysis
3.5. Regulatory Scenario
3.3. Effects of Inflation, Russia-Ukraine War, moderating economic growth, and other macroeconomic factors
Chapter 4. Competitive Landscape
4.1. Market Share Analysis
4.1.1. Global Food and Beverage Stevia Market Share by Company, 2023
4.1.2. Product Offerings of Leading Food and Beverage Stevia Companies
4.2. Market Entropy
4.2.1. New Product Launches in the Industry
4.2.2. Mergers, Acquisitions, Joint ventures, and Partnerships
4.3. Key Strategies and Best Practices
Chapter 5. Global Market Projections: Best, Reference, and Low Case Scenarios
5.1. Growth Analysis- Case Scenario Definitions
5.2. Low Growth Case Scenario Forecasts
5.3. Reference Growth Case Scenario Forecasts
5.4. High Growth Case Scenario Forecasts
Chapter 6. Market Dynamics
6.1. Food and Beverage Stevia Market Drivers
6.2. Food and Beverage Stevia Market Challenges
6.6. Food and Beverage Stevia Market Opportunities
6.4. Food and Beverage Stevia Market Trends
Chapter 7. Global Food and Beverage Stevia Market Outlook Trends
7.1. Global Food and Beverage Stevia Revenue (USD Million) and CAGR (%) by Type (2021-2032)
7.2. Global Food and Beverage Stevia Revenue (USD Million) and CAGR (%) by Application (2021-2032)
7.3. Global Food and Beverage Stevia Revenue (USD Million) and CAGR (%) by Product (2021-2032)
By Type
Reb-A Series
Reb D
Reb M
STV Series
Others
By Application
Beverage
Food Ingredient
Table Sweetener
Chapter 8. Global Food and Beverage Stevia Regional Analysis and Outlook
8.1. Global Food and Beverage Stevia Revenue (USD Million) By Regions (2021- 2032)
8.2. North America Food and Beverage Stevia Revenue (USD Million) by Country (2021-2032)
8.2.1. United States Food and Beverage Stevia Regional Analysis and Outlook
8.2.2. Canada Food and Beverage Stevia Regional Analysis and Outlook
8.2.3. Mexico Food and Beverage Stevia Regional Analysis and Outlook
8.3. Europe Food and Beverage Stevia Revenue (USD Million), by Country (2021-2032)
8.3.1. Germany Food and Beverage Stevia Regional Analysis and Outlook
8.3.2. France Food and Beverage Stevia Regional Analysis and Outlook
8.3.3. United Kingdom Food and Beverage Stevia Regional Analysis and Outlook
8.3.4. Spain Food and Beverage Stevia Regional Analysis and Outlook
8.3.5. Italy Food and Beverage Stevia Regional Analysis and Outlook
8.3.6. Russia Food and Beverage Stevia Regional Analysis and Outlook
8.3.7. Rest of Europe Food and Beverage Stevia Regional Analysis and Outlook
8.4. Asia Pacific Food and Beverage Stevia Revenue (USD Million) by Country (2021-2032)
8.4.1. China Food and Beverage Stevia Regional Analysis and Outlook
8.4.2. Japan Food and Beverage Stevia Regional Analysis and Outlook
8.4.3. India Food and Beverage Stevia Regional Analysis and Outlook
8.4.4. South Korea Food and Beverage Stevia Regional Analysis and Outlook
8.4.5. Australia Food and Beverage Stevia Regional Analysis and Outlook
8.4.6. South East Asia Food and Beverage Stevia Regional Analysis and Outlook
8.4.7. Rest of Asia Pacific Food and Beverage Stevia Regional Analysis and Outlook
8.5. South America Food and Beverage Stevia Revenue (USD Million), by Country (2021-2032)
8.5.1. Brazil Food and Beverage Stevia Regional Analysis and Outlook
8.5.2. Argentina Food and Beverage Stevia Regional Analysis and Outlook
8.5.3. Rest of South America Food and Beverage Stevia Regional Analysis and Outlook
8.6. Middle East and Africa Food and Beverage Stevia Revenue (USD Million) by Country (2021-2032)
8.6.1. Middle East Food and Beverage Stevia Regional Analysis and Outlook
8.6.2. Africa Food and Beverage Stevia Regional Analysis and Outlook
Chapter 9. North America Food and Beverage Stevia Analysis and Outlook
9.1. North America Food and Beverage Stevia Revenue (USD Million) by Segments (2021-2032)
9.1.1. North America Food and Beverage Stevia Revenue (USD Million) by Type (2021-2032)
9.1.2. North America Food and Beverage Stevia Revenue (USD Million) by Application (2021-2032)
9.1.3. North America Food and Beverage Stevia Revenue (USD Million) by Product (2021-2032)
By Type
Reb-A Series
Reb D
Reb M
STV Series
Others
By Application
Beverage
Food Ingredient
Table Sweetener
Chapter 10. Europe Food and Beverage Stevia Analysis and Outlook
10.1. Europe Food and Beverage Stevia Revenue (USD Million), by Segments (USD Million) (2021-2032)
10.1.1. Europe Food and Beverage Stevia Revenue (USD Million) by Type (2021-2032)
10.1.2. Europe Food and Beverage Stevia Revenue (USD Million) by Application (2021-2032)
10.1.3. Europe Food and Beverage Stevia Revenue (USD Million) by Product (2021-2032)
By Type
Reb-A Series
Reb D
Reb M
STV Series
Others
By Application
Beverage
Food Ingredient
Table Sweetener
Chapter 11. Asia Pacific Food and Beverage Stevia Analysis and Outlook
11.1. Asia Pacific Food and Beverage Stevia Revenue (USD Million), and Revenue (USD Million) by Segments (2021-2032)
11.1.1. Asia Pacific Food and Beverage Stevia Revenue (USD Million) by Type (2021-2032)
11.1.2. Asia Pacific Food and Beverage Stevia Revenue (USD Million) by Application (2021-2032)
11.1.3. Asia Pacific Food and Beverage Stevia Revenue (USD Million) by Product (2021-2032)
By Type
Reb-A Series
Reb D
Reb M
STV Series
Others
By Application
Beverage
Food Ingredient
Table Sweetener
Chapter 12. South America Food and Beverage Stevia Analysis and Outlook
12.1. South America Food and Beverage Stevia Revenue (USD Million), by Segments (2021-2032)
12.1.1. South America Food and Beverage Stevia Revenue (USD Million) by Type (2021-2032)
12.1.2. South America Food and Beverage Stevia Revenue (USD Million) by Application (2021-2032)
12.1.3. South America Food and Beverage Stevia Revenue (USD Million) by Product (2021-2032)
By Type
Reb-A Series
Reb D
Reb M
STV Series
Others
By Application
Beverage
Food Ingredient
Table Sweetener
Chapter 13. Middle East and Africa Food and Beverage Stevia Analysis and Outlook
13.1. Middle East and Africa Food and Beverage Stevia Revenue (USD Million), by Segments (2021-2032)
13.1.1. Middle East and Africa Food and Beverage Stevia Revenue (USD Million) by Type (2021-2032)
13.1.2. Middle East and Africa Food and Beverage Stevia Revenue (USD Million) by Application (2021-2032)
13.1.3. Middle East and Africa Food and Beverage Stevia Revenue (USD Million) by Product (2021-2032)
By Type
Reb-A Series
Reb D
Reb M
STV Series
Others
By Application
Beverage
Food Ingredient
Table Sweetener
Chapter 14. Food and Beverage Stevia Company Profiles
14.1 Business Overview
14.2 Product Profiles
14.3 SWOT Profiles
14.5 Recent Developments
14.6 Financial Profile
List of Companies
Archer-Daniels-Midland Company (ADM)
Biolotus Technology
Cargill Inc
Chenguang Biotech Group
Daepyung
GLG Life Tech Corp
Haotian Pharm
Ingredion Inc
Jining Aoxing Stevia Products
Morita Kagaku Kogyo
Qufu Tianyuan Biotechnology
Shandong Shengxiangyuan
Shangdong Huaxian Stevia
Sunwin Stevia
Tate & Lyle PLC
15. Methodology and Data Sources
15.1 Customization Offerings
15.2 Subscription Services
15.3 Related Reports
15.4 Publisher Expertise
LIST OF TABLES
Table 1 Market Segmentation Analysis
Table 2 Global Food and Beverage Stevia Market Share of Leading Companies, 2023
Table 3 Product Offerings of Leading Companies
Table 4 Low Growth Scenario Forecasts
Table 5 Reference Case Growth Scenario
Table 6 High Growth Case Scenario
Table 7 Global Food and Beverage Stevia Revenue (USD Million) And CAGR (%) By Type (2021-2032)
Table 8 Global Food and Beverage Stevia Revenue (USD Million) And CAGR (%) By Application (2021-2032)
Table 9 Global Food and Beverage Stevia Revenue (USD Million) And CAGR (%) By Product (2021-2032)
Table 10 Global Food and Beverage Stevia Market Revenue (USD Million) By Regions (2021-2032)
Table 11 Global Food and Beverage Stevia Market Share (%) By Regions (2021-2032)
Table 12 North America Food and Beverage Stevia Revenue (USD Million) By Country (2021-2032)
Table 13 Europe Food and Beverage Stevia Revenue (USD Million) By Country (2021-2032)
Table 14 Asia Pacific Food and Beverage Stevia Revenue (USD Million) By Country (2021-2032)
Table 15 South America Food and Beverage Stevia Revenue (USD Million) By Country (2021-2032)
Table 16 Middle East and Africa Food and Beverage Stevia Revenue (USD Million) By Region (2021-2032)
Table 17 North America Food and Beverage Stevia Revenue (USD Million) By Type (2021-2032)
Table 18 North America Food and Beverage Stevia Revenue (USD Million) By Application (2021-2032)
Table 19 North America Food and Beverage Stevia Revenue (USD Million) By Product (2021-2032)
Table 20 Europe Food and Beverage Stevia Revenue (USD Million) By Type (2021-2032)
Table 21 Europe Food and Beverage Stevia Revenue (USD Million) By Application (2021-2032)
Table 22 Europe Food and Beverage Stevia Revenue (USD Million) By Product (2021-2032)
Table 23 Asia Pacific Food and Beverage Stevia Revenue (USD Million) By Type (2021-2032)
Table 24 Asia Pacific Food and Beverage Stevia Revenue (USD Million) By Application (2021-2032)
Table 25 Asia Pacific Food and Beverage Stevia Revenue (USD Million) By Product (2021-2032)
Table 26 South America Food and Beverage Stevia Revenue (USD Million) By Type (2021-2032)
Table 27 South America Food and Beverage Stevia Revenue (USD Million) By Application (2021-2032)
Table 28 South America Food and Beverage Stevia Revenue (USD Million) By Product (2021-2032)
Table 29 Middle East and Africa Food and Beverage Stevia Revenue (USD Million) By Type (2021-2032)
Table 30 Middle East and Africa Food and Beverage Stevia Revenue (USD Million) By Application (2021-2032)
Table 31 Middle East and Africa Food and Beverage Stevia Revenue (USD Million) By Product (2021-2032)
LIST OF FIGURES
Figure 1. Market Scope
Figure 2. Pricing Forecasts Per Unit, 2023- 2032
Figure 3. Porter’s Five Forces
Figure 4. Global Food and Beverage Stevia Market Revenue (USD Million) By Regions (2021-2032)
Figure 5. Global Food and Beverage Stevia Market Share (%) By Regions (2023)
Figure 6. North America Food and Beverage Stevia Revenue (USD Million) By Country (2021-2032)
Figure 7. United States Food and Beverage Stevia Revenue (USD Million) By Country (2021-2032)
Figure 8. Canada Food and Beverage Stevia Revenue (USD Million) By Country (2021-2032)
Figure 9. Mexico Food and Beverage Stevia Revenue (USD Million) By Country (2021-2032)
Figure 10. Europe Food and Beverage Stevia Revenue (USD Million) By Country (2021-2032)
Figure 11. Germany Food and Beverage Stevia Revenue (USD Million) By Country (2021-2032)
Figure 12. France Food and Beverage Stevia Revenue (USD Million) By Country (2021-2032)
Figure 13. United Kingdom Food and Beverage Stevia Revenue (USD Million) By Country (2021-2032)
Figure 14. Spain Food and Beverage Stevia Revenue (USD Million) By Country (2021-2032)
Figure 15. Italy Food and Beverage Stevia Revenue (USD Million) By Country (2021-2032)
Figure 16. Russia Food and Beverage Stevia Revenue (USD Million) By Country (2021-2032)
Figure 17. Rest of Europe Food and Beverage Stevia Revenue (USD Million) By Country (2021-2032)
Figure 11. Asia Pacific Food and Beverage Stevia Revenue (USD Million) By Country (2021-2032)
Figure 12. China Food and Beverage Stevia Revenue (USD Million) By Country (2021-2032)
Figure 13. Japan Food and Beverage Stevia Revenue (USD Million) By Country (2021-2032)
Figure 14. India Food and Beverage Stevia Revenue (USD Million) By Country (2021-2032)
Figure 15. South Korea Food and Beverage Stevia Revenue (USD Million) By Country (2021-2032)
Figure 16. Australia Food and Beverage Stevia Revenue (USD Million) By Country (2021-2032)
Figure 17. South East Asia Food and Beverage Stevia Revenue (USD Million) By Country (2021-2032)
Figure 18. South America Food and Beverage Stevia Revenue (USD Million) By Country (2021-2032)
Figure 19. Brazil Food and Beverage Stevia Revenue (USD Million) By Country (2021-2032)
Figure 20. Argentina Food and Beverage Stevia Revenue (USD Million) By Country (2021-2032)
Figure 21. Rest of Asia Pacific Food and Beverage Stevia Revenue (USD Million) By Country (2021-2032)
Figure 22. Middle East and Africa Food and Beverage Stevia Revenue (USD Million) By Region (2021-2032)
Figure 23. Saudi Arabia Food and Beverage Stevia Revenue (USD Million) By Region (2021-2032)
Figure 24. The UAE Food and Beverage Stevia Revenue (USD Million) By Region (2021-2032)
Figure 25. Rest of Middle East Food and Beverage Stevia Revenue (USD Million) By Region (2021-2032)
Figure 26. South Africa Food and Beverage Stevia Revenue (USD Million) By Region (2021-2032)
Figure 27. Africa Food and Beverage Stevia Revenue (USD Million) By Region (2021-2032)
Figure 28. North America Food and Beverage Stevia Revenue (USD Million) By Type (2021-2032)
Figure 29. North America Food and Beverage Stevia Revenue (USD Million) By Application (2021-2032)
Figure 30. North America Food and Beverage Stevia Revenue (USD Million) By Product (2021-2032)
Figure 31. Europe Food and Beverage Stevia Revenue (USD Million) By Type (2021-2032)
Figure 32. Europe Food and Beverage Stevia Revenue (USD Million) By Application (2021-2032)
Figure 33. Europe Food and Beverage Stevia Revenue (USD Million) By Product (2021-2032)
Figure 34. Asia Pacific Food and Beverage Stevia Revenue (USD Million) By Type (2021-2032)
Figure 35. Asia Pacific Food and Beverage Stevia Revenue (USD Million) By Application (2021-2032)
Figure 36. Asia Pacific Food and Beverage Stevia Revenue (USD Million) By Product (2021-2032)
Figure 37. South America Food and Beverage Stevia Revenue (USD Million) By Type (2021-2032)
Figure 38. South America Food and Beverage Stevia Revenue (USD Million) By Application (2021-2032)
Figure 39. South America Food and Beverage Stevia Revenue (USD Million) By Product (2021-2032)
Figure 40. Middle East and Africa Food and Beverage Stevia Revenue (USD Million) By Type (2021-2032)
Figure 41. Middle East and Africa Food and Beverage Stevia Revenue (USD Million) By Application (2021-2032)
Figure 42. Middle East and Africa Food and Beverage Stevia Revenue (USD Million) By Product (2021-2032)
By Type
Reb-A Series
Reb D
Reb M
STV Series
Others
By Application
Beverage
Food Ingredient
Table Sweetener
Countries Analyzed
North America (US, Canada, Mexico)
Europe (Germany, UK, France, Spain, Italy, Russia, Rest of Europe)
Asia Pacific (China, India, Japan, South Korea, Australia, South East Asia, Rest of Asia)
South America (Brazil, Argentina, Rest of South America)
Middle East and Africa (Saudi Arabia, UAE, Rest of Middle East, South Africa, Egypt, Rest of Africa)
