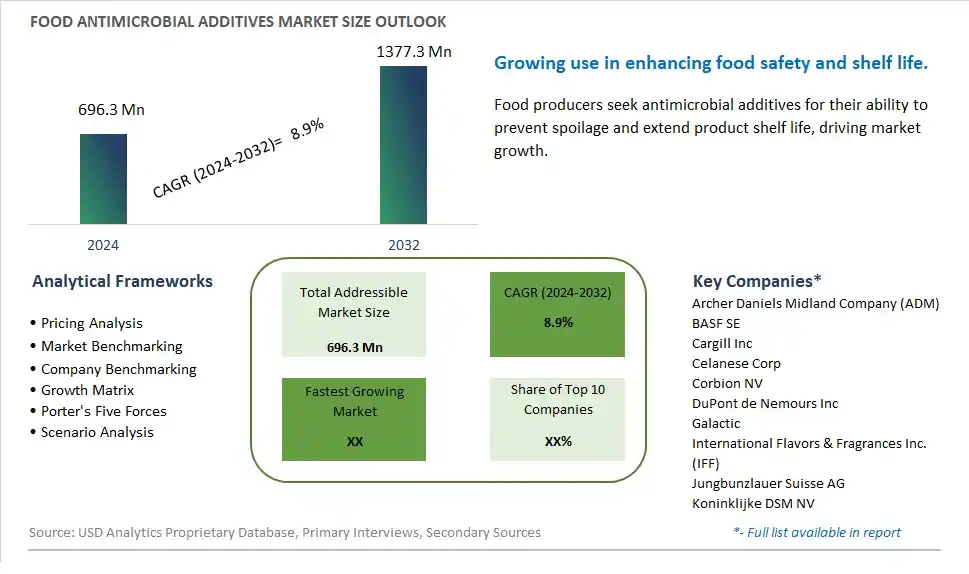
Global Food Antimicrobial Additives Market Size is valued at $696.3 Million in 2024 and is forecast to register a growth rate (CAGR) of 8.9% to reach $1377.3 Million by 2032.
The global Food Antimicrobial Additives Market Comprehensive Study analyzes and forecasts the market size across 6 regions and 24 countries for diverse segments -By Type (Natural, -Nisin, -Natamycin, -Vinegar, - Others, Synthetic, -Benzoates, -Nitrites, -Sorbates, -Propionates, -Lactates, -Acetates, -Others), By Application (Bakery and Confectionery, Dairy Products, Snacks and Savory, Beverages, Meat and Meat Products, Others)
An Introduction to Food Antimicrobial Additives Market
In 2024, the Food Antimicrobial Additives market is witnessing robust growth, driven by the increasing demand for food safety and shelf-life extension. Antimicrobial additives, used to inhibit the growth of bacteria, molds, and yeasts, are essential in various food applications including meats, dairy, and beverages. The market benefits from advancements in food preservation technologies, the growing trend of clean label and natural preservatives, and the expansion of the processed food sector. Additionally, the rising awareness of foodborne illnesses and the need for food safety regulations are contributing to market growth.
Food Antimicrobial Additives Competitive Landscape
The market report analyses the leading companies in the industry including Archer Daniels Midland Company (ADM), BASF SE, Cargill Inc, Celanese Corp, Corbion NV, DuPont de Nemours Inc, Galactic, International Flavors & Fragrances Inc. (IFF), Jungbunzlauer Suisse AG, Koninklijke DSM NV, and Others.
Food Antimicrobial Additives Market Dynamics
Food Antimicrobial Additives Market Trend: Focus on Food Safety and Shelf Life Extension
One prominent trend in the food antimicrobial additives market is the increasing focus on food safety and shelf life extension. With growing concerns about foodborne illnesses, contamination, and spoilage, food manufacturers are incorporating antimicrobial additives into their products to inhibit the growth of harmful microorganisms and extend shelf life. This trend is driven by regulatory requirements, consumer demand for safe and high-quality food products, and the need for innovative solutions to preserve freshness and maintain product integrity throughout the supply chain. Antimicrobial additives play a crucial role in enhancing food safety standards, reducing waste, and ensuring consumer confidence in the safety and longevity of food products.
Food Antimicrobial Additives Market Driver: Rising Demand for Clean Label and Natural Ingredients
A key driver propelling the food antimicrobial additives market is the rising demand for clean label and natural ingredients in food products. As consumers become more health-conscious and scrutinize food labels, there's a preference for antimicrobial additives derived from natural sources such as plant extracts, essential oils, and organic compounds. The driver behind this trend is the desire for transparency, authenticity, and sustainability in food manufacturing practices, prompting manufacturers to reformulate their products with clean label antimicrobial solutions that meet regulatory standards while aligning with consumer preferences for natural and minimally processed ingredients.
Food Antimicrobial Additives Market Opportunity: Development of Multi-Functional Antimicrobial Solutions
A significant opportunity in the food antimicrobial additives market lies in the development of multi-functional antimicrobial solutions that offer additional benefits beyond microbial control. Manufacturers can capitalize on this opportunity by innovating antimicrobial additives with functionalities such as antioxidant properties, flavor enhancement, texture modification, and nutritional enrichment. These multi-functional additives not only improve food safety and shelf life but also contribute to product quality, sensory appeal, and health attributes, providing added value to consumers and differentiation for food brands. By addressing multiple consumer needs and offering versatile antimicrobial solutions, companies can expand their market reach, drive product innovation, and stay competitive in the evolving food antimicrobial additives segment.
Food Antimicrobial Additives Market Share Analysis: Natural Antimicrobial Additives segment generated the highest revenue share in the industry
In the Food Antimicrobial Additives Market, the Natural Antimicrobial Additives segment stands out as the largest. Natural additives include substances like nisin, natamycin, vinegar, and others derived from natural sources. These additives are preferred by consumers seeking clean label products and are increasingly used in food preservation to extend shelf life without synthetic chemicals. The demand for natural antimicrobials is driven by health-conscious consumer trends, regulatory pressure towards safer food additives, and the growing preference for natural and organic foods. Manufacturers are responding by incorporating natural antimicrobial additives into a wide range of food products, ensuring both safety and quality while meeting consumer expectations for healthier food choices.
Food Antimicrobial Additives Market Share Analysis: Bakery and Confectionery Application is the fastest growing segment over the forecast period to 2032
Among the segments in the Food Antimicrobial Additives Market, the Bakery and Confectionery application shows the fastest growth potential up to 2032. This segment benefits significantly from antimicrobial additives to enhance food safety and extend product shelf life. The bakery and confectionery industry faces challenges such as mold growth, spoilage, and bacterial contamination, especially in products with high moisture content. Antimicrobial additives play a crucial role in maintaining product freshness and quality throughout the supply chain, from manufacturing to consumer consumption. With increasing consumer demand for fresh and preservative-free baked goods and confectioneries, the adoption of effective antimicrobial solutions in this segment is expected to grow rapidly. Manufacturers are innovating with new formulations and application techniques to address these needs while ensuring compliance with food safety regulations.
Food Antimicrobial Additives Market Segmentation
By Type
Natural
-Nisin
-Natamycin
-Vinegar
- Others
Synthetic
-Benzoates
-Nitrites
-Sorbates
-Propionates
-Lactates
-Acetates
-Others
By Application
Bakery and Confectionery
Dairy Products
Snacks and Savory
Beverages
Meat and Meat Products
Others
Countries Analyzed
North America (US, Canada, Mexico)
Europe (Germany, UK, France, Spain, Italy, Russia, Rest of Europe)
Asia Pacific (China, India, Japan, South Korea, Australia, South East Asia, Rest of Asia)
South America (Brazil, Argentina, Rest of South America)
Middle East and Africa (Saudi Arabia, UAE, Rest of Middle East, South Africa, Egypt, Rest of Africa)
Food Antimicrobial Additives Companies Profiled in the Study
Archer Daniels Midland Company (ADM)
BASF SE
Cargill Inc
Celanese Corp
Corbion NV
DuPont de Nemours Inc
Galactic
International Flavors & Fragrances Inc. (IFF)
Jungbunzlauer Suisse AG
Koninklijke DSM NV
*- List Not Exhaustive
Chapter 1. TABLE OF CONTENTS
Chapter 2. Introduction to Food Antimicrobial Additives Market
2.1. Market Overview
2.2. Key Statistics and Report Highlights
2.3. Scope of the Comprehensive Study
2.3.1. Market Definition
2.3.2 Countries and Regions Covered
2.3.3 Research Objective
2.3.4 Units, Currency, and Conversions
2.3.5 Industry Value Chain
2.4. Key Market Segments
2.5. Key Companies
2.6. Study Period
Chapter 3. Strategic Analysis Review
3.1. Food Antimicrobial Additives Pricing Analysis and Forecast
3.2. Porter’s Five Forces
3.3. Market Ecosystem
3.4. SWOT Analysis
3.5. Regulatory Scenario
3.3. Effects of Inflation, Russia-Ukraine War, moderating economic growth, and other macroeconomic factors
Chapter 4. Competitive Landscape
4.1. Market Share Analysis
4.1.1. Global Food Antimicrobial Additives Market Share by Company, 2023
4.1.2. Product Offerings of Leading Food Antimicrobial Additives Companies
4.2. Market Entropy
4.2.1. New Product Launches in the Industry
4.2.2. Mergers, Acquisitions, Joint ventures, and Partnerships
4.3. Key Strategies and Best Practices
Chapter 5. Global Market Projections: Best, Reference, and Low Case Scenarios
5.1. Growth Analysis- Case Scenario Definitions
5.2. Low Growth Case Scenario Forecasts
5.3. Reference Growth Case Scenario Forecasts
5.4. High Growth Case Scenario Forecasts
Chapter 6. Market Dynamics
6.1. Food Antimicrobial Additives Market Drivers
6.2. Food Antimicrobial Additives Market Challenges
6.6. Food Antimicrobial Additives Market Opportunities
6.4. Food Antimicrobial Additives Market Trends
Chapter 7. Global Food Antimicrobial Additives Market Outlook Trends
7.1. Global Food Antimicrobial Additives Revenue (USD Million) and CAGR (%) by Type (2021-2032)
7.2. Global Food Antimicrobial Additives Revenue (USD Million) and CAGR (%) by Application (2021-2032)
7.3. Global Food Antimicrobial Additives Revenue (USD Million) and CAGR (%) by Product (2021-2032)
By Type
Natural
-Nisin
-Natamycin
-Vinegar
- Others
Synthetic
-Benzoates
-Nitrites
-Sorbates
-Propionates
-Lactates
-Acetates
-Others
By Application
Bakery and Confectionery
Dairy Products
Snacks and Savory
Beverages
Meat and Meat Products
Others
Chapter 8. Global Food Antimicrobial Additives Regional Analysis and Outlook
8.1. Global Food Antimicrobial Additives Revenue (USD Million) By Regions (2021- 2032)
8.2. North America Food Antimicrobial Additives Revenue (USD Million) by Country (2021-2032)
8.2.1. United States Food Antimicrobial Additives Regional Analysis and Outlook
8.2.2. Canada Food Antimicrobial Additives Regional Analysis and Outlook
8.2.3. Mexico Food Antimicrobial Additives Regional Analysis and Outlook
8.3. Europe Food Antimicrobial Additives Revenue (USD Million), by Country (2021-2032)
8.3.1. Germany Food Antimicrobial Additives Regional Analysis and Outlook
8.3.2. France Food Antimicrobial Additives Regional Analysis and Outlook
8.3.3. United Kingdom Food Antimicrobial Additives Regional Analysis and Outlook
8.3.4. Spain Food Antimicrobial Additives Regional Analysis and Outlook
8.3.5. Italy Food Antimicrobial Additives Regional Analysis and Outlook
8.3.6. Russia Food Antimicrobial Additives Regional Analysis and Outlook
8.3.7. Rest of Europe Food Antimicrobial Additives Regional Analysis and Outlook
8.4. Asia Pacific Food Antimicrobial Additives Revenue (USD Million) by Country (2021-2032)
8.4.1. China Food Antimicrobial Additives Regional Analysis and Outlook
8.4.2. Japan Food Antimicrobial Additives Regional Analysis and Outlook
8.4.3. India Food Antimicrobial Additives Regional Analysis and Outlook
8.4.4. South Korea Food Antimicrobial Additives Regional Analysis and Outlook
8.4.5. Australia Food Antimicrobial Additives Regional Analysis and Outlook
8.4.6. South East Asia Food Antimicrobial Additives Regional Analysis and Outlook
8.4.7. Rest of Asia Pacific Food Antimicrobial Additives Regional Analysis and Outlook
8.5. South America Food Antimicrobial Additives Revenue (USD Million), by Country (2021-2032)
8.5.1. Brazil Food Antimicrobial Additives Regional Analysis and Outlook
8.5.2. Argentina Food Antimicrobial Additives Regional Analysis and Outlook
8.5.3. Rest of South America Food Antimicrobial Additives Regional Analysis and Outlook
8.6. Middle East and Africa Food Antimicrobial Additives Revenue (USD Million) by Country (2021-2032)
8.6.1. Middle East Food Antimicrobial Additives Regional Analysis and Outlook
8.6.2. Africa Food Antimicrobial Additives Regional Analysis and Outlook
Chapter 9. North America Food Antimicrobial Additives Analysis and Outlook
9.1. North America Food Antimicrobial Additives Revenue (USD Million) by Segments (2021-2032)
9.1.1. North America Food Antimicrobial Additives Revenue (USD Million) by Type (2021-2032)
9.1.2. North America Food Antimicrobial Additives Revenue (USD Million) by Application (2021-2032)
9.1.3. North America Food Antimicrobial Additives Revenue (USD Million) by Product (2021-2032)
By Type
Natural
-Nisin
-Natamycin
-Vinegar
- Others
Synthetic
-Benzoates
-Nitrites
-Sorbates
-Propionates
-Lactates
-Acetates
-Others
By Application
Bakery and Confectionery
Dairy Products
Snacks and Savory
Beverages
Meat and Meat Products
Others
Chapter 10. Europe Food Antimicrobial Additives Analysis and Outlook
10.1. Europe Food Antimicrobial Additives Revenue (USD Million), by Segments (USD Million) (2021-2032)
10.1.1. Europe Food Antimicrobial Additives Revenue (USD Million) by Type (2021-2032)
10.1.2. Europe Food Antimicrobial Additives Revenue (USD Million) by Application (2021-2032)
10.1.3. Europe Food Antimicrobial Additives Revenue (USD Million) by Product (2021-2032)
By Type
Natural
-Nisin
-Natamycin
-Vinegar
- Others
Synthetic
-Benzoates
-Nitrites
-Sorbates
-Propionates
-Lactates
-Acetates
-Others
By Application
Bakery and Confectionery
Dairy Products
Snacks and Savory
Beverages
Meat and Meat Products
Others
Chapter 11. Asia Pacific Food Antimicrobial Additives Analysis and Outlook
11.1. Asia Pacific Food Antimicrobial Additives Revenue (USD Million), and Revenue (USD Million) by Segments (2021-2032)
11.1.1. Asia Pacific Food Antimicrobial Additives Revenue (USD Million) by Type (2021-2032)
11.1.2. Asia Pacific Food Antimicrobial Additives Revenue (USD Million) by Application (2021-2032)
11.1.3. Asia Pacific Food Antimicrobial Additives Revenue (USD Million) by Product (2021-2032)
By Type
Natural
-Nisin
-Natamycin
-Vinegar
- Others
Synthetic
-Benzoates
-Nitrites
-Sorbates
-Propionates
-Lactates
-Acetates
-Others
By Application
Bakery and Confectionery
Dairy Products
Snacks and Savory
Beverages
Meat and Meat Products
Others
Chapter 12. South America Food Antimicrobial Additives Analysis and Outlook
12.1. South America Food Antimicrobial Additives Revenue (USD Million), by Segments (2021-2032)
12.1.1. South America Food Antimicrobial Additives Revenue (USD Million) by Type (2021-2032)
12.1.2. South America Food Antimicrobial Additives Revenue (USD Million) by Application (2021-2032)
12.1.3. South America Food Antimicrobial Additives Revenue (USD Million) by Product (2021-2032)
By Type
Natural
-Nisin
-Natamycin
-Vinegar
- Others
Synthetic
-Benzoates
-Nitrites
-Sorbates
-Propionates
-Lactates
-Acetates
-Others
By Application
Bakery and Confectionery
Dairy Products
Snacks and Savory
Beverages
Meat and Meat Products
Others
Chapter 13. Middle East and Africa Food Antimicrobial Additives Analysis and Outlook
13.1. Middle East and Africa Food Antimicrobial Additives Revenue (USD Million), by Segments (2021-2032)
13.1.1. Middle East and Africa Food Antimicrobial Additives Revenue (USD Million) by Type (2021-2032)
13.1.2. Middle East and Africa Food Antimicrobial Additives Revenue (USD Million) by Application (2021-2032)
13.1.3. Middle East and Africa Food Antimicrobial Additives Revenue (USD Million) by Product (2021-2032)
By Type
Natural
-Nisin
-Natamycin
-Vinegar
- Others
Synthetic
-Benzoates
-Nitrites
-Sorbates
-Propionates
-Lactates
-Acetates
-Others
By Application
Bakery and Confectionery
Dairy Products
Snacks and Savory
Beverages
Meat and Meat Products
Others
Chapter 14. Food Antimicrobial Additives Company Profiles
14.1 Business Overview
14.2 Product Profiles
14.3 SWOT Profiles
14.5 Recent Developments
14.6 Financial Profile
List of Companies
Archer Daniels Midland Company (ADM)
BASF SE
Cargill Inc
Celanese Corp
Corbion NV
DuPont de Nemours Inc
Galactic
International Flavors & Fragrances Inc. (IFF)
Jungbunzlauer Suisse AG
Koninklijke DSM NV
15. Methodology and Data Sources
15.1 Customization Offerings
15.2 Subscription Services
15.3 Related Reports
15.4 Publisher Expertise
LIST OF TABLES
Table 1 Market Segmentation Analysis
Table 2 Global Food Antimicrobial Additives Market Share of Leading Companies, 2023
Table 3 Product Offerings of Leading Companies
Table 4 Low Growth Scenario Forecasts
Table 5 Reference Case Growth Scenario
Table 6 High Growth Case Scenario
Table 7 Global Food Antimicrobial Additives Revenue (USD Million) And CAGR (%) By Type (2021-2032)
Table 8 Global Food Antimicrobial Additives Revenue (USD Million) And CAGR (%) By Application (2021-2032)
Table 9 Global Food Antimicrobial Additives Revenue (USD Million) And CAGR (%) By Product (2021-2032)
Table 10 Global Food Antimicrobial Additives Market Revenue (USD Million) By Regions (2021-2032)
Table 11 Global Food Antimicrobial Additives Market Share (%) By Regions (2021-2032)
Table 12 North America Food Antimicrobial Additives Revenue (USD Million) By Country (2021-2032)
Table 13 Europe Food Antimicrobial Additives Revenue (USD Million) By Country (2021-2032)
Table 14 Asia Pacific Food Antimicrobial Additives Revenue (USD Million) By Country (2021-2032)
Table 15 South America Food Antimicrobial Additives Revenue (USD Million) By Country (2021-2032)
Table 16 Middle East and Africa Food Antimicrobial Additives Revenue (USD Million) By Region (2021-2032)
Table 17 North America Food Antimicrobial Additives Revenue (USD Million) By Type (2021-2032)
Table 18 North America Food Antimicrobial Additives Revenue (USD Million) By Application (2021-2032)
Table 19 North America Food Antimicrobial Additives Revenue (USD Million) By Product (2021-2032)
Table 20 Europe Food Antimicrobial Additives Revenue (USD Million) By Type (2021-2032)
Table 21 Europe Food Antimicrobial Additives Revenue (USD Million) By Application (2021-2032)
Table 22 Europe Food Antimicrobial Additives Revenue (USD Million) By Product (2021-2032)
Table 23 Asia Pacific Food Antimicrobial Additives Revenue (USD Million) By Type (2021-2032)
Table 24 Asia Pacific Food Antimicrobial Additives Revenue (USD Million) By Application (2021-2032)
Table 25 Asia Pacific Food Antimicrobial Additives Revenue (USD Million) By Product (2021-2032)
Table 26 South America Food Antimicrobial Additives Revenue (USD Million) By Type (2021-2032)
Table 27 South America Food Antimicrobial Additives Revenue (USD Million) By Application (2021-2032)
Table 28 South America Food Antimicrobial Additives Revenue (USD Million) By Product (2021-2032)
Table 29 Middle East and Africa Food Antimicrobial Additives Revenue (USD Million) By Type (2021-2032)
Table 30 Middle East and Africa Food Antimicrobial Additives Revenue (USD Million) By Application (2021-2032)
Table 31 Middle East and Africa Food Antimicrobial Additives Revenue (USD Million) By Product (2021-2032)
LIST OF FIGURES
Figure 1. Market Scope
Figure 2. Pricing Forecasts Per Unit, 2023- 2032
Figure 3. Porter’s Five Forces
Figure 4. Global Food Antimicrobial Additives Market Revenue (USD Million) By Regions (2021-2032)
Figure 5. Global Food Antimicrobial Additives Market Share (%) By Regions (2023)
Figure 6. North America Food Antimicrobial Additives Revenue (USD Million) By Country (2021-2032)
Figure 7. United States Food Antimicrobial Additives Revenue (USD Million) By Country (2021-2032)
Figure 8. Canada Food Antimicrobial Additives Revenue (USD Million) By Country (2021-2032)
Figure 9. Mexico Food Antimicrobial Additives Revenue (USD Million) By Country (2021-2032)
Figure 10. Europe Food Antimicrobial Additives Revenue (USD Million) By Country (2021-2032)
Figure 11. Germany Food Antimicrobial Additives Revenue (USD Million) By Country (2021-2032)
Figure 12. France Food Antimicrobial Additives Revenue (USD Million) By Country (2021-2032)
Figure 13. United Kingdom Food Antimicrobial Additives Revenue (USD Million) By Country (2021-2032)
Figure 14. Spain Food Antimicrobial Additives Revenue (USD Million) By Country (2021-2032)
Figure 15. Italy Food Antimicrobial Additives Revenue (USD Million) By Country (2021-2032)
Figure 16. Russia Food Antimicrobial Additives Revenue (USD Million) By Country (2021-2032)
Figure 17. Rest of Europe Food Antimicrobial Additives Revenue (USD Million) By Country (2021-2032)
Figure 11. Asia Pacific Food Antimicrobial Additives Revenue (USD Million) By Country (2021-2032)
Figure 12. China Food Antimicrobial Additives Revenue (USD Million) By Country (2021-2032)
Figure 13. Japan Food Antimicrobial Additives Revenue (USD Million) By Country (2021-2032)
Figure 14. India Food Antimicrobial Additives Revenue (USD Million) By Country (2021-2032)
Figure 15. South Korea Food Antimicrobial Additives Revenue (USD Million) By Country (2021-2032)
Figure 16. Australia Food Antimicrobial Additives Revenue (USD Million) By Country (2021-2032)
Figure 17. South East Asia Food Antimicrobial Additives Revenue (USD Million) By Country (2021-2032)
Figure 18. South America Food Antimicrobial Additives Revenue (USD Million) By Country (2021-2032)
Figure 19. Brazil Food Antimicrobial Additives Revenue (USD Million) By Country (2021-2032)
Figure 20. Argentina Food Antimicrobial Additives Revenue (USD Million) By Country (2021-2032)
Figure 21. Rest of Asia Pacific Food Antimicrobial Additives Revenue (USD Million) By Country (2021-2032)
Figure 22. Middle East and Africa Food Antimicrobial Additives Revenue (USD Million) By Region (2021-2032)
Figure 23. Saudi Arabia Food Antimicrobial Additives Revenue (USD Million) By Region (2021-2032)
Figure 24. The UAE Food Antimicrobial Additives Revenue (USD Million) By Region (2021-2032)
Figure 25. Rest of Middle East Food Antimicrobial Additives Revenue (USD Million) By Region (2021-2032)
Figure 26. South Africa Food Antimicrobial Additives Revenue (USD Million) By Region (2021-2032)
Figure 27. Africa Food Antimicrobial Additives Revenue (USD Million) By Region (2021-2032)
Figure 28. North America Food Antimicrobial Additives Revenue (USD Million) By Type (2021-2032)
Figure 29. North America Food Antimicrobial Additives Revenue (USD Million) By Application (2021-2032)
Figure 30. North America Food Antimicrobial Additives Revenue (USD Million) By Product (2021-2032)
Figure 31. Europe Food Antimicrobial Additives Revenue (USD Million) By Type (2021-2032)
Figure 32. Europe Food Antimicrobial Additives Revenue (USD Million) By Application (2021-2032)
Figure 33. Europe Food Antimicrobial Additives Revenue (USD Million) By Product (2021-2032)
Figure 34. Asia Pacific Food Antimicrobial Additives Revenue (USD Million) By Type (2021-2032)
Figure 35. Asia Pacific Food Antimicrobial Additives Revenue (USD Million) By Application (2021-2032)
Figure 36. Asia Pacific Food Antimicrobial Additives Revenue (USD Million) By Product (2021-2032)
Figure 37. South America Food Antimicrobial Additives Revenue (USD Million) By Type (2021-2032)
Figure 38. South America Food Antimicrobial Additives Revenue (USD Million) By Application (2021-2032)
Figure 39. South America Food Antimicrobial Additives Revenue (USD Million) By Product (2021-2032)
Figure 40. Middle East and Africa Food Antimicrobial Additives Revenue (USD Million) By Type (2021-2032)
Figure 41. Middle East and Africa Food Antimicrobial Additives Revenue (USD Million) By Application (2021-2032)
Figure 42. Middle East and Africa Food Antimicrobial Additives Revenue (USD Million) By Product (2021-2032)
By Type
Natural
-Nisin
-Natamycin
-Vinegar
- Others
Synthetic
-Benzoates
-Nitrites
-Sorbates
-Propionates
-Lactates
-Acetates
-Others
By Application
Bakery and Confectionery
Dairy Products
Snacks and Savory
Beverages
Meat and Meat Products
Others
Countries Analyzed
North America (US, Canada, Mexico)
Europe (Germany, UK, France, Spain, Italy, Russia, Rest of Europe)
Asia Pacific (China, India, Japan, South Korea, Australia, South East Asia, Rest of Asia)
South America (Brazil, Argentina, Rest of South America)
Middle East and Africa (Saudi Arabia, UAE, Rest of Middle East, South Africa, Egypt, Rest of Africa)
