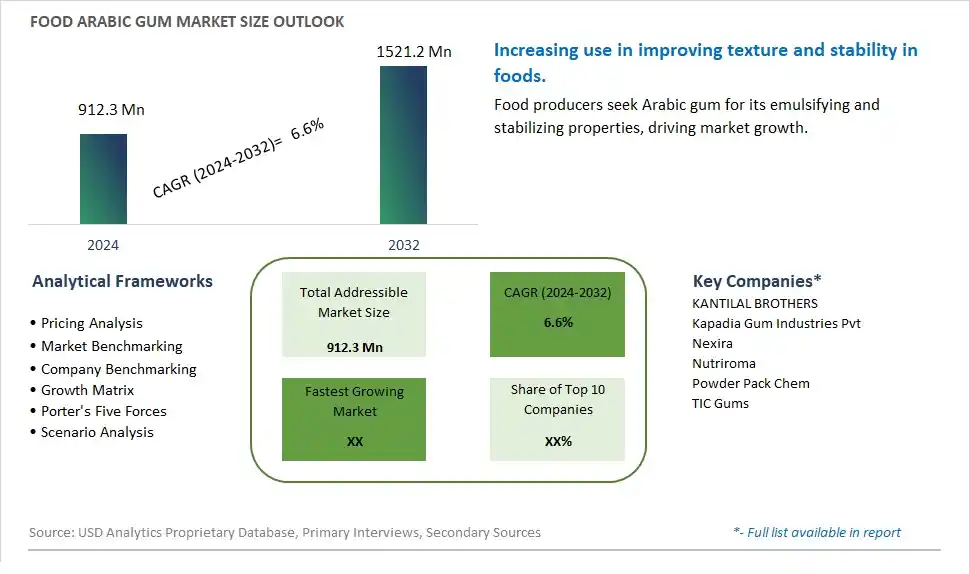
Global Food Arabic Gum Market Size is valued at $912.3 Million in 2024 and is forecast to register a growth rate (CAGR) of 6.6% to reach $1521.2 Million by 2032.
The global Food Arabic Gum Market Comprehensive Study analyzes and forecasts the market size across 6 regions and 24 countries for diverse segments -By Type (Natural Arabic Gum, Synthesis Arabic Gum), By Application (Cotton Candy, Beverage Concentrate, Wine, Others)
An Introduction to Food Arabic Gum Market
In 2024, the Food Arabic Gum market is thriving, fueled by the rising demand for natural and multifunctional food ingredients. Arabic gum, also known as gum acacia, is used as an emulsifier, stabilizer, and thickening agent in various food and beverage applications. The market benefits from advancements in harvesting and processing technologies, the growing trend of clean label and natural ingredients, and the expansion of the functional food sector. Additionally, the increasing awareness of the health benefits of arabic gum, such as its prebiotic properties, is contributing to market growth.
Food Arabic Gum Competitive Landscape
The market report analyses the leading companies in the industry including KANTILAL BROTHERS, Kapadia Gum Industries Pvt, Nexira, Nutriroma, Powder Pack Chem, TIC Gums, and Others.
Food Arabic Gum Market Dynamics
Food Arabic Gum Market Trend: Growing Demand for Natural and Functional Ingredients
One prominent trend in the food Arabic gum market is the growing demand for natural and functional ingredients. Consumers are increasingly seeking food products with clean label profiles, free from artificial additives and synthetic ingredients. Arabic gum, derived from the sap of Acacia trees, aligns with this trend as a natural and versatile ingredient used in various food applications such as confectionery, beverages, and baked goods. This trend is driven by the rising awareness of health-conscious consumers who prioritize wholesome, plant-based ingredients with functional properties such as thickening, stabilizing, and emulsifying capabilities. Arabic gum's natural origin, clean label appeal, and functional benefits contribute to its growing popularity in the food industry.
Food Arabic Gum Market Driver: Functional Properties and Versatility in Food Formulations
A key driver propelling the food Arabic gum market is its functional properties and versatility in food formulations. Arabic gum serves as an effective thickener, stabilizer, and emulsifier, improving texture, mouthfeel, and shelf stability in a wide range of food products. The driver behind this trend is the demand for innovative food solutions that meet consumer preferences for sensory experiences, product quality, and nutritional value. Manufacturers leverage Arabic gum's functional benefits to enhance the performance of food formulations, create smoother textures, extend product shelf life, and reduce the need for synthetic additives, driving market growth and adoption across diverse food segments.
Food Arabic Gum Market Opportunity: Expansion into Health and Wellness Products
A significant opportunity in the food Arabic gum market lies in expanding into health and wellness products that cater to evolving consumer trends and preferences. Manufacturers can capitalize on this opportunity by developing Arabic gum-based formulations for functional foods, dietary supplements, and wellness beverages targeting specific health benefits such as digestive health, satiety, and immune support. Arabic gum's prebiotic properties, soluble fiber content, and low glycemic index make it a suitable ingredient for products promoting gut health, weight management, and overall well-being. Additionally, there's potential for incorporating Arabic gum into plant-based and vegan food alternatives, gluten-free products, and natural sweeteners, tapping into growing market segments and meeting consumer demand for healthy, clean label options in the food and beverage industry. By leveraging Arabic gum's functional attributes and aligning with health and wellness trends, companies can diversify their product offerings, capture new market opportunities, and strengthen their position in the competitive food market.
Food Arabic Gum Market Share Analysis: Natural Arabic Gum segment generated the highest revenue share in the industry
In the Food Arabic Gum Market, the Natural Arabic Gum segment stands out as the largest. Natural Arabic gum, also known as gum arabic, is derived from the acacia tree and is valued for its multifunctional properties in the food industry. It is widely used as a stabilizer, emulsifier, thickening agent, and texture enhancer in various food products. Natural Arabic gum's ability to form stable emulsions and its compatibility with a wide range of food formulations make it a preferred choice among food manufacturers. It finds extensive application in confectionery, beverages, bakery products, and dietary supplements due to its natural origin and functional benefits. The demand for natural Arabic gum is driven by its clean label appeal, consumer preference for natural ingredients, and its role in enhancing the sensory characteristics and shelf stability of food products.
Food Arabic Gum Market Share Analysis: Beverage Concentrate Application is the fastest growing segment over the forecast period to 2032
Among the segments in the Food Arabic Gum Market, the Beverage Concentrate application is experiencing the fastest growth trajectory to 2032. Arabic gum is increasingly used in beverage concentrates to improve stability, viscosity, and mouthfeel. In beverage applications, it serves as a stabilizer for flavor emulsions, preventing phase separation and sedimentation during storage and distribution. Beverage concentrates, including flavored drinks, syrups, and functional beverages, require ingredients like Arabic gum to maintain product quality and enhance consumer appeal. With growing demand for ready-to-drink beverages and innovative beverage formulations, the use of Arabic gum in beverage concentrates is expected to expand significantly. Manufacturers are focusing on developing customized solutions and formulations that cater to specific beverage types and consumer preferences, driving the adoption of Arabic gum in this segment.
Food Arabic Gum Market Segmentation
By Type
Natural Arabic Gum
Synthesis Arabic Gum
By Application
Cotton Candy
Beverage Concentrate
Wine
Others
Countries Analyzed
North America (US, Canada, Mexico)
Europe (Germany, UK, France, Spain, Italy, Russia, Rest of Europe)
Asia Pacific (China, India, Japan, South Korea, Australia, South East Asia, Rest of Asia)
South America (Brazil, Argentina, Rest of South America)
Middle East and Africa (Saudi Arabia, UAE, Rest of Middle East, South Africa, Egypt, Rest of Africa)
Food Arabic Gum Companies Profiled in the Study
KANTILAL BROTHERS
Kapadia Gum Industries Pvt
Nexira
Nutriroma
Powder Pack Chem
TIC Gums
*- List Not Exhaustive
Chapter 1. TABLE OF CONTENTS
Chapter 2. Introduction to Food Arabic Gum Market
2.1. Market Overview
2.2. Key Statistics and Report Highlights
2.3. Scope of the Comprehensive Study
2.3.1. Market Definition
2.3.2 Countries and Regions Covered
2.3.3 Research Objective
2.3.4 Units, Currency, and Conversions
2.3.5 Industry Value Chain
2.4. Key Market Segments
2.5. Key Companies
2.6. Study Period
Chapter 3. Strategic Analysis Review
3.1. Food Arabic Gum Pricing Analysis and Forecast
3.2. Porter’s Five Forces
3.3. Market Ecosystem
3.4. SWOT Analysis
3.5. Regulatory Scenario
3.3. Effects of Inflation, Russia-Ukraine War, moderating economic growth, and other macroeconomic factors
Chapter 4. Competitive Landscape
4.1. Market Share Analysis
4.1.1. Global Food Arabic Gum Market Share by Company, 2023
4.1.2. Product Offerings of Leading Food Arabic Gum Companies
4.2. Market Entropy
4.2.1. New Product Launches in the Industry
4.2.2. Mergers, Acquisitions, Joint ventures, and Partnerships
4.3. Key Strategies and Best Practices
Chapter 5. Global Market Projections: Best, Reference, and Low Case Scenarios
5.1. Growth Analysis- Case Scenario Definitions
5.2. Low Growth Case Scenario Forecasts
5.3. Reference Growth Case Scenario Forecasts
5.4. High Growth Case Scenario Forecasts
Chapter 6. Market Dynamics
6.1. Food Arabic Gum Market Drivers
6.2. Food Arabic Gum Market Challenges
6.6. Food Arabic Gum Market Opportunities
6.4. Food Arabic Gum Market Trends
Chapter 7. Global Food Arabic Gum Market Outlook Trends
7.1. Global Food Arabic Gum Revenue (USD Million) and CAGR (%) by Type (2021-2032)
7.2. Global Food Arabic Gum Revenue (USD Million) and CAGR (%) by Application (2021-2032)
7.3. Global Food Arabic Gum Revenue (USD Million) and CAGR (%) by Product (2021-2032)
By Type
Natural Arabic Gum
Synthesis Arabic Gum
By Application
Cotton Candy
Beverage Concentrate
Wine
Others
Chapter 8. Global Food Arabic Gum Regional Analysis and Outlook
8.1. Global Food Arabic Gum Revenue (USD Million) By Regions (2021- 2032)
8.2. North America Food Arabic Gum Revenue (USD Million) by Country (2021-2032)
8.2.1. United States Food Arabic Gum Regional Analysis and Outlook
8.2.2. Canada Food Arabic Gum Regional Analysis and Outlook
8.2.3. Mexico Food Arabic Gum Regional Analysis and Outlook
8.3. Europe Food Arabic Gum Revenue (USD Million), by Country (2021-2032)
8.3.1. Germany Food Arabic Gum Regional Analysis and Outlook
8.3.2. France Food Arabic Gum Regional Analysis and Outlook
8.3.3. United Kingdom Food Arabic Gum Regional Analysis and Outlook
8.3.4. Spain Food Arabic Gum Regional Analysis and Outlook
8.3.5. Italy Food Arabic Gum Regional Analysis and Outlook
8.3.6. Russia Food Arabic Gum Regional Analysis and Outlook
8.3.7. Rest of Europe Food Arabic Gum Regional Analysis and Outlook
8.4. Asia Pacific Food Arabic Gum Revenue (USD Million) by Country (2021-2032)
8.4.1. China Food Arabic Gum Regional Analysis and Outlook
8.4.2. Japan Food Arabic Gum Regional Analysis and Outlook
8.4.3. India Food Arabic Gum Regional Analysis and Outlook
8.4.4. South Korea Food Arabic Gum Regional Analysis and Outlook
8.4.5. Australia Food Arabic Gum Regional Analysis and Outlook
8.4.6. South East Asia Food Arabic Gum Regional Analysis and Outlook
8.4.7. Rest of Asia Pacific Food Arabic Gum Regional Analysis and Outlook
8.5. South America Food Arabic Gum Revenue (USD Million), by Country (2021-2032)
8.5.1. Brazil Food Arabic Gum Regional Analysis and Outlook
8.5.2. Argentina Food Arabic Gum Regional Analysis and Outlook
8.5.3. Rest of South America Food Arabic Gum Regional Analysis and Outlook
8.6. Middle East and Africa Food Arabic Gum Revenue (USD Million) by Country (2021-2032)
8.6.1. Middle East Food Arabic Gum Regional Analysis and Outlook
8.6.2. Africa Food Arabic Gum Regional Analysis and Outlook
Chapter 9. North America Food Arabic Gum Analysis and Outlook
9.1. North America Food Arabic Gum Revenue (USD Million) by Segments (2021-2032)
9.1.1. North America Food Arabic Gum Revenue (USD Million) by Type (2021-2032)
9.1.2. North America Food Arabic Gum Revenue (USD Million) by Application (2021-2032)
9.1.3. North America Food Arabic Gum Revenue (USD Million) by Product (2021-2032)
By Type
Natural Arabic Gum
Synthesis Arabic Gum
By Application
Cotton Candy
Beverage Concentrate
Wine
Others
Chapter 10. Europe Food Arabic Gum Analysis and Outlook
10.1. Europe Food Arabic Gum Revenue (USD Million), by Segments (USD Million) (2021-2032)
10.1.1. Europe Food Arabic Gum Revenue (USD Million) by Type (2021-2032)
10.1.2. Europe Food Arabic Gum Revenue (USD Million) by Application (2021-2032)
10.1.3. Europe Food Arabic Gum Revenue (USD Million) by Product (2021-2032)
By Type
Natural Arabic Gum
Synthesis Arabic Gum
By Application
Cotton Candy
Beverage Concentrate
Wine
Others
Chapter 11. Asia Pacific Food Arabic Gum Analysis and Outlook
11.1. Asia Pacific Food Arabic Gum Revenue (USD Million), and Revenue (USD Million) by Segments (2021-2032)
11.1.1. Asia Pacific Food Arabic Gum Revenue (USD Million) by Type (2021-2032)
11.1.2. Asia Pacific Food Arabic Gum Revenue (USD Million) by Application (2021-2032)
11.1.3. Asia Pacific Food Arabic Gum Revenue (USD Million) by Product (2021-2032)
By Type
Natural Arabic Gum
Synthesis Arabic Gum
By Application
Cotton Candy
Beverage Concentrate
Wine
Others
Chapter 12. South America Food Arabic Gum Analysis and Outlook
12.1. South America Food Arabic Gum Revenue (USD Million), by Segments (2021-2032)
12.1.1. South America Food Arabic Gum Revenue (USD Million) by Type (2021-2032)
12.1.2. South America Food Arabic Gum Revenue (USD Million) by Application (2021-2032)
12.1.3. South America Food Arabic Gum Revenue (USD Million) by Product (2021-2032)
By Type
Natural Arabic Gum
Synthesis Arabic Gum
By Application
Cotton Candy
Beverage Concentrate
Wine
Others
Chapter 13. Middle East and Africa Food Arabic Gum Analysis and Outlook
13.1. Middle East and Africa Food Arabic Gum Revenue (USD Million), by Segments (2021-2032)
13.1.1. Middle East and Africa Food Arabic Gum Revenue (USD Million) by Type (2021-2032)
13.1.2. Middle East and Africa Food Arabic Gum Revenue (USD Million) by Application (2021-2032)
13.1.3. Middle East and Africa Food Arabic Gum Revenue (USD Million) by Product (2021-2032)
By Type
Natural Arabic Gum
Synthesis Arabic Gum
By Application
Cotton Candy
Beverage Concentrate
Wine
Others
Chapter 14. Food Arabic Gum Company Profiles
14.1 Business Overview
14.2 Product Profiles
14.3 SWOT Profiles
14.5 Recent Developments
14.6 Financial Profile
List of Companies
KANTILAL BROTHERS
Kapadia Gum Industries Pvt
Nexira
Nutriroma
Powder Pack Chem
TIC Gums
15. Methodology and Data Sources
15.1 Customization Offerings
15.2 Subscription Services
15.3 Related Reports
15.4 Publisher Expertise
LIST OF TABLES
Table 1 Market Segmentation Analysis
Table 2 Global Food Arabic Gum Market Share of Leading Companies, 2023
Table 3 Product Offerings of Leading Companies
Table 4 Low Growth Scenario Forecasts
Table 5 Reference Case Growth Scenario
Table 6 High Growth Case Scenario
Table 7 Global Food Arabic Gum Revenue (USD Million) And CAGR (%) By Type (2021-2032)
Table 8 Global Food Arabic Gum Revenue (USD Million) And CAGR (%) By Application (2021-2032)
Table 9 Global Food Arabic Gum Revenue (USD Million) And CAGR (%) By Product (2021-2032)
Table 10 Global Food Arabic Gum Market Revenue (USD Million) By Regions (2021-2032)
Table 11 Global Food Arabic Gum Market Share (%) By Regions (2021-2032)
Table 12 North America Food Arabic Gum Revenue (USD Million) By Country (2021-2032)
Table 13 Europe Food Arabic Gum Revenue (USD Million) By Country (2021-2032)
Table 14 Asia Pacific Food Arabic Gum Revenue (USD Million) By Country (2021-2032)
Table 15 South America Food Arabic Gum Revenue (USD Million) By Country (2021-2032)
Table 16 Middle East and Africa Food Arabic Gum Revenue (USD Million) By Region (2021-2032)
Table 17 North America Food Arabic Gum Revenue (USD Million) By Type (2021-2032)
Table 18 North America Food Arabic Gum Revenue (USD Million) By Application (2021-2032)
Table 19 North America Food Arabic Gum Revenue (USD Million) By Product (2021-2032)
Table 20 Europe Food Arabic Gum Revenue (USD Million) By Type (2021-2032)
Table 21 Europe Food Arabic Gum Revenue (USD Million) By Application (2021-2032)
Table 22 Europe Food Arabic Gum Revenue (USD Million) By Product (2021-2032)
Table 23 Asia Pacific Food Arabic Gum Revenue (USD Million) By Type (2021-2032)
Table 24 Asia Pacific Food Arabic Gum Revenue (USD Million) By Application (2021-2032)
Table 25 Asia Pacific Food Arabic Gum Revenue (USD Million) By Product (2021-2032)
Table 26 South America Food Arabic Gum Revenue (USD Million) By Type (2021-2032)
Table 27 South America Food Arabic Gum Revenue (USD Million) By Application (2021-2032)
Table 28 South America Food Arabic Gum Revenue (USD Million) By Product (2021-2032)
Table 29 Middle East and Africa Food Arabic Gum Revenue (USD Million) By Type (2021-2032)
Table 30 Middle East and Africa Food Arabic Gum Revenue (USD Million) By Application (2021-2032)
Table 31 Middle East and Africa Food Arabic Gum Revenue (USD Million) By Product (2021-2032)
LIST OF FIGURES
Figure 1. Market Scope
Figure 2. Pricing Forecasts Per Unit, 2023- 2032
Figure 3. Porter’s Five Forces
Figure 4. Global Food Arabic Gum Market Revenue (USD Million) By Regions (2021-2032)
Figure 5. Global Food Arabic Gum Market Share (%) By Regions (2023)
Figure 6. North America Food Arabic Gum Revenue (USD Million) By Country (2021-2032)
Figure 7. United States Food Arabic Gum Revenue (USD Million) By Country (2021-2032)
Figure 8. Canada Food Arabic Gum Revenue (USD Million) By Country (2021-2032)
Figure 9. Mexico Food Arabic Gum Revenue (USD Million) By Country (2021-2032)
Figure 10. Europe Food Arabic Gum Revenue (USD Million) By Country (2021-2032)
Figure 11. Germany Food Arabic Gum Revenue (USD Million) By Country (2021-2032)
Figure 12. France Food Arabic Gum Revenue (USD Million) By Country (2021-2032)
Figure 13. United Kingdom Food Arabic Gum Revenue (USD Million) By Country (2021-2032)
Figure 14. Spain Food Arabic Gum Revenue (USD Million) By Country (2021-2032)
Figure 15. Italy Food Arabic Gum Revenue (USD Million) By Country (2021-2032)
Figure 16. Russia Food Arabic Gum Revenue (USD Million) By Country (2021-2032)
Figure 17. Rest of Europe Food Arabic Gum Revenue (USD Million) By Country (2021-2032)
Figure 11. Asia Pacific Food Arabic Gum Revenue (USD Million) By Country (2021-2032)
Figure 12. China Food Arabic Gum Revenue (USD Million) By Country (2021-2032)
Figure 13. Japan Food Arabic Gum Revenue (USD Million) By Country (2021-2032)
Figure 14. India Food Arabic Gum Revenue (USD Million) By Country (2021-2032)
Figure 15. South Korea Food Arabic Gum Revenue (USD Million) By Country (2021-2032)
Figure 16. Australia Food Arabic Gum Revenue (USD Million) By Country (2021-2032)
Figure 17. South East Asia Food Arabic Gum Revenue (USD Million) By Country (2021-2032)
Figure 18. South America Food Arabic Gum Revenue (USD Million) By Country (2021-2032)
Figure 19. Brazil Food Arabic Gum Revenue (USD Million) By Country (2021-2032)
Figure 20. Argentina Food Arabic Gum Revenue (USD Million) By Country (2021-2032)
Figure 21. Rest of Asia Pacific Food Arabic Gum Revenue (USD Million) By Country (2021-2032)
Figure 22. Middle East and Africa Food Arabic Gum Revenue (USD Million) By Region (2021-2032)
Figure 23. Saudi Arabia Food Arabic Gum Revenue (USD Million) By Region (2021-2032)
Figure 24. The UAE Food Arabic Gum Revenue (USD Million) By Region (2021-2032)
Figure 25. Rest of Middle East Food Arabic Gum Revenue (USD Million) By Region (2021-2032)
Figure 26. South Africa Food Arabic Gum Revenue (USD Million) By Region (2021-2032)
Figure 27. Africa Food Arabic Gum Revenue (USD Million) By Region (2021-2032)
Figure 28. North America Food Arabic Gum Revenue (USD Million) By Type (2021-2032)
Figure 29. North America Food Arabic Gum Revenue (USD Million) By Application (2021-2032)
Figure 30. North America Food Arabic Gum Revenue (USD Million) By Product (2021-2032)
Figure 31. Europe Food Arabic Gum Revenue (USD Million) By Type (2021-2032)
Figure 32. Europe Food Arabic Gum Revenue (USD Million) By Application (2021-2032)
Figure 33. Europe Food Arabic Gum Revenue (USD Million) By Product (2021-2032)
Figure 34. Asia Pacific Food Arabic Gum Revenue (USD Million) By Type (2021-2032)
Figure 35. Asia Pacific Food Arabic Gum Revenue (USD Million) By Application (2021-2032)
Figure 36. Asia Pacific Food Arabic Gum Revenue (USD Million) By Product (2021-2032)
Figure 37. South America Food Arabic Gum Revenue (USD Million) By Type (2021-2032)
Figure 38. South America Food Arabic Gum Revenue (USD Million) By Application (2021-2032)
Figure 39. South America Food Arabic Gum Revenue (USD Million) By Product (2021-2032)
Figure 40. Middle East and Africa Food Arabic Gum Revenue (USD Million) By Type (2021-2032)
Figure 41. Middle East and Africa Food Arabic Gum Revenue (USD Million) By Application (2021-2032)
Figure 42. Middle East and Africa Food Arabic Gum Revenue (USD Million) By Product (2021-2032)
By Type
Natural Arabic Gum
Synthesis Arabic Gum
By Application
Cotton Candy
Beverage Concentrate
Wine
Others
Countries Analyzed
North America (US, Canada, Mexico)
Europe (Germany, UK, France, Spain, Italy, Russia, Rest of Europe)
Asia Pacific (China, India, Japan, South Korea, Australia, South East Asia, Rest of Asia)
South America (Brazil, Argentina, Rest of South America)
Middle East and Africa (Saudi Arabia, UAE, Rest of Middle East, South Africa, Egypt, Rest of Africa)
