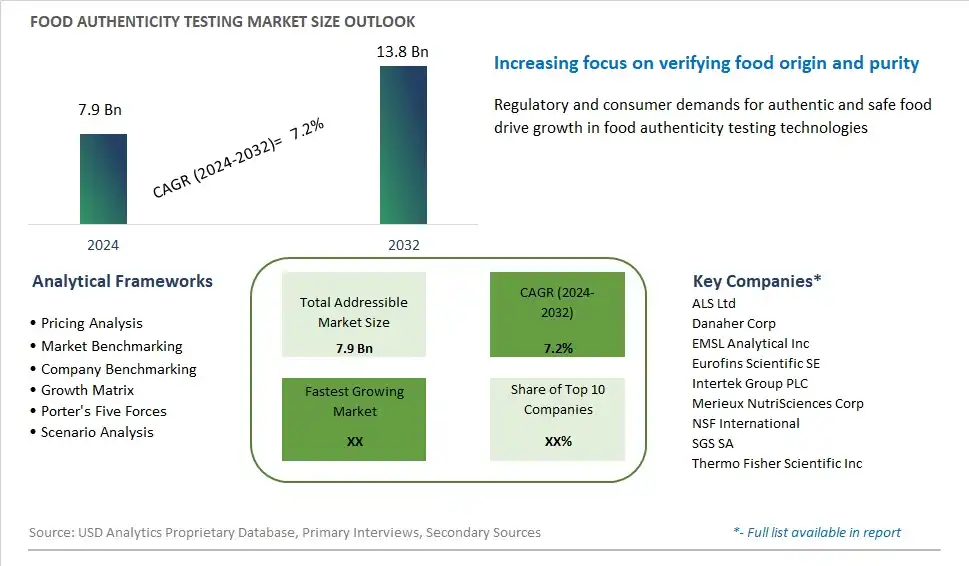
Global Food Authenticity Testing Market Size is valued at $7.9 Billion in 2024 and is forecast to register a growth rate (CAGR) of 7.2% to reach $13.8 Billion by 2032.
The global Food Authenticity Testing Market Comprehensive Study analyzes and forecasts the market size across 6 regions and 24 countries for diverse segments -By Target Testing (Meat Speciation, Country Of Origin and Aging, Adulteration Tests, False Labeling), By Technology (PCR-Based, LC-MS/MS, Isotope Methods, Immunoassay-Based, Others), By Food Tested (Meat & Meat Products, Dairy & Dairy Products, Processed Foods, Cereals, Grains, and Pulses)
An Introduction to Food Authenticity Testing Market
Food authenticity testing involves the analysis of food products to verify their origin, composition, and labeling accuracy in 2024. With increasing globalization, supply chain complexity, and food fraud incidents, ensuring the authenticity and integrity of food products has become a top priority for regulators, manufacturers, and consumers. Food authenticity testing encompasses various analytical techniques, including DNA analysis, stable isotope analysis, chromatography, and spectroscopy, to detect adulteration, substitution, and mislabeling of ingredients and products. Whether screening for undeclared allergens, verifying organic or geographical origin claims, or detecting fraudulent practices such as adulteration with cheaper substitutes, authenticity testing provides valuable insights and assurance to stakeholders across the food supply chain. With advancements in analytical methods, instrumentation, and data analytics, food authenticity testing laboratories are equipped to detect ever-evolving threats and vulnerabilities in the global food system, enabling proactive risk management and mitigation strategies. As consumer awareness of food authenticity issues grows, the demand for authenticity testing services and technologies is expected to increase, driving innovation and collaboration in the food testing and certification industry.
Food Authenticity Testing Competitive Landscape
The market report analyses the leading companies in the industry including ALS Ltd, Danaher Corp, EMSL Analytical Inc, Eurofins Scientific SE, Intertek Group PLC, Merieux NutriSciences Corp, NSF International, SGS SA, Thermo Fisher Scientific Inc, and Others.
Food Authenticity Testing Market Dynamics
Food Authenticity Testing Market Trend: Growing Demand for Authenticity Assurance
One prominent trend in the food authenticity testing market is the growing demand for authenticity assurance across the food supply chain. With increasing globalization, complex supply chains, and instances of food fraud and adulteration, consumers, regulators, and industry stakeholders are placing greater emphasis on verifying the authenticity and origin of food products. This trend is driving the adoption of advanced analytical techniques, including DNA testing, stable isotope analysis, chromatography, and spectroscopy, to accurately detect and authenticate food ingredients, additives, and products. Manufacturers and retailers are investing in robust authenticity testing protocols to ensure transparency, integrity, and compliance with regulatory standards, thus bolstering consumer trust and brand reputation.
Market Driver: Regulatory Compliance and Consumer Safety Concerns
A significant driver propelling the food authenticity testing market is the stringent regulatory requirements and heightened consumer safety concerns regarding food fraud and adulteration. Regulatory bodies worldwide are implementing stringent food safety regulations and quality standards to safeguard consumer health and prevent fraudulent practices in the food industry. Additionally, high-profile incidents of food adulteration and contamination have heightened consumer awareness and sensitivity to food authenticity issues, prompting increased demand for reliable testing methods and authentication technologies. Food manufacturers, retailers, and regulatory agencies are therefore investing in advanced testing solutions to ensure compliance with regulatory mandates, mitigate risks, and uphold consumer confidence in the authenticity and integrity of food products.
Market Opportunity: Adoption of Rapid Testing Technologies
An opportunity within the food authenticity testing market lies in the adoption of rapid testing technologies for on-site and real-time detection of food fraud and adulteration. Traditional authenticity testing methods often involve time-consuming laboratory analysis, which can lead to delays in product release and supply chain disruptions. There is a growing demand for rapid, portable, and user-friendly testing devices and kits that enable quick and efficient screening of food products at various points along the supply chain, including farms, processing facilities, distribution centers, and retail outlets. By leveraging technologies such as handheld spectrometers, DNA-based assays, and immunoassays, companies can enhance the speed, accuracy, and accessibility of food authenticity testing, enabling faster decision-making, improved traceability, and enhanced risk management. Additionally, the integration of blockchain and IoT (Internet of Things) solutions can further enhance transparency and traceability in the food supply chain, creating opportunities for innovative authentication and verification systems.
Food Authenticity Testing Market Share Analysis: Meat Speciation held the dominant market share in 2024
In the Food Authenticity Testing market segmented by Target Testing, the Meat Speciation segment is the largest category. This dominance is driven by the critical importance of ensuring the accuracy and authenticity of meat products for consumer safety, dietary preferences, and regulatory compliance. Meat speciation testing plays a crucial role in verifying the species origin of meat products, preventing mislabeling, substitution, and fraudulent practices in the meat supply chain. With increasing concerns regarding food safety, allergen labeling, and ethical sourcing, meat speciation testing has become a priority for food manufacturers, retailers, and regulatory authorities worldwide. Further, advancements in analytical techniques, such as DNA-based methods and mass spectrometry, enable rapid and accurate identification of meat species, enhancing consumer confidence and trust in meat products. As stakeholders in the food industry prioritize transparency, traceability, and authenticity, the Meat Speciation segment maintains its leadership position in the Food Authenticity Testing market, driving growth and innovation to safeguard the integrity of meat products across the supply chain.
Food Authenticity Testing Market Share Analysis: PCR-Based Technology market is poised to register the fastest growth rae over the forecast period to 2032
In the Food Authenticity Testing market segmented by Technology, the PCR-Based segment is the fastest-growing category. This accelerated growth is propelled by the increasing demand for highly sensitive, specific, and rapid testing methods to detect and quantify DNA markers for species identification and authentication. Polymerase Chain Reaction (PCR)-based technology offers several advantages, including high-throughput capabilities, multiplexing abilities, and low detection limits, making it well-suited for the detection of genetic material in complex food matrices. Further, PCR-based assays enable the identification of target species with high precision, allowing food manufacturers, retailers, and regulatory agencies to verify the authenticity of food products accurately. Additionally, advancements in PCR technology, such as real-time PCR and digital PCR platforms, enhance the sensitivity, specificity, and speed of DNA-based authentication methods, further driving the adoption of PCR-based testing in the food authenticity testing market. As stakeholders in the food industry prioritize accurate labeling, traceability, and compliance with regulatory standards, the PCR-Based segment continues to witness rapid growth, underscoring its significance in ensuring the integrity and authenticity of food products.
Food Authenticity Testing Market Share Analysis: Meat & Meat Products held the dominant market share in 2024
In the Food Authenticity Testing market segmented by Food Tested, the Meat & Meat Products segment is the largest category. This dominance is driven by the critical importance of ensuring the authenticity and integrity of meat products due to the high risk of adulteration, mislabeling, and food safety concerns associated with meat consumption. With stringent regulations governing meat labeling and traceability, food manufacturers, retailers, and regulatory authorities prioritize comprehensive authenticity testing to verify the species origin, quality, and safety of meat products. Additionally, the increasing incidence of food fraud, substitution, and contamination incidents in the meat supply chain further underscores the need for robust testing methods to safeguard consumer health and trust. Further, advancements in analytical techniques, such as DNA-based methods and stable isotope analysis, enable accurate species identification and authentication, enhancing transparency and accountability in the meat industry. As stakeholders across the food supply chain strive to address growing consumer demand for transparency and traceability, the Meat & Meat Products segment remains at the forefront of the Food Authenticity Testing market, driving growth and innovation to ensure the authenticity and safety of meat products.
Food Authenticity Testing Market Segmentation
By Target Testing
Meat Speciation
Country Of Origin and Aging
Adulteration Tests
False Labeling
By Technology
PCR-Based
LC-MS/MS
Isotope Methods
Immunoassay-Based
Others
By Food Tested
Meat & Meat Products
Dairy & Dairy Products
Processed Foods
Cereals, Grains, and Pulses
Countries Analyzed
North America (US, Canada, Mexico)
Europe (Germany, UK, France, Spain, Italy, Russia, Rest of Europe)
Asia Pacific (China, India, Japan, South Korea, Australia, South East Asia, Rest of Asia)
South America (Brazil, Argentina, Rest of South America)
Middle East and Africa (Saudi Arabia, UAE, Rest of Middle East, South Africa, Egypt, Rest of Africa)
Food Authenticity Testing Companies Profiled in the Study
ALS Ltd
Danaher Corp
EMSL Analytical Inc
Eurofins Scientific SE
Intertek Group PLC
Merieux NutriSciences Corp
NSF International
SGS SA
Thermo Fisher Scientific Inc
*- List Not Exhaustive
Chapter 1. TABLE OF CONTENTS
Chapter 2. Introduction to Food Authenticity Testing Market
2.1. Market Overview
2.2. Key Statistics and Report Highlights
2.3. Scope of the Comprehensive Study
2.3.1. Market Definition
2.3.2 Countries and Regions Covered
2.3.3 Research Objective
2.3.4 Units, Currency, and Conversions
2.3.5 Industry Value Chain
2.4. Key Market Segments
2.5. Key Companies
2.6. Study Period
Chapter 3. Strategic Analysis Review
3.1. Food Authenticity Testing Pricing Analysis and Forecast
3.2. Porter’s Five Forces
3.3. Market Ecosystem
3.4. SWOT Analysis
3.5. Regulatory Scenario
3.3. Effects of Inflation, Russia-Ukraine War, moderating economic growth, and other macroeconomic factors
Chapter 4. Competitive Landscape
4.1. Market Share Analysis
4.1.1. Global Food Authenticity Testing Market Share by Company, 2023
4.1.2. Product Offerings of Leading Food Authenticity Testing Companies
4.2. Market Entropy
4.2.1. New Product Launches in the Industry
4.2.2. Mergers, Acquisitions, Joint ventures, and Partnerships
4.3. Key Strategies and Best Practices
Chapter 5. Global Market Projections: Best, Reference, and Low Case Scenarios
5.1. Growth Analysis- Case Scenario Definitions
5.2. Low Growth Case Scenario Forecasts
5.3. Reference Growth Case Scenario Forecasts
5.4. High Growth Case Scenario Forecasts
Chapter 6. Market Dynamics
6.1. Food Authenticity Testing Market Drivers
6.2. Food Authenticity Testing Market Challenges
6.6. Food Authenticity Testing Market Opportunities
6.4. Food Authenticity Testing Market Trends
Chapter 7. Global Food Authenticity Testing Market Outlook Trends
7.1. Global Food Authenticity Testing Revenue (USD Million) and CAGR (%) by Type (2021-2032)
7.2. Global Food Authenticity Testing Revenue (USD Million) and CAGR (%) by Application (2021-2032)
7.3. Global Food Authenticity Testing Revenue (USD Million) and CAGR (%) by Product (2021-2032)
By Target Testing
Meat Speciation
Country Of Origin and Aging
Adulteration Tests
False Labeling
By Technology
PCR-Based
LC-MS/MS
Isotope Methods
Immunoassay-Based
Others
By Food Tested
Meat & Meat Products
Dairy & Dairy Products
Processed Foods
Cereals, Grains, and Pulses
Chapter 8. Global Food Authenticity Testing Regional Analysis and Outlook
8.1. Global Food Authenticity Testing Revenue (USD Million) By Regions (2021- 2032)
8.2. North America Food Authenticity Testing Revenue (USD Million) by Country (2021-2032)
8.2.1. United States Food Authenticity Testing Regional Analysis and Outlook
8.2.2. Canada Food Authenticity Testing Regional Analysis and Outlook
8.2.3. Mexico Food Authenticity Testing Regional Analysis and Outlook
8.3. Europe Food Authenticity Testing Revenue (USD Million), by Country (2021-2032)
8.3.1. Germany Food Authenticity Testing Regional Analysis and Outlook
8.3.2. France Food Authenticity Testing Regional Analysis and Outlook
8.3.3. United Kingdom Food Authenticity Testing Regional Analysis and Outlook
8.3.4. Spain Food Authenticity Testing Regional Analysis and Outlook
8.3.5. Italy Food Authenticity Testing Regional Analysis and Outlook
8.3.6. Russia Food Authenticity Testing Regional Analysis and Outlook
8.3.7. Rest of Europe Food Authenticity Testing Regional Analysis and Outlook
8.4. Asia Pacific Food Authenticity Testing Revenue (USD Million) by Country (2021-2032)
8.4.1. China Food Authenticity Testing Regional Analysis and Outlook
8.4.2. Japan Food Authenticity Testing Regional Analysis and Outlook
8.4.3. India Food Authenticity Testing Regional Analysis and Outlook
8.4.4. South Korea Food Authenticity Testing Regional Analysis and Outlook
8.4.5. Australia Food Authenticity Testing Regional Analysis and Outlook
8.4.6. South East Asia Food Authenticity Testing Regional Analysis and Outlook
8.4.7. Rest of Asia Pacific Food Authenticity Testing Regional Analysis and Outlook
8.5. South America Food Authenticity Testing Revenue (USD Million), by Country (2021-2032)
8.5.1. Brazil Food Authenticity Testing Regional Analysis and Outlook
8.5.2. Argentina Food Authenticity Testing Regional Analysis and Outlook
8.5.3. Rest of South America Food Authenticity Testing Regional Analysis and Outlook
8.6. Middle East and Africa Food Authenticity Testing Revenue (USD Million) by Country (2021-2032)
8.6.1. Middle East Food Authenticity Testing Regional Analysis and Outlook
8.6.2. Africa Food Authenticity Testing Regional Analysis and Outlook
Chapter 9. North America Food Authenticity Testing Analysis and Outlook
9.1. North America Food Authenticity Testing Revenue (USD Million) by Segments (2021-2032)
9.1.1. North America Food Authenticity Testing Revenue (USD Million) by Type (2021-2032)
9.1.2. North America Food Authenticity Testing Revenue (USD Million) by Application (2021-2032)
9.1.3. North America Food Authenticity Testing Revenue (USD Million) by Product (2021-2032)
By Target Testing
Meat Speciation
Country Of Origin and Aging
Adulteration Tests
False Labeling
By Technology
PCR-Based
LC-MS/MS
Isotope Methods
Immunoassay-Based
Others
By Food Tested
Meat & Meat Products
Dairy & Dairy Products
Processed Foods
Cereals, Grains, and Pulses
Chapter 10. Europe Food Authenticity Testing Analysis and Outlook
10.1. Europe Food Authenticity Testing Revenue (USD Million), by Segments (USD Million) (2021-2032)
10.1.1. Europe Food Authenticity Testing Revenue (USD Million) by Type (2021-2032)
10.1.2. Europe Food Authenticity Testing Revenue (USD Million) by Application (2021-2032)
10.1.3. Europe Food Authenticity Testing Revenue (USD Million) by Product (2021-2032)
By Target Testing
Meat Speciation
Country Of Origin and Aging
Adulteration Tests
False Labeling
By Technology
PCR-Based
LC-MS/MS
Isotope Methods
Immunoassay-Based
Others
By Food Tested
Meat & Meat Products
Dairy & Dairy Products
Processed Foods
Cereals, Grains, and Pulses
Chapter 11. Asia Pacific Food Authenticity Testing Analysis and Outlook
11.1. Asia Pacific Food Authenticity Testing Revenue (USD Million), and Revenue (USD Million) by Segments (2021-2032)
11.1.1. Asia Pacific Food Authenticity Testing Revenue (USD Million) by Type (2021-2032)
11.1.2. Asia Pacific Food Authenticity Testing Revenue (USD Million) by Application (2021-2032)
11.1.3. Asia Pacific Food Authenticity Testing Revenue (USD Million) by Product (2021-2032)
By Target Testing
Meat Speciation
Country Of Origin and Aging
Adulteration Tests
False Labeling
By Technology
PCR-Based
LC-MS/MS
Isotope Methods
Immunoassay-Based
Others
By Food Tested
Meat & Meat Products
Dairy & Dairy Products
Processed Foods
Cereals, Grains, and Pulses
Chapter 12. South America Food Authenticity Testing Analysis and Outlook
12.1. South America Food Authenticity Testing Revenue (USD Million), by Segments (2021-2032)
12.1.1. South America Food Authenticity Testing Revenue (USD Million) by Type (2021-2032)
12.1.2. South America Food Authenticity Testing Revenue (USD Million) by Application (2021-2032)
12.1.3. South America Food Authenticity Testing Revenue (USD Million) by Product (2021-2032)
By Target Testing
Meat Speciation
Country Of Origin and Aging
Adulteration Tests
False Labeling
By Technology
PCR-Based
LC-MS/MS
Isotope Methods
Immunoassay-Based
Others
By Food Tested
Meat & Meat Products
Dairy & Dairy Products
Processed Foods
Cereals, Grains, and Pulses
Chapter 13. Middle East and Africa Food Authenticity Testing Analysis and Outlook
13.1. Middle East and Africa Food Authenticity Testing Revenue (USD Million), by Segments (2021-2032)
13.1.1. Middle East and Africa Food Authenticity Testing Revenue (USD Million) by Type (2021-2032)
13.1.2. Middle East and Africa Food Authenticity Testing Revenue (USD Million) by Application (2021-2032)
13.1.3. Middle East and Africa Food Authenticity Testing Revenue (USD Million) by Product (2021-2032)
By Target Testing
Meat Speciation
Country Of Origin and Aging
Adulteration Tests
False Labeling
By Technology
PCR-Based
LC-MS/MS
Isotope Methods
Immunoassay-Based
Others
By Food Tested
Meat & Meat Products
Dairy & Dairy Products
Processed Foods
Cereals, Grains, and Pulses
Chapter 14. Food Authenticity Testing Company Profiles
14.1 Business Overview
14.2 Product Profiles
14.3 SWOT Profiles
14.5 Recent Developments
14.6 Financial Profile
List of Companies
ALS Ltd
Danaher Corp
EMSL Analytical Inc
Eurofins Scientific SE
Intertek Group PLC
Merieux NutriSciences Corp
NSF International
SGS SA
Thermo Fisher Scientific Inc
15. Methodology and Data Sources
15.1 Customization Offerings
15.2 Subscription Services
15.3 Related Reports
15.4 Publisher Expertise
LIST OF TABLES
Table 1 Market Segmentation Analysis
Table 2 Global Food Authenticity Testing Market Share of Leading Companies, 2023
Table 3 Product Offerings of Leading Companies
Table 4 Low Growth Scenario Forecasts
Table 5 Reference Case Growth Scenario
Table 6 High Growth Case Scenario
Table 7 Global Food Authenticity Testing Revenue (USD Million) And CAGR (%) By Type (2021-2032)
Table 8 Global Food Authenticity Testing Revenue (USD Million) And CAGR (%) By Application (2021-2032)
Table 9 Global Food Authenticity Testing Revenue (USD Million) And CAGR (%) By Product (2021-2032)
Table 10 Global Food Authenticity Testing Market Revenue (USD Million) By Regions (2021-2032)
Table 11 Global Food Authenticity Testing Market Share (%) By Regions (2021-2032)
Table 12 North America Food Authenticity Testing Revenue (USD Million) By Country (2021-2032)
Table 13 Europe Food Authenticity Testing Revenue (USD Million) By Country (2021-2032)
Table 14 Asia Pacific Food Authenticity Testing Revenue (USD Million) By Country (2021-2032)
Table 15 South America Food Authenticity Testing Revenue (USD Million) By Country (2021-2032)
Table 16 Middle East and Africa Food Authenticity Testing Revenue (USD Million) By Region (2021-2032)
Table 17 North America Food Authenticity Testing Revenue (USD Million) By Type (2021-2032)
Table 18 North America Food Authenticity Testing Revenue (USD Million) By Application (2021-2032)
Table 19 North America Food Authenticity Testing Revenue (USD Million) By Product (2021-2032)
Table 20 Europe Food Authenticity Testing Revenue (USD Million) By Type (2021-2032)
Table 21 Europe Food Authenticity Testing Revenue (USD Million) By Application (2021-2032)
Table 22 Europe Food Authenticity Testing Revenue (USD Million) By Product (2021-2032)
Table 23 Asia Pacific Food Authenticity Testing Revenue (USD Million) By Type (2021-2032)
Table 24 Asia Pacific Food Authenticity Testing Revenue (USD Million) By Application (2021-2032)
Table 25 Asia Pacific Food Authenticity Testing Revenue (USD Million) By Product (2021-2032)
Table 26 South America Food Authenticity Testing Revenue (USD Million) By Type (2021-2032)
Table 27 South America Food Authenticity Testing Revenue (USD Million) By Application (2021-2032)
Table 28 South America Food Authenticity Testing Revenue (USD Million) By Product (2021-2032)
Table 29 Middle East and Africa Food Authenticity Testing Revenue (USD Million) By Type (2021-2032)
Table 30 Middle East and Africa Food Authenticity Testing Revenue (USD Million) By Application (2021-2032)
Table 31 Middle East and Africa Food Authenticity Testing Revenue (USD Million) By Product (2021-2032)
LIST OF FIGURES
Figure 1. Market Scope
Figure 2. Pricing Forecasts Per Unit, 2023- 2032
Figure 3. Porter’s Five Forces
Figure 4. Global Food Authenticity Testing Market Revenue (USD Million) By Regions (2021-2032)
Figure 5. Global Food Authenticity Testing Market Share (%) By Regions (2023)
Figure 6. North America Food Authenticity Testing Revenue (USD Million) By Country (2021-2032)
Figure 7. United States Food Authenticity Testing Revenue (USD Million) By Country (2021-2032)
Figure 8. Canada Food Authenticity Testing Revenue (USD Million) By Country (2021-2032)
Figure 9. Mexico Food Authenticity Testing Revenue (USD Million) By Country (2021-2032)
Figure 10. Europe Food Authenticity Testing Revenue (USD Million) By Country (2021-2032)
Figure 11. Germany Food Authenticity Testing Revenue (USD Million) By Country (2021-2032)
Figure 12. France Food Authenticity Testing Revenue (USD Million) By Country (2021-2032)
Figure 13. United Kingdom Food Authenticity Testing Revenue (USD Million) By Country (2021-2032)
Figure 14. Spain Food Authenticity Testing Revenue (USD Million) By Country (2021-2032)
Figure 15. Italy Food Authenticity Testing Revenue (USD Million) By Country (2021-2032)
Figure 16. Russia Food Authenticity Testing Revenue (USD Million) By Country (2021-2032)
Figure 17. Rest of Europe Food Authenticity Testing Revenue (USD Million) By Country (2021-2032)
Figure 11. Asia Pacific Food Authenticity Testing Revenue (USD Million) By Country (2021-2032)
Figure 12. China Food Authenticity Testing Revenue (USD Million) By Country (2021-2032)
Figure 13. Japan Food Authenticity Testing Revenue (USD Million) By Country (2021-2032)
Figure 14. India Food Authenticity Testing Revenue (USD Million) By Country (2021-2032)
Figure 15. South Korea Food Authenticity Testing Revenue (USD Million) By Country (2021-2032)
Figure 16. Australia Food Authenticity Testing Revenue (USD Million) By Country (2021-2032)
Figure 17. South East Asia Food Authenticity Testing Revenue (USD Million) By Country (2021-2032)
Figure 18. South America Food Authenticity Testing Revenue (USD Million) By Country (2021-2032)
Figure 19. Brazil Food Authenticity Testing Revenue (USD Million) By Country (2021-2032)
Figure 20. Argentina Food Authenticity Testing Revenue (USD Million) By Country (2021-2032)
Figure 21. Rest of Asia Pacific Food Authenticity Testing Revenue (USD Million) By Country (2021-2032)
Figure 22. Middle East and Africa Food Authenticity Testing Revenue (USD Million) By Region (2021-2032)
Figure 23. Saudi Arabia Food Authenticity Testing Revenue (USD Million) By Region (2021-2032)
Figure 24. The UAE Food Authenticity Testing Revenue (USD Million) By Region (2021-2032)
Figure 25. Rest of Middle East Food Authenticity Testing Revenue (USD Million) By Region (2021-2032)
Figure 26. South Africa Food Authenticity Testing Revenue (USD Million) By Region (2021-2032)
Figure 27. Africa Food Authenticity Testing Revenue (USD Million) By Region (2021-2032)
Figure 28. North America Food Authenticity Testing Revenue (USD Million) By Type (2021-2032)
Figure 29. North America Food Authenticity Testing Revenue (USD Million) By Application (2021-2032)
Figure 30. North America Food Authenticity Testing Revenue (USD Million) By Product (2021-2032)
Figure 31. Europe Food Authenticity Testing Revenue (USD Million) By Type (2021-2032)
Figure 32. Europe Food Authenticity Testing Revenue (USD Million) By Application (2021-2032)
Figure 33. Europe Food Authenticity Testing Revenue (USD Million) By Product (2021-2032)
Figure 34. Asia Pacific Food Authenticity Testing Revenue (USD Million) By Type (2021-2032)
Figure 35. Asia Pacific Food Authenticity Testing Revenue (USD Million) By Application (2021-2032)
Figure 36. Asia Pacific Food Authenticity Testing Revenue (USD Million) By Product (2021-2032)
Figure 37. South America Food Authenticity Testing Revenue (USD Million) By Type (2021-2032)
Figure 38. South America Food Authenticity Testing Revenue (USD Million) By Application (2021-2032)
Figure 39. South America Food Authenticity Testing Revenue (USD Million) By Product (2021-2032)
Figure 40. Middle East and Africa Food Authenticity Testing Revenue (USD Million) By Type (2021-2032)
Figure 41. Middle East and Africa Food Authenticity Testing Revenue (USD Million) By Application (2021-2032)
Figure 42. Middle East and Africa Food Authenticity Testing Revenue (USD Million) By Product (2021-2032)
By Target Testing
Meat Speciation
Country Of Origin and Aging
Adulteration Tests
False Labeling
By Technology
PCR-Based
LC-MS/MS
Isotope Methods
Immunoassay-Based
Others
By Food Tested
Meat & Meat Products
Dairy & Dairy Products
Processed Foods
Cereals, Grains, and Pulses
Countries Analyzed
North America (US, Canada, Mexico)
Europe (Germany, UK, France, Spain, Italy, Russia, Rest of Europe)
Asia Pacific (China, India, Japan, South Korea, Australia, South East Asia, Rest of Asia)
South America (Brazil, Argentina, Rest of South America)
Middle East and Africa (Saudi Arabia, UAE, Rest of Middle East, South Africa, Egypt, Rest of Africa)
