The global Food Automation Market Comprehensive Study analyzes and forecasts the market size across 6 regions and 24 countries for diverse segments -By Type (Motors & Generators, Motor Controls, Discrete Controllers & Visualization, Rotary Products, Linear Products, Others), By Application (Dairy, Bakery, Confectionery, Fruit & vegetable, Meat, Poultry, Seafood, Beverages), By Function (Processing, Packaging & Repackaging, Palletizing, Sorting & Grading, Picking & Placing, Others)
Food automation involves the use of robotics, artificial intelligence, and advanced machinery to automate and optimize food production processes in 2024. With increasing labor costs, supply chain disruptions, and consumer demand for efficiency and consistency, food manufacturers are turning to automation solutions to improve productivity, quality, and competitiveness. Food automation technologies encompass a wide range of applications, including robotic pick-and-place systems, automated packaging lines, and intelligent sorting and inspection systems, that streamline operations and reduce reliance on manual labor. Whether handling ingredients, processing raw materials, or packaging finished products, automated systems offer precision, speed, and flexibility, enabling manufacturers to meet production quotas and customer demands with agility and efficiency. With advancements in machine learning, sensor technology, and human-machine collaboration, food automation solutions are becoming more intelligent, adaptive, and integrated, empowering manufacturers to optimize resource utilization, minimize waste, and enhance product quality and safety. As the food industry embraces digital transformation and Industry 4.0 principles, the market for food automation is expected to expand, driven by investments in technology, training, and infrastructure that enable manufacturers to innovate and thrive in a rapidly evolving market landscape.
The market report analyses the leading companies in the industry including ABB Ltd, Emerson Electric Co., Fortive Corp, GEA Group AG, Mitsubishi Electric Corp, Nord Drivesystems., Rexnord Corp, Rockwell Automation Inc, Schneider Electric SE, Siemens AG, Yaskawa Electric Corp, Yokogawa Electric Corp, and Others.
One prominent trend in the food automation market is the increasing adoption of Industry 4.0 technologies to enhance efficiency, productivity, and agility in food production and processing. Industry 4.0, characterized by the integration of automation, data exchange, and smart technology, is revolutionizing the food industry by enabling the implementation of advanced automation systems, robotics, artificial intelligence (AI), Internet of Things (IoT) devices, and cloud computing solutions. These technologies facilitate seamless communication, real-time data analytics, predictive maintenance, and autonomous decision-making, thereby optimizing production processes, reducing operational costs, and improving overall quality and safety standards in food manufacturing and processing facilities.
A significant driver propelling the food automation market is the increasing need for operational efficiency, cost reduction, and process optimization in the food industry. Food manufacturers face growing pressure to meet consumer demands for high-quality, safe, and sustainable food products while simultaneously navigating challenges such as fluctuating raw material costs, labor shortages, stringent regulatory requirements, and competitive market dynamics. Automation solutions offer opportunities to streamline production workflows, minimize human error, optimize resource utilization, and accelerate time-to-market for new products. By automating repetitive tasks, implementing smart equipment and control systems, and leveraging data-driven insights, food companies can enhance productivity, achieve economies of scale, and remain competitive in a rapidly evolving market landscape.
An opportunity within the food automation market lies in the integration of artificial intelligence (AI) and machine learning technologies to drive predictive and prescriptive analytics, process optimization, and adaptive manufacturing capabilities. AI-powered automation solutions enable food manufacturers to harness vast amounts of data generated from sensors, equipment, and production processes to gain actionable insights, identify patterns, and anticipate operational issues before they occur. By deploying AI-driven predictive maintenance algorithms, adaptive control systems, and intelligent process optimization tools, companies can minimize downtime, reduce maintenance costs, optimize energy consumption, and enhance product quality and consistency. Furthermore, the application of AI-enabled robotics and autonomous vehicles in food handling, packaging, and logistics operations presents opportunities to improve supply chain efficiency, traceability, and product integrity from farm to fork. As AI and machine learning technologies continue to advance, food automation solutions will play a crucial role in driving innovation, sustainability, and competitiveness across the food industry.
In the Food Automation market segmented by Type, the Motors & Generators segment is the largest category. This dominance is attributed to the critical role motors and generators play in powering various automated systems and equipment across the food processing and manufacturing industry. Motors and generators are essential components in conveyor systems, packaging machinery, mixing equipment, and other automated processes, providing the necessary mechanical power to drive production lines efficiently. Additionally, advancements in motor technology, such as energy-efficient designs and variable speed drives, enable food manufacturers to optimize energy consumption and enhance operational efficiency. Further, the increasing adoption of automation and robotics in food processing facilities drives the demand for high-performance motors and generators capable of withstanding harsh operating environments and stringent hygiene requirements. As food manufacturers seek to improve productivity, reduce labor costs, and ensure product quality and safety, the Motors & Generators segment maintains its leadership position in the Food Automation market, driving growth and innovation across the industry.
In the Food Automation market segmented by Application, the Bakery segment is the fastest-growing category. This accelerated growth is propelled by several factors, including the increasing demand for bakery products, changing consumer preferences for convenience foods, and the need for enhanced efficiency and consistency in bakery operations. Automation solutions in the bakery industry streamline production processes, such as mixing, kneading, shaping, baking, and packaging, leading to higher throughput, improved product quality, and reduced labor costs. Additionally, automation enables precise control over variables such as temperature, humidity, and mixing ratios, ensuring consistent product outcomes and meeting stringent quality standards. Further, the trend towards artisanal and specialty bakery products drives the adoption of automation technologies capable of accommodating diverse recipes and customization requirements while maintaining production efficiency. As bakery manufacturers seek to meet rising consumer demand while ensuring operational excellence and product innovation, the Bakery Application segment continues to witness rapid growth, underscoring its significance in driving innovation and efficiency within the Food Automation market.
In the Food Automation market segmented by Function, the Processing segment is the largest category. This dominance is attributed to the critical role processing automation plays in transforming raw ingredients into finished food products across various sectors of the food industry. Processing automation encompasses a wide range of equipment and systems, including mixers, blenders, ovens, cookers, and chillers, facilitating efficient and standardized production processes. Additionally, automation solutions in processing enable precise control over variables such as temperature, pressure, and mixing ratios, ensuring consistency, quality, and safety in food production. Further, advancements in processing automation technologies, such as robotics, sensors, and artificial intelligence, enhance production efficiency, throughput, and flexibility, driving their widespread adoption across food processing facilities. As food manufacturers prioritize operational excellence, scalability, and product innovation, the Processing Function segment maintains its leadership position in the Food Automation market, driving growth and innovation to meet evolving industry demands.
By Type
Motors & Generators
Motor Controls
Discrete Controllers & Visualization
Rotary Products
Linear Products
Others
By Application
Dairy
Bakery
Confectionery
Fruit & vegetable
Meat
Poultry
Seafood
Beverages
By Function
Processing
Packaging & Repackaging
Palletizing
Sorting & Grading
Picking & Placing
Others
Countries Analyzed
North America (US, Canada, Mexico)
Europe (Germany, UK, France, Spain, Italy, Russia, Rest of Europe)
Asia Pacific (China, India, Japan, South Korea, Australia, South East Asia, Rest of Asia)
South America (Brazil, Argentina, Rest of South America)
Middle East and Africa (Saudi Arabia, UAE, Rest of Middle East, South Africa, Egypt, Rest of Africa)
ABB Ltd
Emerson Electric Co.
Fortive Corp
GEA Group AG
Mitsubishi Electric Corp
Nord Drivesystems.
Rexnord Corp
Rockwell Automation Inc
Schneider Electric SE
Siemens AG
Yaskawa Electric Corp
Yokogawa Electric Corp
*- List Not Exhaustive
Chapter 1. TABLE OF CONTENTS
Chapter 2. Introduction to Food Automation Market
2.1. Market Overview
2.2. Key Statistics and Report Highlights
2.3. Scope of the Comprehensive Study
2.3.1. Market Definition
2.3.2 Countries and Regions Covered
2.3.3 Research Objective
2.3.4 Units, Currency, and Conversions
2.3.5 Industry Value Chain
2.4. Key Market Segments
2.5. Key Companies
2.6. Study Period
Chapter 3. Strategic Analysis Review
3.1. Food Automation Pricing Analysis and Forecast
3.2. Porter’s Five Forces
3.3. Market Ecosystem
3.4. SWOT Analysis
3.5. Regulatory Scenario
3.3. Effects of Inflation, Russia-Ukraine War, moderating economic growth, and other macroeconomic factors
Chapter 4. Competitive Landscape
4.1. Market Share Analysis
4.1.1. Global Food Automation Market Share by Company, 2023
4.1.2. Product Offerings of Leading Food Automation Companies
4.2. Market Entropy
4.2.1. New Product Launches in the Industry
4.2.2. Mergers, Acquisitions, Joint ventures, and Partnerships
4.3. Key Strategies and Best Practices
Chapter 5. Global Market Projections: Best, Reference, and Low Case Scenarios
5.1. Growth Analysis- Case Scenario Definitions
5.2. Low Growth Case Scenario Forecasts
5.3. Reference Growth Case Scenario Forecasts
5.4. High Growth Case Scenario Forecasts
Chapter 6. Market Dynamics
6.1. Food Automation Market Drivers
6.2. Food Automation Market Challenges
6.6. Food Automation Market Opportunities
6.4. Food Automation Market Trends
Chapter 7. Global Food Automation Market Outlook Trends
7.1. Global Food Automation Revenue (USD Million) and CAGR (%) by Type (2021-2032)
7.2. Global Food Automation Revenue (USD Million) and CAGR (%) by Application (2021-2032)
7.3. Global Food Automation Revenue (USD Million) and CAGR (%) by Product (2021-2032)
By Type
Motors & Generators
Motor Controls
Discrete Controllers & Visualization
Rotary Products
Linear Products
Others
By Application
Dairy
Bakery
Confectionery
Fruit & vegetable
Meat
Poultry
Seafood
Beverages
By Function
Processing
Packaging & Repackaging
Palletizing
Sorting & Grading
Picking & Placing
Others
Chapter 8. Global Food Automation Regional Analysis and Outlook
8.1. Global Food Automation Revenue (USD Million) By Regions (2021- 2032)
8.2. North America Food Automation Revenue (USD Million) by Country (2021-2032)
8.2.1. United States Food Automation Regional Analysis and Outlook
8.2.2. Canada Food Automation Regional Analysis and Outlook
8.2.3. Mexico Food Automation Regional Analysis and Outlook
8.3. Europe Food Automation Revenue (USD Million), by Country (2021-2032)
8.3.1. Germany Food Automation Regional Analysis and Outlook
8.3.2. France Food Automation Regional Analysis and Outlook
8.3.3. United Kingdom Food Automation Regional Analysis and Outlook
8.3.4. Spain Food Automation Regional Analysis and Outlook
8.3.5. Italy Food Automation Regional Analysis and Outlook
8.3.6. Russia Food Automation Regional Analysis and Outlook
8.3.7. Rest of Europe Food Automation Regional Analysis and Outlook
8.4. Asia Pacific Food Automation Revenue (USD Million) by Country (2021-2032)
8.4.1. China Food Automation Regional Analysis and Outlook
8.4.2. Japan Food Automation Regional Analysis and Outlook
8.4.3. India Food Automation Regional Analysis and Outlook
8.4.4. South Korea Food Automation Regional Analysis and Outlook
8.4.5. Australia Food Automation Regional Analysis and Outlook
8.4.6. South East Asia Food Automation Regional Analysis and Outlook
8.4.7. Rest of Asia Pacific Food Automation Regional Analysis and Outlook
8.5. South America Food Automation Revenue (USD Million), by Country (2021-2032)
8.5.1. Brazil Food Automation Regional Analysis and Outlook
8.5.2. Argentina Food Automation Regional Analysis and Outlook
8.5.3. Rest of South America Food Automation Regional Analysis and Outlook
8.6. Middle East and Africa Food Automation Revenue (USD Million) by Country (2021-2032)
8.6.1. Middle East Food Automation Regional Analysis and Outlook
8.6.2. Africa Food Automation Regional Analysis and Outlook
Chapter 9. North America Food Automation Analysis and Outlook
9.1. North America Food Automation Revenue (USD Million) by Segments (2021-2032)
9.1.1. North America Food Automation Revenue (USD Million) by Type (2021-2032)
9.1.2. North America Food Automation Revenue (USD Million) by Application (2021-2032)
9.1.3. North America Food Automation Revenue (USD Million) by Product (2021-2032)
By Type
Motors & Generators
Motor Controls
Discrete Controllers & Visualization
Rotary Products
Linear Products
Others
By Application
Dairy
Bakery
Confectionery
Fruit & vegetable
Meat
Poultry
Seafood
Beverages
By Function
Processing
Packaging & Repackaging
Palletizing
Sorting & Grading
Picking & Placing
Others
Chapter 10. Europe Food Automation Analysis and Outlook
10.1. Europe Food Automation Revenue (USD Million), by Segments (USD Million) (2021-2032)
10.1.1. Europe Food Automation Revenue (USD Million) by Type (2021-2032)
10.1.2. Europe Food Automation Revenue (USD Million) by Application (2021-2032)
10.1.3. Europe Food Automation Revenue (USD Million) by Product (2021-2032)
By Type
Motors & Generators
Motor Controls
Discrete Controllers & Visualization
Rotary Products
Linear Products
Others
By Application
Dairy
Bakery
Confectionery
Fruit & vegetable
Meat
Poultry
Seafood
Beverages
By Function
Processing
Packaging & Repackaging
Palletizing
Sorting & Grading
Picking & Placing
Others
Chapter 11. Asia Pacific Food Automation Analysis and Outlook
11.1. Asia Pacific Food Automation Revenue (USD Million), and Revenue (USD Million) by Segments (2021-2032)
11.1.1. Asia Pacific Food Automation Revenue (USD Million) by Type (2021-2032)
11.1.2. Asia Pacific Food Automation Revenue (USD Million) by Application (2021-2032)
11.1.3. Asia Pacific Food Automation Revenue (USD Million) by Product (2021-2032)
By Type
Motors & Generators
Motor Controls
Discrete Controllers & Visualization
Rotary Products
Linear Products
Others
By Application
Dairy
Bakery
Confectionery
Fruit & vegetable
Meat
Poultry
Seafood
Beverages
By Function
Processing
Packaging & Repackaging
Palletizing
Sorting & Grading
Picking & Placing
Others
Chapter 12. South America Food Automation Analysis and Outlook
12.1. South America Food Automation Revenue (USD Million), by Segments (2021-2032)
12.1.1. South America Food Automation Revenue (USD Million) by Type (2021-2032)
12.1.2. South America Food Automation Revenue (USD Million) by Application (2021-2032)
12.1.3. South America Food Automation Revenue (USD Million) by Product (2021-2032)
By Type
Motors & Generators
Motor Controls
Discrete Controllers & Visualization
Rotary Products
Linear Products
Others
By Application
Dairy
Bakery
Confectionery
Fruit & vegetable
Meat
Poultry
Seafood
Beverages
By Function
Processing
Packaging & Repackaging
Palletizing
Sorting & Grading
Picking & Placing
Others
Chapter 13. Middle East and Africa Food Automation Analysis and Outlook
13.1. Middle East and Africa Food Automation Revenue (USD Million), by Segments (2021-2032)
13.1.1. Middle East and Africa Food Automation Revenue (USD Million) by Type (2021-2032)
13.1.2. Middle East and Africa Food Automation Revenue (USD Million) by Application (2021-2032)
13.1.3. Middle East and Africa Food Automation Revenue (USD Million) by Product (2021-2032)
By Type
Motors & Generators
Motor Controls
Discrete Controllers & Visualization
Rotary Products
Linear Products
Others
By Application
Dairy
Bakery
Confectionery
Fruit & vegetable
Meat
Poultry
Seafood
Beverages
By Function
Processing
Packaging & Repackaging
Palletizing
Sorting & Grading
Picking & Placing
Others
Chapter 14. Food Automation Company Profiles
14.1 Business Overview
14.2 Product Profiles
14.3 SWOT Profiles
14.5 Recent Developments
14.6 Financial Profile
List of Companies
ABB Ltd
Emerson Electric Co.
Fortive Corp
GEA Group AG
Mitsubishi Electric Corp
Nord Drivesystems.
Rexnord Corp
Rockwell Automation Inc
Schneider Electric SE
Siemens AG
Yaskawa Electric Corp
Yokogawa Electric Corp
15. Methodology and Data Sources
15.1 Customization Offerings
15.2 Subscription Services
15.3 Related Reports
15.4 Publisher Expertise
LIST OF TABLES
Table 1 Market Segmentation Analysis
Table 2 Global Food Automation Market Share of Leading Companies, 2023
Table 3 Product Offerings of Leading Companies
Table 4 Low Growth Scenario Forecasts
Table 5 Reference Case Growth Scenario
Table 6 High Growth Case Scenario
Table 7 Global Food Automation Revenue (USD Million) And CAGR (%) By Type (2021-2032)
Table 8 Global Food Automation Revenue (USD Million) And CAGR (%) By Application (2021-2032)
Table 9 Global Food Automation Revenue (USD Million) And CAGR (%) By Product (2021-2032)
Table 10 Global Food Automation Market Revenue (USD Million) By Regions (2021-2032)
Table 11 Global Food Automation Market Share (%) By Regions (2021-2032)
Table 12 North America Food Automation Revenue (USD Million) By Country (2021-2032)
Table 13 Europe Food Automation Revenue (USD Million) By Country (2021-2032)
Table 14 Asia Pacific Food Automation Revenue (USD Million) By Country (2021-2032)
Table 15 South America Food Automation Revenue (USD Million) By Country (2021-2032)
Table 16 Middle East and Africa Food Automation Revenue (USD Million) By Region (2021-2032)
Table 17 North America Food Automation Revenue (USD Million) By Type (2021-2032)
Table 18 North America Food Automation Revenue (USD Million) By Application (2021-2032)
Table 19 North America Food Automation Revenue (USD Million) By Product (2021-2032)
Table 20 Europe Food Automation Revenue (USD Million) By Type (2021-2032)
Table 21 Europe Food Automation Revenue (USD Million) By Application (2021-2032)
Table 22 Europe Food Automation Revenue (USD Million) By Product (2021-2032)
Table 23 Asia Pacific Food Automation Revenue (USD Million) By Type (2021-2032)
Table 24 Asia Pacific Food Automation Revenue (USD Million) By Application (2021-2032)
Table 25 Asia Pacific Food Automation Revenue (USD Million) By Product (2021-2032)
Table 26 South America Food Automation Revenue (USD Million) By Type (2021-2032)
Table 27 South America Food Automation Revenue (USD Million) By Application (2021-2032)
Table 28 South America Food Automation Revenue (USD Million) By Product (2021-2032)
Table 29 Middle East and Africa Food Automation Revenue (USD Million) By Type (2021-2032)
Table 30 Middle East and Africa Food Automation Revenue (USD Million) By Application (2021-2032)
Table 31 Middle East and Africa Food Automation Revenue (USD Million) By Product (2021-2032)
LIST OF FIGURES
Figure 1. Market Scope
Figure 2. Pricing Forecasts Per Unit, 2023- 2032
Figure 3. Porter’s Five Forces
Figure 4. Global Food Automation Market Revenue (USD Million) By Regions (2021-2032)
Figure 5. Global Food Automation Market Share (%) By Regions (2023)
Figure 6. North America Food Automation Revenue (USD Million) By Country (2021-2032)
Figure 7. United States Food Automation Revenue (USD Million) By Country (2021-2032)
Figure 8. Canada Food Automation Revenue (USD Million) By Country (2021-2032)
Figure 9. Mexico Food Automation Revenue (USD Million) By Country (2021-2032)
Figure 10. Europe Food Automation Revenue (USD Million) By Country (2021-2032)
Figure 11. Germany Food Automation Revenue (USD Million) By Country (2021-2032)
Figure 12. France Food Automation Revenue (USD Million) By Country (2021-2032)
Figure 13. United Kingdom Food Automation Revenue (USD Million) By Country (2021-2032)
Figure 14. Spain Food Automation Revenue (USD Million) By Country (2021-2032)
Figure 15. Italy Food Automation Revenue (USD Million) By Country (2021-2032)
Figure 16. Russia Food Automation Revenue (USD Million) By Country (2021-2032)
Figure 17. Rest of Europe Food Automation Revenue (USD Million) By Country (2021-2032)
Figure 11. Asia Pacific Food Automation Revenue (USD Million) By Country (2021-2032)
Figure 12. China Food Automation Revenue (USD Million) By Country (2021-2032)
Figure 13. Japan Food Automation Revenue (USD Million) By Country (2021-2032)
Figure 14. India Food Automation Revenue (USD Million) By Country (2021-2032)
Figure 15. South Korea Food Automation Revenue (USD Million) By Country (2021-2032)
Figure 16. Australia Food Automation Revenue (USD Million) By Country (2021-2032)
Figure 17. South East Asia Food Automation Revenue (USD Million) By Country (2021-2032)
Figure 18. South America Food Automation Revenue (USD Million) By Country (2021-2032)
Figure 19. Brazil Food Automation Revenue (USD Million) By Country (2021-2032)
Figure 20. Argentina Food Automation Revenue (USD Million) By Country (2021-2032)
Figure 21. Rest of Asia Pacific Food Automation Revenue (USD Million) By Country (2021-2032)
Figure 22. Middle East and Africa Food Automation Revenue (USD Million) By Region (2021-2032)
Figure 23. Saudi Arabia Food Automation Revenue (USD Million) By Region (2021-2032)
Figure 24. The UAE Food Automation Revenue (USD Million) By Region (2021-2032)
Figure 25. Rest of Middle East Food Automation Revenue (USD Million) By Region (2021-2032)
Figure 26. South Africa Food Automation Revenue (USD Million) By Region (2021-2032)
Figure 27. Africa Food Automation Revenue (USD Million) By Region (2021-2032)
Figure 28. North America Food Automation Revenue (USD Million) By Type (2021-2032)
Figure 29. North America Food Automation Revenue (USD Million) By Application (2021-2032)
Figure 30. North America Food Automation Revenue (USD Million) By Product (2021-2032)
Figure 31. Europe Food Automation Revenue (USD Million) By Type (2021-2032)
Figure 32. Europe Food Automation Revenue (USD Million) By Application (2021-2032)
Figure 33. Europe Food Automation Revenue (USD Million) By Product (2021-2032)
Figure 34. Asia Pacific Food Automation Revenue (USD Million) By Type (2021-2032)
Figure 35. Asia Pacific Food Automation Revenue (USD Million) By Application (2021-2032)
Figure 36. Asia Pacific Food Automation Revenue (USD Million) By Product (2021-2032)
Figure 37. South America Food Automation Revenue (USD Million) By Type (2021-2032)
Figure 38. South America Food Automation Revenue (USD Million) By Application (2021-2032)
Figure 39. South America Food Automation Revenue (USD Million) By Product (2021-2032)
Figure 40. Middle East and Africa Food Automation Revenue (USD Million) By Type (2021-2032)
Figure 41. Middle East and Africa Food Automation Revenue (USD Million) By Application (2021-2032)
Figure 42. Middle East and Africa Food Automation Revenue (USD Million) By Product (2021-2032)
By Type
Motors & Generators
Motor Controls
Discrete Controllers & Visualization
Rotary Products
Linear Products
Others
By Application
Dairy
Bakery
Confectionery
Fruit & vegetable
Meat
Poultry
Seafood
Beverages
By Function
Processing
Packaging & Repackaging
Palletizing
Sorting & Grading
Picking & Placing
Others
Countries Analyzed
North America (US, Canada, Mexico)
Europe (Germany, UK, France, Spain, Italy, Russia, Rest of Europe)
Asia Pacific (China, India, Japan, South Korea, Australia, South East Asia, Rest of Asia)
South America (Brazil, Argentina, Rest of South America)
Middle East and Africa (Saudi Arabia, UAE, Rest of Middle East, South Africa, Egypt, Rest of Africa)
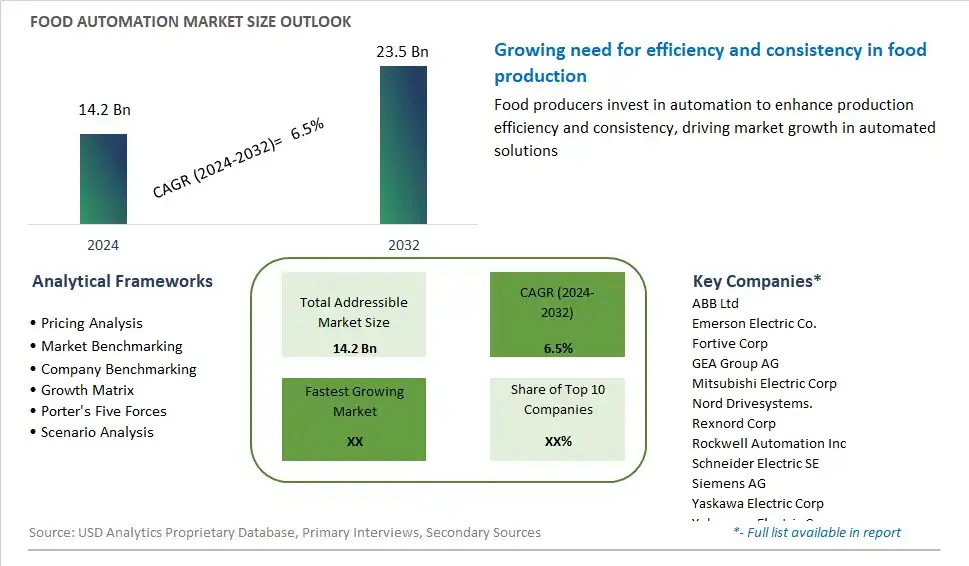
Global Food Automation Market Size is valued at $14.2 Billion in 2024 and is forecast to register a growth rate (CAGR) of 6.5% to reach $23.5 Billion by 2032.
Emerging Markets across Asia Pacific, Europe, and Americas present robust growth prospects.
ABB Ltd, Emerson Electric Co., Fortive Corp, GEA Group AG, Mitsubishi Electric Corp, Nord Drivesystems., Rexnord Corp, Rockwell Automation Inc, Schneider Electric SE, Siemens AG, Yaskawa Electric Corp, Yokogawa Electric Corp
Base Year- 2023; Estimated Year- 2024; Historic Period- 2018-2023; Forecast period- 2024 to 2032; Currency: Revenue (USD); Volume