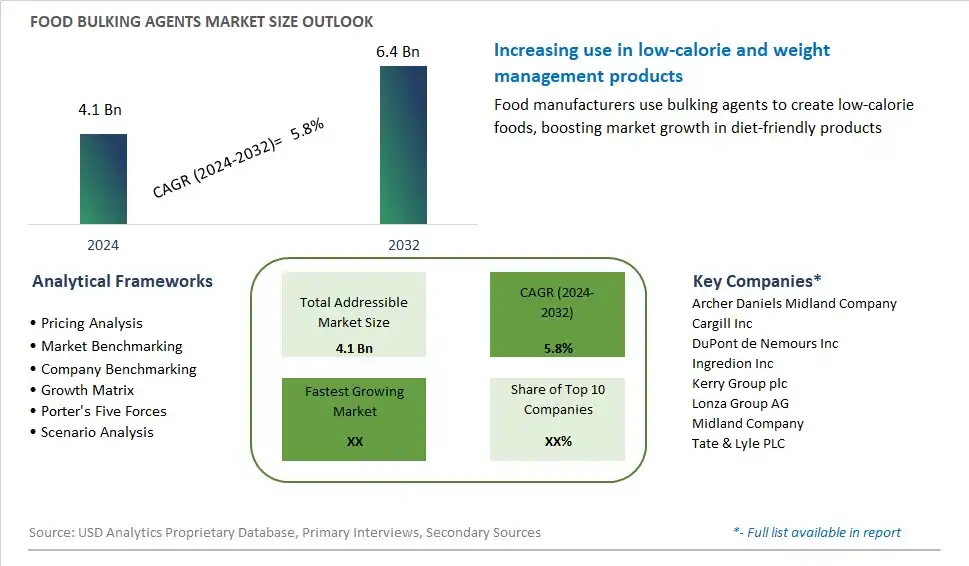
Global Food Bulking Agents Market Size is valued at $4.1 Billion in 2024 and is forecast to register a growth rate (CAGR) of 5.8% to reach $6.4 Billion by 2032.
The global Food Bulking Agents Market Comprehensive Study analyzes and forecasts the market size across 6 regions and 24 countries for diverse segments -By Product (Flavors & Enhancers, Antioxidants, Anticaking Agents, Emulsifiers), By Application (Confectionary, Hotels, Homes, Snacks, Bakery, Others)
An Introduction to Food Bulking Agents Market
In 2024, the food bulking agents market is witnessing substantial growth, propelled by the rising demand for low-calorie and high-fiber food products. Bulking agents are essential for improving the texture, volume, and overall appeal of food items without significantly increasing their caloric content. These agents are particularly vital in the production of low-fat and sugar-free products, catering to the growing consumer base focused on weight management and overall health. The market benefits from ongoing innovations in ingredient sourcing, with a notable shift towards natural and plant-based bulking agents. Moreover, regulatory support for healthier food options has accelerated the adoption of these agents in various food categories, including bakery, confectionery, and dairy products. The increasing trend of health-conscious eating habits continues to drive the demand for effective bulking agents, ensuring the market's steady expansion.
Food Bulking Agents Competitive Landscape
The market report analyses the leading companies in the industry including Archer Daniels Midland Company, Cargill Inc, DuPont de Nemours Inc, Ingredion Inc, Kerry Group plc, Lonza Group AG, Midland Company, Tate & Lyle PLC, and Others.
Food Bulking Agents Market Dynamics
Food Bulking Agents Market Trend: Shift Towards Low-calorie and Reduced-fat Food Products
A prominent trend in the food bulking agents market is the increasing demand for low-calorie and reduced-fat food products. As consumers become more health-conscious and seek healthier eating options, there is a growing preference for food products that offer the same volume and texture as traditional items but with fewer calories and reduced fat content. Food bulking agents play a crucial role in achieving this objective by providing bulk, texture, and mouthfeel to food products without significantly contributing to caloric content. Manufacturers are responding to this trend by incorporating innovative bulking agents derived from natural sources, such as soluble fibers, resistant starches, and hydrocolloids, into a wide range of food applications, including baked goods, dairy products, and snacks, to create healthier and more satisfying products that meet consumer preferences for reduced-calorie and lower-fat options.
Market Driver: Demand for Clean Label and Natural Ingredients
A key driver of the food bulking agents market is the growing demand for clean label and natural ingredients in food products. Consumers are increasingly seeking transparency in food labels and are wary of synthetic additives and artificial ingredients. Consequently, there is a rising preference for food products formulated with natural, minimally processed ingredients, including bulking agents derived from plant-based sources such as fruits, vegetables, and grains. Natural bulking agents not only provide texture and volume to food products but also align with consumer preferences for clean label products that are perceived as healthier and more wholesome. As a result, food manufacturers are increasingly replacing synthetic bulking agents with natural alternatives to meet consumer demand for clean label products and differentiate their offerings in the competitive market landscape.
Market Opportunity: Innovation in Functional and Nutritional Bulking Agents
An opportunity for the food bulking agents market lies in the innovation of functional and nutritional bulking agents that offer additional health benefits beyond texture and volume enhancement. With the growing emphasis on health and wellness, consumers are seeking food products that not only taste good but also provide added nutritional value and functional benefits. Manufacturers can capitalize on this opportunity by developing bulking agents enriched with functional ingredients such as dietary fibers, vitamins, minerals, and antioxidants, which offer health-promoting properties such as digestive health support, satiety enhancement, and blood sugar management. By incorporating functional and nutritional bulking agents into food products, manufacturers can create value-added offerings that appeal to health-conscious consumers and address specific health concerns, thereby expanding their market share and driving growth in the food bulking agents segment.
Food Bulking Agents Market Share Analysis: Flavors & Enhancers held the dominant market share in 2024
Flavors & enhancers represent the largest segment in the food bulking agents market by product. This predominance is driven by the growing demand for processed and convenience foods that require added flavors to enhance taste and appeal. As consumer preferences shift towards more varied and exotic flavors, food manufacturers increasingly rely on flavors and enhancers to differentiate their products in a competitive market. Additionally, the rise of health-conscious consumers seeking low-calorie and low-sugar alternatives has spurred the use of flavor enhancers to maintain the taste profile in such products. The versatility of flavors and enhancers allows them to be used across a wide range of food products, from snacks and beverages to dairy and bakery items, further contributing to their significant market share. This broad application, coupled with technological advancements in flavor extraction and formulation, ensures that flavors and enhancers remain the leading segment in the food bulking agents market.
Food Bulking Agents Market Share Analysis: Snacks market is poised to register the fastest growth rae over the forecast period to 2032
The snacks segment is the fastest-growing segment in the food bulking agents market by application. This rapid growth can be attributed to the increasing consumer demand for convenient and ready-to-eat food options that fit into busy lifestyles. Snacks, including chips, bars, and packaged nuts, often require bulking agents to improve texture, volume, and shelf life. The shift towards healthier snacking options has further fueled the need for natural and functional bulking agents that can enhance the nutritional profile without compromising taste. Further, the rise of snacking as a meal replacement, driven by changing eating habits and the popularity of on-the-go consumption, has led to a surge in innovative snack products. Manufacturers are continuously developing new formulations that incorporate bulking agents to meet the evolving preferences for low-calorie, high-protein, and fiber-rich snacks. These trends collectively contribute to the robust growth of the snacks segment within the food bulking agents market.
Food Bulking Agents Market Segmentation
By Product
Flavors & Enhancers
Antioxidants
Anticaking Agents
Emulsifiers
By Application
Confectionary
Hotels
Homes
Snacks
Bakery
Others
Countries Analyzed
North America (US, Canada, Mexico)
Europe (Germany, UK, France, Spain, Italy, Russia, Rest of Europe)
Asia Pacific (China, India, Japan, South Korea, Australia, South East Asia, Rest of Asia)
South America (Brazil, Argentina, Rest of South America)
Middle East and Africa (Saudi Arabia, UAE, Rest of Middle East, South Africa, Egypt, Rest of Africa)
Food Bulking Agents Companies Profiled in the Study
Archer Daniels Midland Company
Cargill Inc
DuPont de Nemours Inc
Ingredion Inc
Kerry Group plc
Lonza Group AG
Midland Company
Tate & Lyle PLC
*- List Not Exhaustive
Chapter 1. TABLE OF CONTENTS
Chapter 2. Introduction to Food Bulking Agents Market
2.1. Market Overview
2.2. Key Statistics and Report Highlights
2.3. Scope of the Comprehensive Study
2.3.1. Market Definition
2.3.2 Countries and Regions Covered
2.3.3 Research Objective
2.3.4 Units, Currency, and Conversions
2.3.5 Industry Value Chain
2.4. Key Market Segments
2.5. Key Companies
2.6. Study Period
Chapter 3. Strategic Analysis Review
3.1. Food Bulking Agents Pricing Analysis and Forecast
3.2. Porter’s Five Forces
3.3. Market Ecosystem
3.4. SWOT Analysis
3.5. Regulatory Scenario
3.3. Effects of Inflation, Russia-Ukraine War, moderating economic growth, and other macroeconomic factors
Chapter 4. Competitive Landscape
4.1. Market Share Analysis
4.1.1. Global Food Bulking Agents Market Share by Company, 2023
4.1.2. Product Offerings of Leading Food Bulking Agents Companies
4.2. Market Entropy
4.2.1. New Product Launches in the Industry
4.2.2. Mergers, Acquisitions, Joint ventures, and Partnerships
4.3. Key Strategies and Best Practices
Chapter 5. Global Market Projections: Best, Reference, and Low Case Scenarios
5.1. Growth Analysis- Case Scenario Definitions
5.2. Low Growth Case Scenario Forecasts
5.3. Reference Growth Case Scenario Forecasts
5.4. High Growth Case Scenario Forecasts
Chapter 6. Market Dynamics
6.1. Food Bulking Agents Market Drivers
6.2. Food Bulking Agents Market Challenges
6.6. Food Bulking Agents Market Opportunities
6.4. Food Bulking Agents Market Trends
Chapter 7. Global Food Bulking Agents Market Outlook Trends
7.1. Global Food Bulking Agents Revenue (USD Million) and CAGR (%) by Type (2021-2032)
7.2. Global Food Bulking Agents Revenue (USD Million) and CAGR (%) by Application (2021-2032)
7.3. Global Food Bulking Agents Revenue (USD Million) and CAGR (%) by Product (2021-2032)
By Product
Flavors & Enhancers
Antioxidants
Anticaking Agents
Emulsifiers
By Application
Confectionary
Hotels
Homes
Snacks
Bakery
Others
Chapter 8. Global Food Bulking Agents Regional Analysis and Outlook
8.1. Global Food Bulking Agents Revenue (USD Million) By Regions (2021- 2032)
8.2. North America Food Bulking Agents Revenue (USD Million) by Country (2021-2032)
8.2.1. United States Food Bulking Agents Regional Analysis and Outlook
8.2.2. Canada Food Bulking Agents Regional Analysis and Outlook
8.2.3. Mexico Food Bulking Agents Regional Analysis and Outlook
8.3. Europe Food Bulking Agents Revenue (USD Million), by Country (2021-2032)
8.3.1. Germany Food Bulking Agents Regional Analysis and Outlook
8.3.2. France Food Bulking Agents Regional Analysis and Outlook
8.3.3. United Kingdom Food Bulking Agents Regional Analysis and Outlook
8.3.4. Spain Food Bulking Agents Regional Analysis and Outlook
8.3.5. Italy Food Bulking Agents Regional Analysis and Outlook
8.3.6. Russia Food Bulking Agents Regional Analysis and Outlook
8.3.7. Rest of Europe Food Bulking Agents Regional Analysis and Outlook
8.4. Asia Pacific Food Bulking Agents Revenue (USD Million) by Country (2021-2032)
8.4.1. China Food Bulking Agents Regional Analysis and Outlook
8.4.2. Japan Food Bulking Agents Regional Analysis and Outlook
8.4.3. India Food Bulking Agents Regional Analysis and Outlook
8.4.4. South Korea Food Bulking Agents Regional Analysis and Outlook
8.4.5. Australia Food Bulking Agents Regional Analysis and Outlook
8.4.6. South East Asia Food Bulking Agents Regional Analysis and Outlook
8.4.7. Rest of Asia Pacific Food Bulking Agents Regional Analysis and Outlook
8.5. South America Food Bulking Agents Revenue (USD Million), by Country (2021-2032)
8.5.1. Brazil Food Bulking Agents Regional Analysis and Outlook
8.5.2. Argentina Food Bulking Agents Regional Analysis and Outlook
8.5.3. Rest of South America Food Bulking Agents Regional Analysis and Outlook
8.6. Middle East and Africa Food Bulking Agents Revenue (USD Million) by Country (2021-2032)
8.6.1. Middle East Food Bulking Agents Regional Analysis and Outlook
8.6.2. Africa Food Bulking Agents Regional Analysis and Outlook
Chapter 9. North America Food Bulking Agents Analysis and Outlook
9.1. North America Food Bulking Agents Revenue (USD Million) by Segments (2021-2032)
9.1.1. North America Food Bulking Agents Revenue (USD Million) by Type (2021-2032)
9.1.2. North America Food Bulking Agents Revenue (USD Million) by Application (2021-2032)
9.1.3. North America Food Bulking Agents Revenue (USD Million) by Product (2021-2032)
By Product
Flavors & Enhancers
Antioxidants
Anticaking Agents
Emulsifiers
By Application
Confectionary
Hotels
Homes
Snacks
Bakery
Others
Chapter 10. Europe Food Bulking Agents Analysis and Outlook
10.1. Europe Food Bulking Agents Revenue (USD Million), by Segments (USD Million) (2021-2032)
10.1.1. Europe Food Bulking Agents Revenue (USD Million) by Type (2021-2032)
10.1.2. Europe Food Bulking Agents Revenue (USD Million) by Application (2021-2032)
10.1.3. Europe Food Bulking Agents Revenue (USD Million) by Product (2021-2032)
By Product
Flavors & Enhancers
Antioxidants
Anticaking Agents
Emulsifiers
By Application
Confectionary
Hotels
Homes
Snacks
Bakery
Others
Chapter 11. Asia Pacific Food Bulking Agents Analysis and Outlook
11.1. Asia Pacific Food Bulking Agents Revenue (USD Million), and Revenue (USD Million) by Segments (2021-2032)
11.1.1. Asia Pacific Food Bulking Agents Revenue (USD Million) by Type (2021-2032)
11.1.2. Asia Pacific Food Bulking Agents Revenue (USD Million) by Application (2021-2032)
11.1.3. Asia Pacific Food Bulking Agents Revenue (USD Million) by Product (2021-2032)
By Product
Flavors & Enhancers
Antioxidants
Anticaking Agents
Emulsifiers
By Application
Confectionary
Hotels
Homes
Snacks
Bakery
Others
Chapter 12. South America Food Bulking Agents Analysis and Outlook
12.1. South America Food Bulking Agents Revenue (USD Million), by Segments (2021-2032)
12.1.1. South America Food Bulking Agents Revenue (USD Million) by Type (2021-2032)
12.1.2. South America Food Bulking Agents Revenue (USD Million) by Application (2021-2032)
12.1.3. South America Food Bulking Agents Revenue (USD Million) by Product (2021-2032)
By Product
Flavors & Enhancers
Antioxidants
Anticaking Agents
Emulsifiers
By Application
Confectionary
Hotels
Homes
Snacks
Bakery
Others
Chapter 13. Middle East and Africa Food Bulking Agents Analysis and Outlook
13.1. Middle East and Africa Food Bulking Agents Revenue (USD Million), by Segments (2021-2032)
13.1.1. Middle East and Africa Food Bulking Agents Revenue (USD Million) by Type (2021-2032)
13.1.2. Middle East and Africa Food Bulking Agents Revenue (USD Million) by Application (2021-2032)
13.1.3. Middle East and Africa Food Bulking Agents Revenue (USD Million) by Product (2021-2032)
By Product
Flavors & Enhancers
Antioxidants
Anticaking Agents
Emulsifiers
By Application
Confectionary
Hotels
Homes
Snacks
Bakery
Others
Chapter 14. Food Bulking Agents Company Profiles
14.1 Business Overview
14.2 Product Profiles
14.3 SWOT Profiles
14.5 Recent Developments
14.6 Financial Profile
List of Companies
Archer Daniels Midland Company
Cargill Inc
DuPont de Nemours Inc
Ingredion Inc
Kerry Group plc
Lonza Group AG
Midland Company
Tate & Lyle PLC
15. Methodology and Data Sources
15.1 Customization Offerings
15.2 Subscription Services
15.3 Related Reports
15.4 Publisher Expertise
LIST OF TABLES
Table 1 Market Segmentation Analysis
Table 2 Global Food Bulking Agents Market Share of Leading Companies, 2023
Table 3 Product Offerings of Leading Companies
Table 4 Low Growth Scenario Forecasts
Table 5 Reference Case Growth Scenario
Table 6 High Growth Case Scenario
Table 7 Global Food Bulking Agents Revenue (USD Million) And CAGR (%) By Type (2021-2032)
Table 8 Global Food Bulking Agents Revenue (USD Million) And CAGR (%) By Application (2021-2032)
Table 9 Global Food Bulking Agents Revenue (USD Million) And CAGR (%) By Product (2021-2032)
Table 10 Global Food Bulking Agents Market Revenue (USD Million) By Regions (2021-2032)
Table 11 Global Food Bulking Agents Market Share (%) By Regions (2021-2032)
Table 12 North America Food Bulking Agents Revenue (USD Million) By Country (2021-2032)
Table 13 Europe Food Bulking Agents Revenue (USD Million) By Country (2021-2032)
Table 14 Asia Pacific Food Bulking Agents Revenue (USD Million) By Country (2021-2032)
Table 15 South America Food Bulking Agents Revenue (USD Million) By Country (2021-2032)
Table 16 Middle East and Africa Food Bulking Agents Revenue (USD Million) By Region (2021-2032)
Table 17 North America Food Bulking Agents Revenue (USD Million) By Type (2021-2032)
Table 18 North America Food Bulking Agents Revenue (USD Million) By Application (2021-2032)
Table 19 North America Food Bulking Agents Revenue (USD Million) By Product (2021-2032)
Table 20 Europe Food Bulking Agents Revenue (USD Million) By Type (2021-2032)
Table 21 Europe Food Bulking Agents Revenue (USD Million) By Application (2021-2032)
Table 22 Europe Food Bulking Agents Revenue (USD Million) By Product (2021-2032)
Table 23 Asia Pacific Food Bulking Agents Revenue (USD Million) By Type (2021-2032)
Table 24 Asia Pacific Food Bulking Agents Revenue (USD Million) By Application (2021-2032)
Table 25 Asia Pacific Food Bulking Agents Revenue (USD Million) By Product (2021-2032)
Table 26 South America Food Bulking Agents Revenue (USD Million) By Type (2021-2032)
Table 27 South America Food Bulking Agents Revenue (USD Million) By Application (2021-2032)
Table 28 South America Food Bulking Agents Revenue (USD Million) By Product (2021-2032)
Table 29 Middle East and Africa Food Bulking Agents Revenue (USD Million) By Type (2021-2032)
Table 30 Middle East and Africa Food Bulking Agents Revenue (USD Million) By Application (2021-2032)
Table 31 Middle East and Africa Food Bulking Agents Revenue (USD Million) By Product (2021-2032)
LIST OF FIGURES
Figure 1. Market Scope
Figure 2. Pricing Forecasts Per Unit, 2023- 2032
Figure 3. Porter’s Five Forces
Figure 4. Global Food Bulking Agents Market Revenue (USD Million) By Regions (2021-2032)
Figure 5. Global Food Bulking Agents Market Share (%) By Regions (2023)
Figure 6. North America Food Bulking Agents Revenue (USD Million) By Country (2021-2032)
Figure 7. United States Food Bulking Agents Revenue (USD Million) By Country (2021-2032)
Figure 8. Canada Food Bulking Agents Revenue (USD Million) By Country (2021-2032)
Figure 9. Mexico Food Bulking Agents Revenue (USD Million) By Country (2021-2032)
Figure 10. Europe Food Bulking Agents Revenue (USD Million) By Country (2021-2032)
Figure 11. Germany Food Bulking Agents Revenue (USD Million) By Country (2021-2032)
Figure 12. France Food Bulking Agents Revenue (USD Million) By Country (2021-2032)
Figure 13. United Kingdom Food Bulking Agents Revenue (USD Million) By Country (2021-2032)
Figure 14. Spain Food Bulking Agents Revenue (USD Million) By Country (2021-2032)
Figure 15. Italy Food Bulking Agents Revenue (USD Million) By Country (2021-2032)
Figure 16. Russia Food Bulking Agents Revenue (USD Million) By Country (2021-2032)
Figure 17. Rest of Europe Food Bulking Agents Revenue (USD Million) By Country (2021-2032)
Figure 11. Asia Pacific Food Bulking Agents Revenue (USD Million) By Country (2021-2032)
Figure 12. China Food Bulking Agents Revenue (USD Million) By Country (2021-2032)
Figure 13. Japan Food Bulking Agents Revenue (USD Million) By Country (2021-2032)
Figure 14. India Food Bulking Agents Revenue (USD Million) By Country (2021-2032)
Figure 15. South Korea Food Bulking Agents Revenue (USD Million) By Country (2021-2032)
Figure 16. Australia Food Bulking Agents Revenue (USD Million) By Country (2021-2032)
Figure 17. South East Asia Food Bulking Agents Revenue (USD Million) By Country (2021-2032)
Figure 18. South America Food Bulking Agents Revenue (USD Million) By Country (2021-2032)
Figure 19. Brazil Food Bulking Agents Revenue (USD Million) By Country (2021-2032)
Figure 20. Argentina Food Bulking Agents Revenue (USD Million) By Country (2021-2032)
Figure 21. Rest of Asia Pacific Food Bulking Agents Revenue (USD Million) By Country (2021-2032)
Figure 22. Middle East and Africa Food Bulking Agents Revenue (USD Million) By Region (2021-2032)
Figure 23. Saudi Arabia Food Bulking Agents Revenue (USD Million) By Region (2021-2032)
Figure 24. The UAE Food Bulking Agents Revenue (USD Million) By Region (2021-2032)
Figure 25. Rest of Middle East Food Bulking Agents Revenue (USD Million) By Region (2021-2032)
Figure 26. South Africa Food Bulking Agents Revenue (USD Million) By Region (2021-2032)
Figure 27. Africa Food Bulking Agents Revenue (USD Million) By Region (2021-2032)
Figure 28. North America Food Bulking Agents Revenue (USD Million) By Type (2021-2032)
Figure 29. North America Food Bulking Agents Revenue (USD Million) By Application (2021-2032)
Figure 30. North America Food Bulking Agents Revenue (USD Million) By Product (2021-2032)
Figure 31. Europe Food Bulking Agents Revenue (USD Million) By Type (2021-2032)
Figure 32. Europe Food Bulking Agents Revenue (USD Million) By Application (2021-2032)
Figure 33. Europe Food Bulking Agents Revenue (USD Million) By Product (2021-2032)
Figure 34. Asia Pacific Food Bulking Agents Revenue (USD Million) By Type (2021-2032)
Figure 35. Asia Pacific Food Bulking Agents Revenue (USD Million) By Application (2021-2032)
Figure 36. Asia Pacific Food Bulking Agents Revenue (USD Million) By Product (2021-2032)
Figure 37. South America Food Bulking Agents Revenue (USD Million) By Type (2021-2032)
Figure 38. South America Food Bulking Agents Revenue (USD Million) By Application (2021-2032)
Figure 39. South America Food Bulking Agents Revenue (USD Million) By Product (2021-2032)
Figure 40. Middle East and Africa Food Bulking Agents Revenue (USD Million) By Type (2021-2032)
Figure 41. Middle East and Africa Food Bulking Agents Revenue (USD Million) By Application (2021-2032)
Figure 42. Middle East and Africa Food Bulking Agents Revenue (USD Million) By Product (2021-2032)
By Product
Flavors & Enhancers
Antioxidants
Anticaking Agents
Emulsifiers
By Application
Confectionary
Hotels
Homes
Snacks
Bakery
Others
Countries Analyzed
North America (US, Canada, Mexico)
Europe (Germany, UK, France, Spain, Italy, Russia, Rest of Europe)
Asia Pacific (China, India, Japan, South Korea, Australia, South East Asia, Rest of Asia)
South America (Brazil, Argentina, Rest of South America)
Middle East and Africa (Saudi Arabia, UAE, Rest of Middle East, South Africa, Egypt, Rest of Africa)
