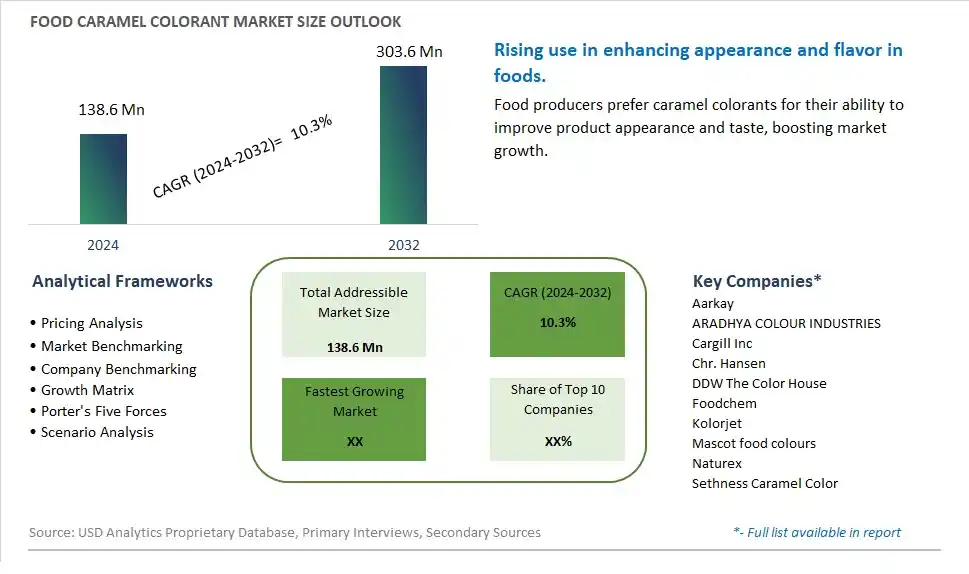
Global Food Caramel Colorant Market Size is valued at $138.6 Million in 2024 and is forecast to register a growth rate (CAGR) of 10.3% to reach $303.6 Million by 2032.
The global Food Caramel Colorant Market Comprehensive Study analyzes and forecasts the market size across 6 regions and 24 countries for diverse segments -By Type (Caramel Colorant Powder, Caramel Colorant Liquid), By Application (Beverage, Baking, Candy, Others)
An Introduction to Food Caramel Colorant Market
The Food Caramel Colorant market in 2024 is thriving, fueled by the rising demand for natural and appealing colorants in food and beverage products. Caramel colorant, derived from heated sugar, is widely used to enhance the appearance of soft drinks, baked goods, sauces, and confectioneries. The market benefits from advancements in caramelization and production technologies, the growing trend of clean label and natural ingredients, and the expansion of the processed food sector. Additionally, the increasing focus on product aesthetics and consumer preference for naturally colored foods is driving market growth.
Food Caramel Colorant Competitive Landscape
The market report analyses the leading companies in the industry including Aarkay, ARADHYA COLOUR INDUSTRIES, Cargill Inc, Chr. Hansen, DDW The Color House, Foodchem, Kolorjet, Mascot food colours, Naturex, Sethness Caramel Color, and Others.
Food Caramel Colorant Market Dynamics
Food Caramel Colorant Market Trend: Shift Towards Natural and Clean Label Ingredients
One prominent trend in the food caramel colorant market is the shift towards natural and clean label ingredients. Consumers and food manufacturers are increasingly prioritizing food products with transparent ingredient lists, free from artificial additives, colors, and preservatives. Caramel colorants derived from natural sources such as sugar or corn offer a clean label alternative for achieving desirable color shades in food and beverage products. This trend is driven by the demand for healthier, more natural options, as well as regulatory pressure and consumer preferences for clean label formulations that align with modern dietary trends and wellness goals.
Food Caramel Colorant Market Driver: Replacement of Synthetic Colors and Regulatory Compliance
A key driver propelling the food caramel colorant market is the replacement of synthetic colors and the need for regulatory compliance. Regulatory agencies worldwide are implementing stricter guidelines and restrictions on synthetic food colors due to concerns about potential health risks and consumer preferences for natural alternatives. Caramel colorants, being natural and safe, are preferred by food manufacturers as substitutes for synthetic colors, driving the adoption of caramel colorants in various food and beverage applications. The driver behind this trend is the imperative for food companies to comply with regulatory standards while meeting consumer demands for clean label products and safer food coloring options.
Food Caramel Colorant Market Opportunity: Innovation in Label-Friendly Caramel Color Solutions
A significant opportunity in the food caramel colorant market lies in innovation in label-friendly caramel color solutions that offer versatility, stability, and vibrant color options while meeting clean label criteria. Manufacturers can capitalize on this opportunity by developing caramel colorants with improved heat stability, pH tolerance, and color intensity to suit a wide range of food and beverage applications, including carbonated drinks, sauces, bakery products, and confectionery items. Additionally, there's potential for creating specialty caramel colors with unique flavor profiles, such as burnt sugar or caramelized fruit notes, to enhance product differentiation and sensory appeal. By focusing on label-friendly innovation and addressing market demands for natural, clean label colorants, companies can gain a competitive edge, expand their customer base, and drive growth in the dynamic food caramel colorant segment.
Food Caramel Colorant Market Share Analysis: Caramel Colorant Liquid segment generated the highest revenue share in the industry
In the Food Caramel Colorant Market, the Caramel Colorant Liquid segment emerges as the largest. Caramel colorants in liquid form are widely used in various food and beverage applications due to their ease of handling, consistent quality, and versatility in achieving desired color intensities. Liquid caramel colorants are preferred in industries such as beverages, bakery, and confectionery where precise color control and uniform dispersion are crucial for product consistency and appeal. They are valued for their ability to impart rich, golden-brown hues to products without altering taste profiles significantly. As consumer preferences evolve towards natural ingredients and clean labels, manufacturers often choose liquid caramel colorants for their simpler ingredient declarations compared to powdered forms.
Food Caramel Colorant Market Share Analysis: Beverage Application is the fastest growing segment over the forecast period to 2032
Among the applications in the Food Caramel Colorant Market, the Beverage segment exhibits the fastest growth trajectory to 2032. Caramel colorants play a critical role in enhancing the appearance and appeal of beverages ranging from carbonated soft drinks and beers to spirits and coffee-based drinks. Beverages often rely on caramel colorants to achieve desirable shades of amber or brown, which are visually appealing and suggestive of flavors like cola, root beer, and whiskey. The beverage industry's robust growth, driven by expanding consumer preferences for flavored and functional beverages, underscores the increasing demand for caramel colorants. Further, innovations in beverage formulations, including natural and organic options, continue to drive the adoption of caramel colorants that meet stringent regulatory standards while satisfying consumer expectations for both taste and aesthetics.
Food Caramel Colorant Market Segmentation
By Type
Caramel Colorant Powder
Caramel Colorant Liquid
By Application
Beverage
Baking
Candy
Others
Countries Analyzed
North America (US, Canada, Mexico)
Europe (Germany, UK, France, Spain, Italy, Russia, Rest of Europe)
Asia Pacific (China, India, Japan, South Korea, Australia, South East Asia, Rest of Asia)
South America (Brazil, Argentina, Rest of South America)
Middle East and Africa (Saudi Arabia, UAE, Rest of Middle East, South Africa, Egypt, Rest of Africa)
Food Caramel Colorant Companies Profiled in the Study
Aarkay
ARADHYA COLOUR INDUSTRIES
Cargill Inc
Chr. Hansen
DDW The Color House
Foodchem
Kolorjet
Mascot food colours
Naturex
Sethness Caramel Color
*- List Not Exhaustive
Chapter 1. TABLE OF CONTENTS
Chapter 2. Introduction to Food Caramel Colorant Market
2.1. Market Overview
2.2. Key Statistics and Report Highlights
2.3. Scope of the Comprehensive Study
2.3.1. Market Definition
2.3.2 Countries and Regions Covered
2.3.3 Research Objective
2.3.4 Units, Currency, and Conversions
2.3.5 Industry Value Chain
2.4. Key Market Segments
2.5. Key Companies
2.6. Study Period
Chapter 3. Strategic Analysis Review
3.1. Food Caramel Colorant Pricing Analysis and Forecast
3.2. Porter’s Five Forces
3.3. Market Ecosystem
3.4. SWOT Analysis
3.5. Regulatory Scenario
3.3. Effects of Inflation, Russia-Ukraine War, moderating economic growth, and other macroeconomic factors
Chapter 4. Competitive Landscape
4.1. Market Share Analysis
4.1.1. Global Food Caramel Colorant Market Share by Company, 2023
4.1.2. Product Offerings of Leading Food Caramel Colorant Companies
4.2. Market Entropy
4.2.1. New Product Launches in the Industry
4.2.2. Mergers, Acquisitions, Joint ventures, and Partnerships
4.3. Key Strategies and Best Practices
Chapter 5. Global Market Projections: Best, Reference, and Low Case Scenarios
5.1. Growth Analysis- Case Scenario Definitions
5.2. Low Growth Case Scenario Forecasts
5.3. Reference Growth Case Scenario Forecasts
5.4. High Growth Case Scenario Forecasts
Chapter 6. Market Dynamics
6.1. Food Caramel Colorant Market Drivers
6.2. Food Caramel Colorant Market Challenges
6.6. Food Caramel Colorant Market Opportunities
6.4. Food Caramel Colorant Market Trends
Chapter 7. Global Food Caramel Colorant Market Outlook Trends
7.1. Global Food Caramel Colorant Revenue (USD Million) and CAGR (%) by Type (2021-2032)
7.2. Global Food Caramel Colorant Revenue (USD Million) and CAGR (%) by Application (2021-2032)
7.3. Global Food Caramel Colorant Revenue (USD Million) and CAGR (%) by Product (2021-2032)
By Type
Caramel Colorant Powder
Caramel Colorant Liquid
By Application
Beverage
Baking
Candy
Others
Chapter 8. Global Food Caramel Colorant Regional Analysis and Outlook
8.1. Global Food Caramel Colorant Revenue (USD Million) By Regions (2021- 2032)
8.2. North America Food Caramel Colorant Revenue (USD Million) by Country (2021-2032)
8.2.1. United States Food Caramel Colorant Regional Analysis and Outlook
8.2.2. Canada Food Caramel Colorant Regional Analysis and Outlook
8.2.3. Mexico Food Caramel Colorant Regional Analysis and Outlook
8.3. Europe Food Caramel Colorant Revenue (USD Million), by Country (2021-2032)
8.3.1. Germany Food Caramel Colorant Regional Analysis and Outlook
8.3.2. France Food Caramel Colorant Regional Analysis and Outlook
8.3.3. United Kingdom Food Caramel Colorant Regional Analysis and Outlook
8.3.4. Spain Food Caramel Colorant Regional Analysis and Outlook
8.3.5. Italy Food Caramel Colorant Regional Analysis and Outlook
8.3.6. Russia Food Caramel Colorant Regional Analysis and Outlook
8.3.7. Rest of Europe Food Caramel Colorant Regional Analysis and Outlook
8.4. Asia Pacific Food Caramel Colorant Revenue (USD Million) by Country (2021-2032)
8.4.1. China Food Caramel Colorant Regional Analysis and Outlook
8.4.2. Japan Food Caramel Colorant Regional Analysis and Outlook
8.4.3. India Food Caramel Colorant Regional Analysis and Outlook
8.4.4. South Korea Food Caramel Colorant Regional Analysis and Outlook
8.4.5. Australia Food Caramel Colorant Regional Analysis and Outlook
8.4.6. South East Asia Food Caramel Colorant Regional Analysis and Outlook
8.4.7. Rest of Asia Pacific Food Caramel Colorant Regional Analysis and Outlook
8.5. South America Food Caramel Colorant Revenue (USD Million), by Country (2021-2032)
8.5.1. Brazil Food Caramel Colorant Regional Analysis and Outlook
8.5.2. Argentina Food Caramel Colorant Regional Analysis and Outlook
8.5.3. Rest of South America Food Caramel Colorant Regional Analysis and Outlook
8.6. Middle East and Africa Food Caramel Colorant Revenue (USD Million) by Country (2021-2032)
8.6.1. Middle East Food Caramel Colorant Regional Analysis and Outlook
8.6.2. Africa Food Caramel Colorant Regional Analysis and Outlook
Chapter 9. North America Food Caramel Colorant Analysis and Outlook
9.1. North America Food Caramel Colorant Revenue (USD Million) by Segments (2021-2032)
9.1.1. North America Food Caramel Colorant Revenue (USD Million) by Type (2021-2032)
9.1.2. North America Food Caramel Colorant Revenue (USD Million) by Application (2021-2032)
9.1.3. North America Food Caramel Colorant Revenue (USD Million) by Product (2021-2032)
By Type
Caramel Colorant Powder
Caramel Colorant Liquid
By Application
Beverage
Baking
Candy
Others
Chapter 10. Europe Food Caramel Colorant Analysis and Outlook
10.1. Europe Food Caramel Colorant Revenue (USD Million), by Segments (USD Million) (2021-2032)
10.1.1. Europe Food Caramel Colorant Revenue (USD Million) by Type (2021-2032)
10.1.2. Europe Food Caramel Colorant Revenue (USD Million) by Application (2021-2032)
10.1.3. Europe Food Caramel Colorant Revenue (USD Million) by Product (2021-2032)
By Type
Caramel Colorant Powder
Caramel Colorant Liquid
By Application
Beverage
Baking
Candy
Others
Chapter 11. Asia Pacific Food Caramel Colorant Analysis and Outlook
11.1. Asia Pacific Food Caramel Colorant Revenue (USD Million), and Revenue (USD Million) by Segments (2021-2032)
11.1.1. Asia Pacific Food Caramel Colorant Revenue (USD Million) by Type (2021-2032)
11.1.2. Asia Pacific Food Caramel Colorant Revenue (USD Million) by Application (2021-2032)
11.1.3. Asia Pacific Food Caramel Colorant Revenue (USD Million) by Product (2021-2032)
By Type
Caramel Colorant Powder
Caramel Colorant Liquid
By Application
Beverage
Baking
Candy
Others
Chapter 12. South America Food Caramel Colorant Analysis and Outlook
12.1. South America Food Caramel Colorant Revenue (USD Million), by Segments (2021-2032)
12.1.1. South America Food Caramel Colorant Revenue (USD Million) by Type (2021-2032)
12.1.2. South America Food Caramel Colorant Revenue (USD Million) by Application (2021-2032)
12.1.3. South America Food Caramel Colorant Revenue (USD Million) by Product (2021-2032)
By Type
Caramel Colorant Powder
Caramel Colorant Liquid
By Application
Beverage
Baking
Candy
Others
Chapter 13. Middle East and Africa Food Caramel Colorant Analysis and Outlook
13.1. Middle East and Africa Food Caramel Colorant Revenue (USD Million), by Segments (2021-2032)
13.1.1. Middle East and Africa Food Caramel Colorant Revenue (USD Million) by Type (2021-2032)
13.1.2. Middle East and Africa Food Caramel Colorant Revenue (USD Million) by Application (2021-2032)
13.1.3. Middle East and Africa Food Caramel Colorant Revenue (USD Million) by Product (2021-2032)
By Type
Caramel Colorant Powder
Caramel Colorant Liquid
By Application
Beverage
Baking
Candy
Others
Chapter 14. Food Caramel Colorant Company Profiles
14.1 Business Overview
14.2 Product Profiles
14.3 SWOT Profiles
14.5 Recent Developments
14.6 Financial Profile
List of Companies
Aarkay
ARADHYA COLOUR INDUSTRIES
Cargill Inc
Chr. Hansen
DDW The Color House
Foodchem
Kolorjet
Mascot food colours
Naturex
Sethness Caramel Color
15. Methodology and Data Sources
15.1 Customization Offerings
15.2 Subscription Services
15.3 Related Reports
15.4 Publisher Expertise
LIST OF TABLES
Table 1 Market Segmentation Analysis
Table 2 Global Food Caramel Colorant Market Share of Leading Companies, 2023
Table 3 Product Offerings of Leading Companies
Table 4 Low Growth Scenario Forecasts
Table 5 Reference Case Growth Scenario
Table 6 High Growth Case Scenario
Table 7 Global Food Caramel Colorant Revenue (USD Million) And CAGR (%) By Type (2021-2032)
Table 8 Global Food Caramel Colorant Revenue (USD Million) And CAGR (%) By Application (2021-2032)
Table 9 Global Food Caramel Colorant Revenue (USD Million) And CAGR (%) By Product (2021-2032)
Table 10 Global Food Caramel Colorant Market Revenue (USD Million) By Regions (2021-2032)
Table 11 Global Food Caramel Colorant Market Share (%) By Regions (2021-2032)
Table 12 North America Food Caramel Colorant Revenue (USD Million) By Country (2021-2032)
Table 13 Europe Food Caramel Colorant Revenue (USD Million) By Country (2021-2032)
Table 14 Asia Pacific Food Caramel Colorant Revenue (USD Million) By Country (2021-2032)
Table 15 South America Food Caramel Colorant Revenue (USD Million) By Country (2021-2032)
Table 16 Middle East and Africa Food Caramel Colorant Revenue (USD Million) By Region (2021-2032)
Table 17 North America Food Caramel Colorant Revenue (USD Million) By Type (2021-2032)
Table 18 North America Food Caramel Colorant Revenue (USD Million) By Application (2021-2032)
Table 19 North America Food Caramel Colorant Revenue (USD Million) By Product (2021-2032)
Table 20 Europe Food Caramel Colorant Revenue (USD Million) By Type (2021-2032)
Table 21 Europe Food Caramel Colorant Revenue (USD Million) By Application (2021-2032)
Table 22 Europe Food Caramel Colorant Revenue (USD Million) By Product (2021-2032)
Table 23 Asia Pacific Food Caramel Colorant Revenue (USD Million) By Type (2021-2032)
Table 24 Asia Pacific Food Caramel Colorant Revenue (USD Million) By Application (2021-2032)
Table 25 Asia Pacific Food Caramel Colorant Revenue (USD Million) By Product (2021-2032)
Table 26 South America Food Caramel Colorant Revenue (USD Million) By Type (2021-2032)
Table 27 South America Food Caramel Colorant Revenue (USD Million) By Application (2021-2032)
Table 28 South America Food Caramel Colorant Revenue (USD Million) By Product (2021-2032)
Table 29 Middle East and Africa Food Caramel Colorant Revenue (USD Million) By Type (2021-2032)
Table 30 Middle East and Africa Food Caramel Colorant Revenue (USD Million) By Application (2021-2032)
Table 31 Middle East and Africa Food Caramel Colorant Revenue (USD Million) By Product (2021-2032)
LIST OF FIGURES
Figure 1. Market Scope
Figure 2. Pricing Forecasts Per Unit, 2023- 2032
Figure 3. Porter’s Five Forces
Figure 4. Global Food Caramel Colorant Market Revenue (USD Million) By Regions (2021-2032)
Figure 5. Global Food Caramel Colorant Market Share (%) By Regions (2023)
Figure 6. North America Food Caramel Colorant Revenue (USD Million) By Country (2021-2032)
Figure 7. United States Food Caramel Colorant Revenue (USD Million) By Country (2021-2032)
Figure 8. Canada Food Caramel Colorant Revenue (USD Million) By Country (2021-2032)
Figure 9. Mexico Food Caramel Colorant Revenue (USD Million) By Country (2021-2032)
Figure 10. Europe Food Caramel Colorant Revenue (USD Million) By Country (2021-2032)
Figure 11. Germany Food Caramel Colorant Revenue (USD Million) By Country (2021-2032)
Figure 12. France Food Caramel Colorant Revenue (USD Million) By Country (2021-2032)
Figure 13. United Kingdom Food Caramel Colorant Revenue (USD Million) By Country (2021-2032)
Figure 14. Spain Food Caramel Colorant Revenue (USD Million) By Country (2021-2032)
Figure 15. Italy Food Caramel Colorant Revenue (USD Million) By Country (2021-2032)
Figure 16. Russia Food Caramel Colorant Revenue (USD Million) By Country (2021-2032)
Figure 17. Rest of Europe Food Caramel Colorant Revenue (USD Million) By Country (2021-2032)
Figure 11. Asia Pacific Food Caramel Colorant Revenue (USD Million) By Country (2021-2032)
Figure 12. China Food Caramel Colorant Revenue (USD Million) By Country (2021-2032)
Figure 13. Japan Food Caramel Colorant Revenue (USD Million) By Country (2021-2032)
Figure 14. India Food Caramel Colorant Revenue (USD Million) By Country (2021-2032)
Figure 15. South Korea Food Caramel Colorant Revenue (USD Million) By Country (2021-2032)
Figure 16. Australia Food Caramel Colorant Revenue (USD Million) By Country (2021-2032)
Figure 17. South East Asia Food Caramel Colorant Revenue (USD Million) By Country (2021-2032)
Figure 18. South America Food Caramel Colorant Revenue (USD Million) By Country (2021-2032)
Figure 19. Brazil Food Caramel Colorant Revenue (USD Million) By Country (2021-2032)
Figure 20. Argentina Food Caramel Colorant Revenue (USD Million) By Country (2021-2032)
Figure 21. Rest of Asia Pacific Food Caramel Colorant Revenue (USD Million) By Country (2021-2032)
Figure 22. Middle East and Africa Food Caramel Colorant Revenue (USD Million) By Region (2021-2032)
Figure 23. Saudi Arabia Food Caramel Colorant Revenue (USD Million) By Region (2021-2032)
Figure 24. The UAE Food Caramel Colorant Revenue (USD Million) By Region (2021-2032)
Figure 25. Rest of Middle East Food Caramel Colorant Revenue (USD Million) By Region (2021-2032)
Figure 26. South Africa Food Caramel Colorant Revenue (USD Million) By Region (2021-2032)
Figure 27. Africa Food Caramel Colorant Revenue (USD Million) By Region (2021-2032)
Figure 28. North America Food Caramel Colorant Revenue (USD Million) By Type (2021-2032)
Figure 29. North America Food Caramel Colorant Revenue (USD Million) By Application (2021-2032)
Figure 30. North America Food Caramel Colorant Revenue (USD Million) By Product (2021-2032)
Figure 31. Europe Food Caramel Colorant Revenue (USD Million) By Type (2021-2032)
Figure 32. Europe Food Caramel Colorant Revenue (USD Million) By Application (2021-2032)
Figure 33. Europe Food Caramel Colorant Revenue (USD Million) By Product (2021-2032)
Figure 34. Asia Pacific Food Caramel Colorant Revenue (USD Million) By Type (2021-2032)
Figure 35. Asia Pacific Food Caramel Colorant Revenue (USD Million) By Application (2021-2032)
Figure 36. Asia Pacific Food Caramel Colorant Revenue (USD Million) By Product (2021-2032)
Figure 37. South America Food Caramel Colorant Revenue (USD Million) By Type (2021-2032)
Figure 38. South America Food Caramel Colorant Revenue (USD Million) By Application (2021-2032)
Figure 39. South America Food Caramel Colorant Revenue (USD Million) By Product (2021-2032)
Figure 40. Middle East and Africa Food Caramel Colorant Revenue (USD Million) By Type (2021-2032)
Figure 41. Middle East and Africa Food Caramel Colorant Revenue (USD Million) By Application (2021-2032)
Figure 42. Middle East and Africa Food Caramel Colorant Revenue (USD Million) By Product (2021-2032)
By Type
Caramel Colorant Powder
Caramel Colorant Liquid
By Application
Beverage
Baking
Candy
Others
Countries Analyzed
North America (US, Canada, Mexico)
Europe (Germany, UK, France, Spain, Italy, Russia, Rest of Europe)
Asia Pacific (China, India, Japan, South Korea, Australia, South East Asia, Rest of Asia)
South America (Brazil, Argentina, Rest of South America)
Middle East and Africa (Saudi Arabia, UAE, Rest of Middle East, South Africa, Egypt, Rest of Africa)
