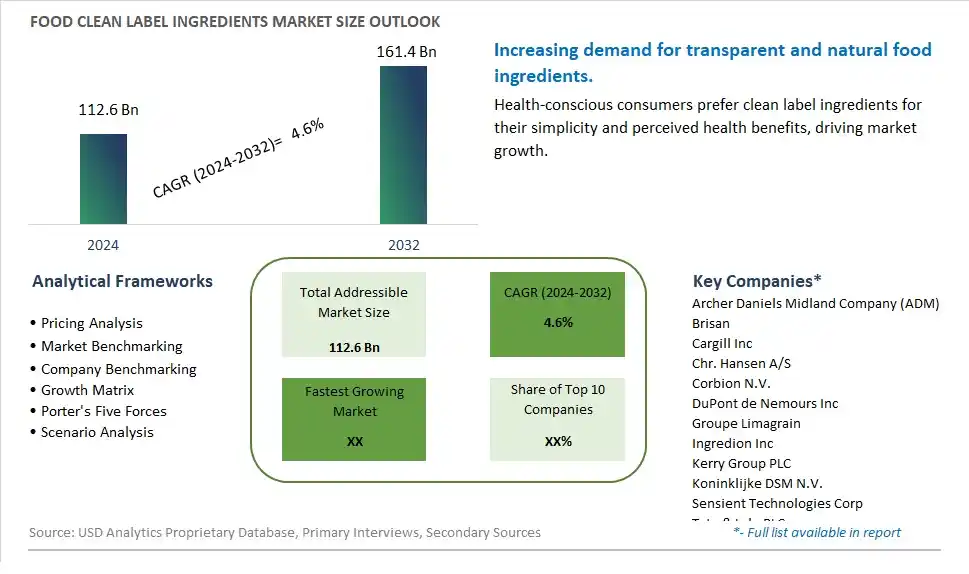
Global Food Clean Label Ingredients Market Size is valued at $112.6 Billion in 2024 and is forecast to register a growth rate (CAGR) of 4.6% to reach $161.4 Billion by 2032.
The global Food Clean Label Ingredients Market Comprehensive Study analyzes and forecasts the market size across 6 regions and 24 countries for diverse segments -By Type (Natural Colors, Natural Flavors, Fruit & Vegetable Ingredients, Starch & Sweeteners, Flours, Malt, Others), By Application (Beverages, Dairy & Frozen Desserts, Bakery, Prepared Food/Ready Meals & Processed Foods, Cereals & Snacks, Others)
An Introduction to Food Clean Label Ingredients Market
The Food Clean Label Ingredients market in 2024 is experiencing significant growth, driven by the rising consumer demand for transparency and natural ingredients in food products. Clean label ingredients, which are free from artificial additives, preservatives, and GMOs, are increasingly used in various food applications. The market benefits from advancements in ingredient extraction and processing technologies, the growing trend of health-conscious and ethical eating, and the expansion of the organic and natural food sectors. Additionally, the increasing focus on simple, recognizable ingredients on product labels is driving market growth.
Food Clean Label Ingredients Competitive Landscape
The market report analyses the leading companies in the industry including Archer Daniels Midland Company (ADM), Brisan, Cargill Inc, Chr. Hansen A/S, Corbion N.V., DuPont de Nemours Inc, Groupe Limagrain, Ingredion Inc, Kerry Group PLC, Koninklijke DSM N.V., Sensient Technologies Corp, Tate & Lyle PLC, and Others.
Food Clean Label Ingredients Market Dynamics
Food Clean Label Ingredients Market Trend: Growing Demand for Transparency and Clean Label Products
One prominent trend in the food clean label ingredients market is the growing demand for transparency and clean label products. Consumers are increasingly conscious of what goes into their food and are seeking products with simple, recognizable ingredients lists, free from artificial additives, preservatives, and synthetic chemicals. This trend is driven by a desire for healthier options, transparency in food sourcing and processing, and concerns about the impact of additives on health and well-being. Food manufacturers are responding by reformulating their products using clean label ingredients, such as natural flavors, colors, sweeteners, and preservatives, to meet consumer preferences for clean, wholesome, and transparent food choices.
Food Clean Label Ingredients Market Driver: Regulatory Mandates and Consumer Awareness
A key driver propelling the food clean label ingredients market is regulatory mandates and increasing consumer awareness. Regulatory bodies worldwide are imposing stricter labeling requirements, advocating for clean label practices, and scrutinizing the use of artificial ingredients in food products. Additionally, consumer education and advocacy groups are raising awareness about the importance of clean label ingredients, nutritional transparency, and the potential health impacts of artificial additives, driving consumer demand for cleaner, simpler food formulations. The driver behind this trend is the convergence of regulatory pressures and consumer activism, pushing food companies to prioritize clean label initiatives, ingredient transparency, and ethical sourcing practices to maintain compliance and meet evolving consumer expectations.
Food Clean Label Ingredients Market Opportunity: Innovation in Natural and Functional Clean Label Ingredients
A significant opportunity in the food clean label ingredients market lies in innovation in natural and functional clean label ingredients that offer both nutritional benefits and clean label appeal. Manufacturers can capitalize on this opportunity by developing clean label alternatives to traditional additives, such as natural colors derived from fruits and vegetables, plant-based thickeners and stabilizers, clean label sweeteners like stevia and monk fruit, and natural preservatives such as rosemary extract or tocopherols. Additionally, there's potential for creating functional clean label ingredients that provide added health benefits, such as probiotic cultures, plant-based proteins, fiber-rich ingredients, and antioxidant-rich extracts. By focusing on innovation, functionality, and clean label attributes, companies can meet the demand for clean label ingredients, differentiate their products, and capture market share in the rapidly growing clean label food industry.
Food Clean Label Ingredients Market Share Analysis: Natural Flavors segment generated the highest revenue share in the industry
In the Food Clean Label Ingredients Market, Natural Flavors emerge as the largest segment. Natural flavors are increasingly preferred by consumers seeking transparency and healthier options in their food products. These ingredients are derived from natural sources such as fruits, vegetables, herbs, and spices, without synthetic additives or artificial enhancers. The demand for natural flavors is driven by growing awareness about health and wellness, coupled with regulatory trends favoring clean label formulations. Food manufacturers are reformulating their products to replace synthetic flavors with natural alternatives, aiming to meet consumer expectations for authenticity and nutritional integrity. Natural flavors not only enhance taste but also align with clean label principles, appealing to a broad spectrum of health-conscious consumers globally.
Food Clean Label Ingredients Market Share Analysis: Dairy & Frozen Desserts Application is the fastest growing segment over the forecast period to 2032
Among the applications in the Food Clean Label Ingredients Market, the Dairy & Frozen Desserts segment demonstrates the fastest growth potential to 2032. Clean label ingredients are increasingly sought after in dairy and frozen dessert products as consumers prioritize natural, recognizable ingredients in their indulgent treats. Clean label dairy and frozen dessert formulations focus on eliminating artificial additives, preservatives, and flavors, while incorporating natural alternatives that enhance taste and texture. This shift is driven by consumer demand for healthier, more wholesome options without compromising on sensory experience. Manufacturers are leveraging clean label ingredients to differentiate their offerings, meet evolving consumer preferences, and capitalize on the growing market for natural and minimally processed food products.
Food Clean Label Ingredients Market Segmentation
By Type
Natural Colors
Natural Flavors
Fruit & Vegetable Ingredients
Starch & Sweeteners
Flours
Malt
Others
By Application
Beverages
Dairy & Frozen Desserts
Bakery
Prepared Food/Ready Meals & Processed Foods
Cereals & Snacks
Others
Countries Analyzed
North America (US, Canada, Mexico)
Europe (Germany, UK, France, Spain, Italy, Russia, Rest of Europe)
Asia Pacific (China, India, Japan, South Korea, Australia, South East Asia, Rest of Asia)
South America (Brazil, Argentina, Rest of South America)
Middle East and Africa (Saudi Arabia, UAE, Rest of Middle East, South Africa, Egypt, Rest of Africa)
Food Clean Label Ingredients Companies Profiled in the Study
Archer Daniels Midland Company (ADM)
Brisan
Cargill Inc
Chr. Hansen A/S
Corbion N.V.
DuPont de Nemours Inc
Groupe Limagrain
Ingredion Inc
Kerry Group PLC
Koninklijke DSM N.V.
Sensient Technologies Corp
Tate & Lyle PLC
*- List Not Exhaustive
Chapter 1. TABLE OF CONTENTS
Chapter 2. Introduction to Food Clean Label Ingredients Market
2.1. Market Overview
2.2. Key Statistics and Report Highlights
2.3. Scope of the Comprehensive Study
2.3.1. Market Definition
2.3.2 Countries and Regions Covered
2.3.3 Research Objective
2.3.4 Units, Currency, and Conversions
2.3.5 Industry Value Chain
2.4. Key Market Segments
2.5. Key Companies
2.6. Study Period
Chapter 3. Strategic Analysis Review
3.1. Food Clean Label Ingredients Pricing Analysis and Forecast
3.2. Porter’s Five Forces
3.3. Market Ecosystem
3.4. SWOT Analysis
3.5. Regulatory Scenario
3.3. Effects of Inflation, Russia-Ukraine War, moderating economic growth, and other macroeconomic factors
Chapter 4. Competitive Landscape
4.1. Market Share Analysis
4.1.1. Global Food Clean Label Ingredients Market Share by Company, 2023
4.1.2. Product Offerings of Leading Food Clean Label Ingredients Companies
4.2. Market Entropy
4.2.1. New Product Launches in the Industry
4.2.2. Mergers, Acquisitions, Joint ventures, and Partnerships
4.3. Key Strategies and Best Practices
Chapter 5. Global Market Projections: Best, Reference, and Low Case Scenarios
5.1. Growth Analysis- Case Scenario Definitions
5.2. Low Growth Case Scenario Forecasts
5.3. Reference Growth Case Scenario Forecasts
5.4. High Growth Case Scenario Forecasts
Chapter 6. Market Dynamics
6.1. Food Clean Label Ingredients Market Drivers
6.2. Food Clean Label Ingredients Market Challenges
6.6. Food Clean Label Ingredients Market Opportunities
6.4. Food Clean Label Ingredients Market Trends
Chapter 7. Global Food Clean Label Ingredients Market Outlook Trends
7.1. Global Food Clean Label Ingredients Revenue (USD Million) and CAGR (%) by Type (2021-2032)
7.2. Global Food Clean Label Ingredients Revenue (USD Million) and CAGR (%) by Application (2021-2032)
7.3. Global Food Clean Label Ingredients Revenue (USD Million) and CAGR (%) by Product (2021-2032)
By Type
Natural Colors
Natural Flavors
Fruit & Vegetable Ingredients
Starch & Sweeteners
Flours
Malt
Others
By Application
Beverages
Dairy & Frozen Desserts
Bakery
Prepared Food/Ready Meals & Processed Foods
Cereals & Snacks
Others
Chapter 8. Global Food Clean Label Ingredients Regional Analysis and Outlook
8.1. Global Food Clean Label Ingredients Revenue (USD Million) By Regions (2021- 2032)
8.2. North America Food Clean Label Ingredients Revenue (USD Million) by Country (2021-2032)
8.2.1. United States Food Clean Label Ingredients Regional Analysis and Outlook
8.2.2. Canada Food Clean Label Ingredients Regional Analysis and Outlook
8.2.3. Mexico Food Clean Label Ingredients Regional Analysis and Outlook
8.3. Europe Food Clean Label Ingredients Revenue (USD Million), by Country (2021-2032)
8.3.1. Germany Food Clean Label Ingredients Regional Analysis and Outlook
8.3.2. France Food Clean Label Ingredients Regional Analysis and Outlook
8.3.3. United Kingdom Food Clean Label Ingredients Regional Analysis and Outlook
8.3.4. Spain Food Clean Label Ingredients Regional Analysis and Outlook
8.3.5. Italy Food Clean Label Ingredients Regional Analysis and Outlook
8.3.6. Russia Food Clean Label Ingredients Regional Analysis and Outlook
8.3.7. Rest of Europe Food Clean Label Ingredients Regional Analysis and Outlook
8.4. Asia Pacific Food Clean Label Ingredients Revenue (USD Million) by Country (2021-2032)
8.4.1. China Food Clean Label Ingredients Regional Analysis and Outlook
8.4.2. Japan Food Clean Label Ingredients Regional Analysis and Outlook
8.4.3. India Food Clean Label Ingredients Regional Analysis and Outlook
8.4.4. South Korea Food Clean Label Ingredients Regional Analysis and Outlook
8.4.5. Australia Food Clean Label Ingredients Regional Analysis and Outlook
8.4.6. South East Asia Food Clean Label Ingredients Regional Analysis and Outlook
8.4.7. Rest of Asia Pacific Food Clean Label Ingredients Regional Analysis and Outlook
8.5. South America Food Clean Label Ingredients Revenue (USD Million), by Country (2021-2032)
8.5.1. Brazil Food Clean Label Ingredients Regional Analysis and Outlook
8.5.2. Argentina Food Clean Label Ingredients Regional Analysis and Outlook
8.5.3. Rest of South America Food Clean Label Ingredients Regional Analysis and Outlook
8.6. Middle East and Africa Food Clean Label Ingredients Revenue (USD Million) by Country (2021-2032)
8.6.1. Middle East Food Clean Label Ingredients Regional Analysis and Outlook
8.6.2. Africa Food Clean Label Ingredients Regional Analysis and Outlook
Chapter 9. North America Food Clean Label Ingredients Analysis and Outlook
9.1. North America Food Clean Label Ingredients Revenue (USD Million) by Segments (2021-2032)
9.1.1. North America Food Clean Label Ingredients Revenue (USD Million) by Type (2021-2032)
9.1.2. North America Food Clean Label Ingredients Revenue (USD Million) by Application (2021-2032)
9.1.3. North America Food Clean Label Ingredients Revenue (USD Million) by Product (2021-2032)
By Type
Natural Colors
Natural Flavors
Fruit & Vegetable Ingredients
Starch & Sweeteners
Flours
Malt
Others
By Application
Beverages
Dairy & Frozen Desserts
Bakery
Prepared Food/Ready Meals & Processed Foods
Cereals & Snacks
Others
Chapter 10. Europe Food Clean Label Ingredients Analysis and Outlook
10.1. Europe Food Clean Label Ingredients Revenue (USD Million), by Segments (USD Million) (2021-2032)
10.1.1. Europe Food Clean Label Ingredients Revenue (USD Million) by Type (2021-2032)
10.1.2. Europe Food Clean Label Ingredients Revenue (USD Million) by Application (2021-2032)
10.1.3. Europe Food Clean Label Ingredients Revenue (USD Million) by Product (2021-2032)
By Type
Natural Colors
Natural Flavors
Fruit & Vegetable Ingredients
Starch & Sweeteners
Flours
Malt
Others
By Application
Beverages
Dairy & Frozen Desserts
Bakery
Prepared Food/Ready Meals & Processed Foods
Cereals & Snacks
Others
Chapter 11. Asia Pacific Food Clean Label Ingredients Analysis and Outlook
11.1. Asia Pacific Food Clean Label Ingredients Revenue (USD Million), and Revenue (USD Million) by Segments (2021-2032)
11.1.1. Asia Pacific Food Clean Label Ingredients Revenue (USD Million) by Type (2021-2032)
11.1.2. Asia Pacific Food Clean Label Ingredients Revenue (USD Million) by Application (2021-2032)
11.1.3. Asia Pacific Food Clean Label Ingredients Revenue (USD Million) by Product (2021-2032)
By Type
Natural Colors
Natural Flavors
Fruit & Vegetable Ingredients
Starch & Sweeteners
Flours
Malt
Others
By Application
Beverages
Dairy & Frozen Desserts
Bakery
Prepared Food/Ready Meals & Processed Foods
Cereals & Snacks
Others
Chapter 12. South America Food Clean Label Ingredients Analysis and Outlook
12.1. South America Food Clean Label Ingredients Revenue (USD Million), by Segments (2021-2032)
12.1.1. South America Food Clean Label Ingredients Revenue (USD Million) by Type (2021-2032)
12.1.2. South America Food Clean Label Ingredients Revenue (USD Million) by Application (2021-2032)
12.1.3. South America Food Clean Label Ingredients Revenue (USD Million) by Product (2021-2032)
By Type
Natural Colors
Natural Flavors
Fruit & Vegetable Ingredients
Starch & Sweeteners
Flours
Malt
Others
By Application
Beverages
Dairy & Frozen Desserts
Bakery
Prepared Food/Ready Meals & Processed Foods
Cereals & Snacks
Others
Chapter 13. Middle East and Africa Food Clean Label Ingredients Analysis and Outlook
13.1. Middle East and Africa Food Clean Label Ingredients Revenue (USD Million), by Segments (2021-2032)
13.1.1. Middle East and Africa Food Clean Label Ingredients Revenue (USD Million) by Type (2021-2032)
13.1.2. Middle East and Africa Food Clean Label Ingredients Revenue (USD Million) by Application (2021-2032)
13.1.3. Middle East and Africa Food Clean Label Ingredients Revenue (USD Million) by Product (2021-2032)
By Type
Natural Colors
Natural Flavors
Fruit & Vegetable Ingredients
Starch & Sweeteners
Flours
Malt
Others
By Application
Beverages
Dairy & Frozen Desserts
Bakery
Prepared Food/Ready Meals & Processed Foods
Cereals & Snacks
Others
Chapter 14. Food Clean Label Ingredients Company Profiles
14.1 Business Overview
14.2 Product Profiles
14.3 SWOT Profiles
14.5 Recent Developments
14.6 Financial Profile
List of Companies
Archer Daniels Midland Company (ADM)
Brisan
Cargill Inc
Chr. Hansen A/S
Corbion N.V.
DuPont de Nemours Inc
Groupe Limagrain
Ingredion Inc
Kerry Group PLC
Koninklijke DSM N.V.
Sensient Technologies Corp
Tate & Lyle PLC
15. Methodology and Data Sources
15.1 Customization Offerings
15.2 Subscription Services
15.3 Related Reports
15.4 Publisher Expertise
LIST OF TABLES
Table 1 Market Segmentation Analysis
Table 2 Global Food Clean Label Ingredients Market Share of Leading Companies, 2023
Table 3 Product Offerings of Leading Companies
Table 4 Low Growth Scenario Forecasts
Table 5 Reference Case Growth Scenario
Table 6 High Growth Case Scenario
Table 7 Global Food Clean Label Ingredients Revenue (USD Million) And CAGR (%) By Type (2021-2032)
Table 8 Global Food Clean Label Ingredients Revenue (USD Million) And CAGR (%) By Application (2021-2032)
Table 9 Global Food Clean Label Ingredients Revenue (USD Million) And CAGR (%) By Product (2021-2032)
Table 10 Global Food Clean Label Ingredients Market Revenue (USD Million) By Regions (2021-2032)
Table 11 Global Food Clean Label Ingredients Market Share (%) By Regions (2021-2032)
Table 12 North America Food Clean Label Ingredients Revenue (USD Million) By Country (2021-2032)
Table 13 Europe Food Clean Label Ingredients Revenue (USD Million) By Country (2021-2032)
Table 14 Asia Pacific Food Clean Label Ingredients Revenue (USD Million) By Country (2021-2032)
Table 15 South America Food Clean Label Ingredients Revenue (USD Million) By Country (2021-2032)
Table 16 Middle East and Africa Food Clean Label Ingredients Revenue (USD Million) By Region (2021-2032)
Table 17 North America Food Clean Label Ingredients Revenue (USD Million) By Type (2021-2032)
Table 18 North America Food Clean Label Ingredients Revenue (USD Million) By Application (2021-2032)
Table 19 North America Food Clean Label Ingredients Revenue (USD Million) By Product (2021-2032)
Table 20 Europe Food Clean Label Ingredients Revenue (USD Million) By Type (2021-2032)
Table 21 Europe Food Clean Label Ingredients Revenue (USD Million) By Application (2021-2032)
Table 22 Europe Food Clean Label Ingredients Revenue (USD Million) By Product (2021-2032)
Table 23 Asia Pacific Food Clean Label Ingredients Revenue (USD Million) By Type (2021-2032)
Table 24 Asia Pacific Food Clean Label Ingredients Revenue (USD Million) By Application (2021-2032)
Table 25 Asia Pacific Food Clean Label Ingredients Revenue (USD Million) By Product (2021-2032)
Table 26 South America Food Clean Label Ingredients Revenue (USD Million) By Type (2021-2032)
Table 27 South America Food Clean Label Ingredients Revenue (USD Million) By Application (2021-2032)
Table 28 South America Food Clean Label Ingredients Revenue (USD Million) By Product (2021-2032)
Table 29 Middle East and Africa Food Clean Label Ingredients Revenue (USD Million) By Type (2021-2032)
Table 30 Middle East and Africa Food Clean Label Ingredients Revenue (USD Million) By Application (2021-2032)
Table 31 Middle East and Africa Food Clean Label Ingredients Revenue (USD Million) By Product (2021-2032)
LIST OF FIGURES
Figure 1. Market Scope
Figure 2. Pricing Forecasts Per Unit, 2023- 2032
Figure 3. Porter’s Five Forces
Figure 4. Global Food Clean Label Ingredients Market Revenue (USD Million) By Regions (2021-2032)
Figure 5. Global Food Clean Label Ingredients Market Share (%) By Regions (2023)
Figure 6. North America Food Clean Label Ingredients Revenue (USD Million) By Country (2021-2032)
Figure 7. United States Food Clean Label Ingredients Revenue (USD Million) By Country (2021-2032)
Figure 8. Canada Food Clean Label Ingredients Revenue (USD Million) By Country (2021-2032)
Figure 9. Mexico Food Clean Label Ingredients Revenue (USD Million) By Country (2021-2032)
Figure 10. Europe Food Clean Label Ingredients Revenue (USD Million) By Country (2021-2032)
Figure 11. Germany Food Clean Label Ingredients Revenue (USD Million) By Country (2021-2032)
Figure 12. France Food Clean Label Ingredients Revenue (USD Million) By Country (2021-2032)
Figure 13. United Kingdom Food Clean Label Ingredients Revenue (USD Million) By Country (2021-2032)
Figure 14. Spain Food Clean Label Ingredients Revenue (USD Million) By Country (2021-2032)
Figure 15. Italy Food Clean Label Ingredients Revenue (USD Million) By Country (2021-2032)
Figure 16. Russia Food Clean Label Ingredients Revenue (USD Million) By Country (2021-2032)
Figure 17. Rest of Europe Food Clean Label Ingredients Revenue (USD Million) By Country (2021-2032)
Figure 11. Asia Pacific Food Clean Label Ingredients Revenue (USD Million) By Country (2021-2032)
Figure 12. China Food Clean Label Ingredients Revenue (USD Million) By Country (2021-2032)
Figure 13. Japan Food Clean Label Ingredients Revenue (USD Million) By Country (2021-2032)
Figure 14. India Food Clean Label Ingredients Revenue (USD Million) By Country (2021-2032)
Figure 15. South Korea Food Clean Label Ingredients Revenue (USD Million) By Country (2021-2032)
Figure 16. Australia Food Clean Label Ingredients Revenue (USD Million) By Country (2021-2032)
Figure 17. South East Asia Food Clean Label Ingredients Revenue (USD Million) By Country (2021-2032)
Figure 18. South America Food Clean Label Ingredients Revenue (USD Million) By Country (2021-2032)
Figure 19. Brazil Food Clean Label Ingredients Revenue (USD Million) By Country (2021-2032)
Figure 20. Argentina Food Clean Label Ingredients Revenue (USD Million) By Country (2021-2032)
Figure 21. Rest of Asia Pacific Food Clean Label Ingredients Revenue (USD Million) By Country (2021-2032)
Figure 22. Middle East and Africa Food Clean Label Ingredients Revenue (USD Million) By Region (2021-2032)
Figure 23. Saudi Arabia Food Clean Label Ingredients Revenue (USD Million) By Region (2021-2032)
Figure 24. The UAE Food Clean Label Ingredients Revenue (USD Million) By Region (2021-2032)
Figure 25. Rest of Middle East Food Clean Label Ingredients Revenue (USD Million) By Region (2021-2032)
Figure 26. South Africa Food Clean Label Ingredients Revenue (USD Million) By Region (2021-2032)
Figure 27. Africa Food Clean Label Ingredients Revenue (USD Million) By Region (2021-2032)
Figure 28. North America Food Clean Label Ingredients Revenue (USD Million) By Type (2021-2032)
Figure 29. North America Food Clean Label Ingredients Revenue (USD Million) By Application (2021-2032)
Figure 30. North America Food Clean Label Ingredients Revenue (USD Million) By Product (2021-2032)
Figure 31. Europe Food Clean Label Ingredients Revenue (USD Million) By Type (2021-2032)
Figure 32. Europe Food Clean Label Ingredients Revenue (USD Million) By Application (2021-2032)
Figure 33. Europe Food Clean Label Ingredients Revenue (USD Million) By Product (2021-2032)
Figure 34. Asia Pacific Food Clean Label Ingredients Revenue (USD Million) By Type (2021-2032)
Figure 35. Asia Pacific Food Clean Label Ingredients Revenue (USD Million) By Application (2021-2032)
Figure 36. Asia Pacific Food Clean Label Ingredients Revenue (USD Million) By Product (2021-2032)
Figure 37. South America Food Clean Label Ingredients Revenue (USD Million) By Type (2021-2032)
Figure 38. South America Food Clean Label Ingredients Revenue (USD Million) By Application (2021-2032)
Figure 39. South America Food Clean Label Ingredients Revenue (USD Million) By Product (2021-2032)
Figure 40. Middle East and Africa Food Clean Label Ingredients Revenue (USD Million) By Type (2021-2032)
Figure 41. Middle East and Africa Food Clean Label Ingredients Revenue (USD Million) By Application (2021-2032)
Figure 42. Middle East and Africa Food Clean Label Ingredients Revenue (USD Million) By Product (2021-2032)
By Type
Natural Colors
Natural Flavors
Fruit & Vegetable Ingredients
Starch & Sweeteners
Flours
Malt
Others
By Application
Beverages
Dairy & Frozen Desserts
Bakery
Prepared Food/Ready Meals & Processed Foods
Cereals & Snacks
Others
Countries Analyzed
North America (US, Canada, Mexico)
Europe (Germany, UK, France, Spain, Italy, Russia, Rest of Europe)
Asia Pacific (China, India, Japan, South Korea, Australia, South East Asia, Rest of Asia)
South America (Brazil, Argentina, Rest of South America)
Middle East and Africa (Saudi Arabia, UAE, Rest of Middle East, South Africa, Egypt, Rest of Africa)
