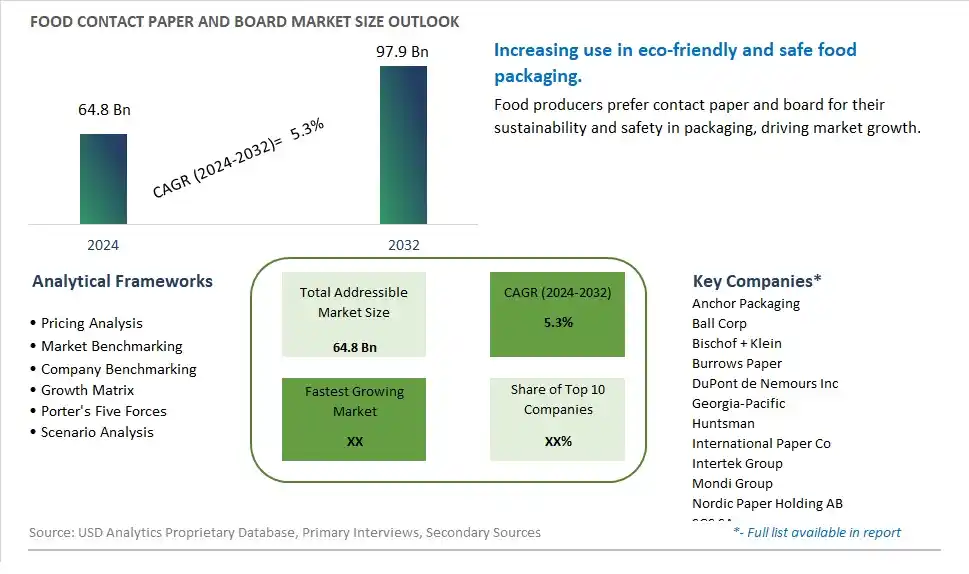
Global Food Contact Paper and Board Market Size is valued at $64.8 Billion in 2024 and is forecast to register a growth rate (CAGR) of 5.3% to reach $97.9 Billion by 2032.
The global Food Contact Paper and Board Market Comprehensive Study analyzes and forecasts the market size across 6 regions and 24 countries for diverse segments -By Type (Poly Coated Paper and Board, Non-Poly Coated Paper and Board), By Application (Bakery, Confectionery, Pasta and Noodles, Dairy Products, Fruits and Vegetables, Meat, Fish and Poultry, Snacks and Side Dishes, Others)
An Introduction to Food Contact Paper and Board Market
The Food Contact Paper and Board market in 2024 is witnessing robust growth, driven by the increasing demand for sustainable and safe packaging solutions. Food contact paper and board, used for packaging, wrapping, and serving food products, are essential for maintaining food safety and quality. The market benefits from advancements in paper and board manufacturing technologies, the growing trend of eco-friendly and recyclable packaging, and the expansion of the foodservice and takeaway sectors. Additionally, the rising awareness of the environmental impact of packaging materials is driving market growth.
Food Contact Paper and Board Competitive Landscape
The market report analyses the leading companies in the industry including Anchor Packaging, Ball Corp, Bischof + Klein, Burrows Paper, DuPont de Nemours Inc, Georgia-Pacific, Huntsman, International Paper Co, Intertek Group, Mondi Group, Nordic Paper Holding AB, SGS SA, Sharp Packaging, and Others.
Food Contact Paper and Board Market Dynamics
Food Contact Paper and Board Market Trend: Shift Towards Sustainable and Eco-Friendly Packaging Solutions
One prominent trend in the food contact paper and board market is the shift towards sustainable and eco-friendly packaging solutions. With increasing environmental concerns and consumer demand for greener alternatives, food manufacturers and packaging companies are transitioning from conventional plastic packaging to paper and board materials that are recyclable, compostable, and biodegradable. This trend is driven by regulatory initiatives, corporate sustainability goals, and consumer preferences for environmentally responsible packaging options. Food contact paper and board offer a sustainable packaging solution that reduces plastic waste, promotes recycling efforts, and aligns with circular economy principles, making them a preferred choice in the evolving packaging landscape.
Food Contact Paper and Board Market Driver: Regulatory Compliance and Food Safety Standards
A key driver propelling the food contact paper and board market is regulatory compliance and adherence to food safety standards. Regulatory agencies worldwide impose strict regulations and guidelines on packaging materials intended for direct contact with food to ensure product safety, hygiene, and consumer protection. Food contact paper and board must meet stringent requirements regarding material composition, chemical migration limits, and contamination risks to obtain regulatory approvals and certifications. The driver behind this trend is the need for packaging manufacturers to invest in research, testing, and quality control measures to ensure compliance with regulatory standards and gain consumer trust in the safety and reliability of food contact packaging materials.
Food Contact Paper and Board Market Opportunity: Innovation in Functional and Barrier Properties
A significant opportunity in the food contact paper and board market lies in innovation in functional and barrier properties to enhance packaging performance and meet diverse food packaging needs. Manufacturers can capitalize on this opportunity by developing paper and board materials with improved moisture resistance, grease resistance, oxygen barrier properties, and shelf-life extension capabilities to preserve food freshness and quality. Additionally, there's potential for incorporating functional coatings, such as biodegradable barriers, antimicrobial agents, or heat-sealable films, to enhance packaging functionality, convenience, and food protection. By investing in research and development of innovative packaging solutions, companies can address market demands for enhanced performance, sustainability, and safety in food contact paper and board packaging, driving growth and competitiveness in the industry.
Food Contact Paper and Board Market Share Analysis: Poly Coated Paper and Board segment generated the highest revenue share in the industry
In the Food Contact Paper and Board Market, the Poly Coated Paper and Board segment stands out as the largest. Poly coated paper and board are widely used in packaging applications due to their excellent barrier properties against moisture, grease, and other contaminants. This type of packaging material is essential for preserving the quality and freshness of food products, especially those that are sensitive to moisture or require extended shelf life. Poly coated paper and board are extensively utilized across various segments of the food industry, including fast food packaging, takeaway containers, and dry food packaging. Their versatility and protective capabilities make them a preferred choice for ensuring food safety and maintaining product integrity during storage and transportation.
Food Contact Paper and Board Market Share Analysis: Bakery Application is the fastest growing segment over the forecast period to 2032
Among the applications in the Food Contact Paper and Board Market, the Bakery segment exhibits the fastest growth trajectory leading up to 2032. The demand for food contact paper and board in bakery applications is driven by the increasing consumption of baked goods globally and the growing preference for convenient, on-the-go food options. Bakery products require packaging that not only protects the freshness and texture of items like bread, pastries, and cakes but also enhances their visual appeal on retail shelves. Poly coated paper and board are particularly favored in bakery packaging due to their ability to maintain product quality, resist grease absorption, and provide an attractive presentation for consumers. As consumer lifestyles evolve, with a greater emphasis on convenience and hygiene, the bakery segment is expected to continue driving the demand for food contact paper and board materials.
Food Contact Paper and Board Market Segmentation
By Type
Poly Coated Paper and Board
Non-Poly Coated Paper and Board
By Application
Bakery
Confectionery
Pasta and Noodles
Dairy Products
Fruits and Vegetables
Meat, Fish and Poultry
Snacks and Side Dishes
Others
Countries Analyzed
North America (US, Canada, Mexico)
Europe (Germany, UK, France, Spain, Italy, Russia, Rest of Europe)
Asia Pacific (China, India, Japan, South Korea, Australia, South East Asia, Rest of Asia)
South America (Brazil, Argentina, Rest of South America)
Middle East and Africa (Saudi Arabia, UAE, Rest of Middle East, South Africa, Egypt, Rest of Africa)
Food Contact Paper and Board Companies Profiled in the Study
Anchor Packaging
Ball Corp
Bischof + Klein
Burrows Paper
DuPont de Nemours Inc
Georgia-Pacific
Huntsman
International Paper Co
Intertek Group
Mondi Group
Nordic Paper Holding AB
SGS SA
Sharp Packaging
*- List Not Exhaustive
Chapter 1. TABLE OF CONTENTS
Chapter 2. Introduction to Food Contact Paper and Board Market
2.1. Market Overview
2.2. Key Statistics and Report Highlights
2.3. Scope of the Comprehensive Study
2.3.1. Market Definition
2.3.2 Countries and Regions Covered
2.3.3 Research Objective
2.3.4 Units, Currency, and Conversions
2.3.5 Industry Value Chain
2.4. Key Market Segments
2.5. Key Companies
2.6. Study Period
Chapter 3. Strategic Analysis Review
3.1. Food Contact Paper and Board Pricing Analysis and Forecast
3.2. Porter’s Five Forces
3.3. Market Ecosystem
3.4. SWOT Analysis
3.5. Regulatory Scenario
3.3. Effects of Inflation, Russia-Ukraine War, moderating economic growth, and other macroeconomic factors
Chapter 4. Competitive Landscape
4.1. Market Share Analysis
4.1.1. Global Food Contact Paper and Board Market Share by Company, 2023
4.1.2. Product Offerings of Leading Food Contact Paper and Board Companies
4.2. Market Entropy
4.2.1. New Product Launches in the Industry
4.2.2. Mergers, Acquisitions, Joint ventures, and Partnerships
4.3. Key Strategies and Best Practices
Chapter 5. Global Market Projections: Best, Reference, and Low Case Scenarios
5.1. Growth Analysis- Case Scenario Definitions
5.2. Low Growth Case Scenario Forecasts
5.3. Reference Growth Case Scenario Forecasts
5.4. High Growth Case Scenario Forecasts
Chapter 6. Market Dynamics
6.1. Food Contact Paper and Board Market Drivers
6.2. Food Contact Paper and Board Market Challenges
6.6. Food Contact Paper and Board Market Opportunities
6.4. Food Contact Paper and Board Market Trends
Chapter 7. Global Food Contact Paper and Board Market Outlook Trends
7.1. Global Food Contact Paper and Board Revenue (USD Million) and CAGR (%) by Type (2021-2032)
7.2. Global Food Contact Paper and Board Revenue (USD Million) and CAGR (%) by Application (2021-2032)
7.3. Global Food Contact Paper and Board Revenue (USD Million) and CAGR (%) by Product (2021-2032)
By Type
Poly Coated Paper and Board
Non-Poly Coated Paper and Board
By Application
Bakery
Confectionery
Pasta and Noodles
Dairy Products
Fruits and Vegetables
Meat, Fish and Poultry
Snacks and Side Dishes
Others
Chapter 8. Global Food Contact Paper and Board Regional Analysis and Outlook
8.1. Global Food Contact Paper and Board Revenue (USD Million) By Regions (2021- 2032)
8.2. North America Food Contact Paper and Board Revenue (USD Million) by Country (2021-2032)
8.2.1. United States Food Contact Paper and Board Regional Analysis and Outlook
8.2.2. Canada Food Contact Paper and Board Regional Analysis and Outlook
8.2.3. Mexico Food Contact Paper and Board Regional Analysis and Outlook
8.3. Europe Food Contact Paper and Board Revenue (USD Million), by Country (2021-2032)
8.3.1. Germany Food Contact Paper and Board Regional Analysis and Outlook
8.3.2. France Food Contact Paper and Board Regional Analysis and Outlook
8.3.3. United Kingdom Food Contact Paper and Board Regional Analysis and Outlook
8.3.4. Spain Food Contact Paper and Board Regional Analysis and Outlook
8.3.5. Italy Food Contact Paper and Board Regional Analysis and Outlook
8.3.6. Russia Food Contact Paper and Board Regional Analysis and Outlook
8.3.7. Rest of Europe Food Contact Paper and Board Regional Analysis and Outlook
8.4. Asia Pacific Food Contact Paper and Board Revenue (USD Million) by Country (2021-2032)
8.4.1. China Food Contact Paper and Board Regional Analysis and Outlook
8.4.2. Japan Food Contact Paper and Board Regional Analysis and Outlook
8.4.3. India Food Contact Paper and Board Regional Analysis and Outlook
8.4.4. South Korea Food Contact Paper and Board Regional Analysis and Outlook
8.4.5. Australia Food Contact Paper and Board Regional Analysis and Outlook
8.4.6. South East Asia Food Contact Paper and Board Regional Analysis and Outlook
8.4.7. Rest of Asia Pacific Food Contact Paper and Board Regional Analysis and Outlook
8.5. South America Food Contact Paper and Board Revenue (USD Million), by Country (2021-2032)
8.5.1. Brazil Food Contact Paper and Board Regional Analysis and Outlook
8.5.2. Argentina Food Contact Paper and Board Regional Analysis and Outlook
8.5.3. Rest of South America Food Contact Paper and Board Regional Analysis and Outlook
8.6. Middle East and Africa Food Contact Paper and Board Revenue (USD Million) by Country (2021-2032)
8.6.1. Middle East Food Contact Paper and Board Regional Analysis and Outlook
8.6.2. Africa Food Contact Paper and Board Regional Analysis and Outlook
Chapter 9. North America Food Contact Paper and Board Analysis and Outlook
9.1. North America Food Contact Paper and Board Revenue (USD Million) by Segments (2021-2032)
9.1.1. North America Food Contact Paper and Board Revenue (USD Million) by Type (2021-2032)
9.1.2. North America Food Contact Paper and Board Revenue (USD Million) by Application (2021-2032)
9.1.3. North America Food Contact Paper and Board Revenue (USD Million) by Product (2021-2032)
By Type
Poly Coated Paper and Board
Non-Poly Coated Paper and Board
By Application
Bakery
Confectionery
Pasta and Noodles
Dairy Products
Fruits and Vegetables
Meat, Fish and Poultry
Snacks and Side Dishes
Others
Chapter 10. Europe Food Contact Paper and Board Analysis and Outlook
10.1. Europe Food Contact Paper and Board Revenue (USD Million), by Segments (USD Million) (2021-2032)
10.1.1. Europe Food Contact Paper and Board Revenue (USD Million) by Type (2021-2032)
10.1.2. Europe Food Contact Paper and Board Revenue (USD Million) by Application (2021-2032)
10.1.3. Europe Food Contact Paper and Board Revenue (USD Million) by Product (2021-2032)
By Type
Poly Coated Paper and Board
Non-Poly Coated Paper and Board
By Application
Bakery
Confectionery
Pasta and Noodles
Dairy Products
Fruits and Vegetables
Meat, Fish and Poultry
Snacks and Side Dishes
Others
Chapter 11. Asia Pacific Food Contact Paper and Board Analysis and Outlook
11.1. Asia Pacific Food Contact Paper and Board Revenue (USD Million), and Revenue (USD Million) by Segments (2021-2032)
11.1.1. Asia Pacific Food Contact Paper and Board Revenue (USD Million) by Type (2021-2032)
11.1.2. Asia Pacific Food Contact Paper and Board Revenue (USD Million) by Application (2021-2032)
11.1.3. Asia Pacific Food Contact Paper and Board Revenue (USD Million) by Product (2021-2032)
By Type
Poly Coated Paper and Board
Non-Poly Coated Paper and Board
By Application
Bakery
Confectionery
Pasta and Noodles
Dairy Products
Fruits and Vegetables
Meat, Fish and Poultry
Snacks and Side Dishes
Others
Chapter 12. South America Food Contact Paper and Board Analysis and Outlook
12.1. South America Food Contact Paper and Board Revenue (USD Million), by Segments (2021-2032)
12.1.1. South America Food Contact Paper and Board Revenue (USD Million) by Type (2021-2032)
12.1.2. South America Food Contact Paper and Board Revenue (USD Million) by Application (2021-2032)
12.1.3. South America Food Contact Paper and Board Revenue (USD Million) by Product (2021-2032)
By Type
Poly Coated Paper and Board
Non-Poly Coated Paper and Board
By Application
Bakery
Confectionery
Pasta and Noodles
Dairy Products
Fruits and Vegetables
Meat, Fish and Poultry
Snacks and Side Dishes
Others
Chapter 13. Middle East and Africa Food Contact Paper and Board Analysis and Outlook
13.1. Middle East and Africa Food Contact Paper and Board Revenue (USD Million), by Segments (2021-2032)
13.1.1. Middle East and Africa Food Contact Paper and Board Revenue (USD Million) by Type (2021-2032)
13.1.2. Middle East and Africa Food Contact Paper and Board Revenue (USD Million) by Application (2021-2032)
13.1.3. Middle East and Africa Food Contact Paper and Board Revenue (USD Million) by Product (2021-2032)
By Type
Poly Coated Paper and Board
Non-Poly Coated Paper and Board
By Application
Bakery
Confectionery
Pasta and Noodles
Dairy Products
Fruits and Vegetables
Meat, Fish and Poultry
Snacks and Side Dishes
Others
Chapter 14. Food Contact Paper and Board Company Profiles
14.1 Business Overview
14.2 Product Profiles
14.3 SWOT Profiles
14.5 Recent Developments
14.6 Financial Profile
List of Companies
Anchor Packaging
Ball Corp
Bischof + Klein
Burrows Paper
DuPont de Nemours Inc
Georgia-Pacific
Huntsman
International Paper Co
Intertek Group
Mondi Group
Nordic Paper Holding AB
SGS SA
Sharp Packaging
15. Methodology and Data Sources
15.1 Customization Offerings
15.2 Subscription Services
15.3 Related Reports
15.4 Publisher Expertise
LIST OF TABLES
Table 1 Market Segmentation Analysis
Table 2 Global Food Contact Paper and Board Market Share of Leading Companies, 2023
Table 3 Product Offerings of Leading Companies
Table 4 Low Growth Scenario Forecasts
Table 5 Reference Case Growth Scenario
Table 6 High Growth Case Scenario
Table 7 Global Food Contact Paper and Board Revenue (USD Million) And CAGR (%) By Type (2021-2032)
Table 8 Global Food Contact Paper and Board Revenue (USD Million) And CAGR (%) By Application (2021-2032)
Table 9 Global Food Contact Paper and Board Revenue (USD Million) And CAGR (%) By Product (2021-2032)
Table 10 Global Food Contact Paper and Board Market Revenue (USD Million) By Regions (2021-2032)
Table 11 Global Food Contact Paper and Board Market Share (%) By Regions (2021-2032)
Table 12 North America Food Contact Paper and Board Revenue (USD Million) By Country (2021-2032)
Table 13 Europe Food Contact Paper and Board Revenue (USD Million) By Country (2021-2032)
Table 14 Asia Pacific Food Contact Paper and Board Revenue (USD Million) By Country (2021-2032)
Table 15 South America Food Contact Paper and Board Revenue (USD Million) By Country (2021-2032)
Table 16 Middle East and Africa Food Contact Paper and Board Revenue (USD Million) By Region (2021-2032)
Table 17 North America Food Contact Paper and Board Revenue (USD Million) By Type (2021-2032)
Table 18 North America Food Contact Paper and Board Revenue (USD Million) By Application (2021-2032)
Table 19 North America Food Contact Paper and Board Revenue (USD Million) By Product (2021-2032)
Table 20 Europe Food Contact Paper and Board Revenue (USD Million) By Type (2021-2032)
Table 21 Europe Food Contact Paper and Board Revenue (USD Million) By Application (2021-2032)
Table 22 Europe Food Contact Paper and Board Revenue (USD Million) By Product (2021-2032)
Table 23 Asia Pacific Food Contact Paper and Board Revenue (USD Million) By Type (2021-2032)
Table 24 Asia Pacific Food Contact Paper and Board Revenue (USD Million) By Application (2021-2032)
Table 25 Asia Pacific Food Contact Paper and Board Revenue (USD Million) By Product (2021-2032)
Table 26 South America Food Contact Paper and Board Revenue (USD Million) By Type (2021-2032)
Table 27 South America Food Contact Paper and Board Revenue (USD Million) By Application (2021-2032)
Table 28 South America Food Contact Paper and Board Revenue (USD Million) By Product (2021-2032)
Table 29 Middle East and Africa Food Contact Paper and Board Revenue (USD Million) By Type (2021-2032)
Table 30 Middle East and Africa Food Contact Paper and Board Revenue (USD Million) By Application (2021-2032)
Table 31 Middle East and Africa Food Contact Paper and Board Revenue (USD Million) By Product (2021-2032)
LIST OF FIGURES
Figure 1. Market Scope
Figure 2. Pricing Forecasts Per Unit, 2023- 2032
Figure 3. Porter’s Five Forces
Figure 4. Global Food Contact Paper and Board Market Revenue (USD Million) By Regions (2021-2032)
Figure 5. Global Food Contact Paper and Board Market Share (%) By Regions (2023)
Figure 6. North America Food Contact Paper and Board Revenue (USD Million) By Country (2021-2032)
Figure 7. United States Food Contact Paper and Board Revenue (USD Million) By Country (2021-2032)
Figure 8. Canada Food Contact Paper and Board Revenue (USD Million) By Country (2021-2032)
Figure 9. Mexico Food Contact Paper and Board Revenue (USD Million) By Country (2021-2032)
Figure 10. Europe Food Contact Paper and Board Revenue (USD Million) By Country (2021-2032)
Figure 11. Germany Food Contact Paper and Board Revenue (USD Million) By Country (2021-2032)
Figure 12. France Food Contact Paper and Board Revenue (USD Million) By Country (2021-2032)
Figure 13. United Kingdom Food Contact Paper and Board Revenue (USD Million) By Country (2021-2032)
Figure 14. Spain Food Contact Paper and Board Revenue (USD Million) By Country (2021-2032)
Figure 15. Italy Food Contact Paper and Board Revenue (USD Million) By Country (2021-2032)
Figure 16. Russia Food Contact Paper and Board Revenue (USD Million) By Country (2021-2032)
Figure 17. Rest of Europe Food Contact Paper and Board Revenue (USD Million) By Country (2021-2032)
Figure 11. Asia Pacific Food Contact Paper and Board Revenue (USD Million) By Country (2021-2032)
Figure 12. China Food Contact Paper and Board Revenue (USD Million) By Country (2021-2032)
Figure 13. Japan Food Contact Paper and Board Revenue (USD Million) By Country (2021-2032)
Figure 14. India Food Contact Paper and Board Revenue (USD Million) By Country (2021-2032)
Figure 15. South Korea Food Contact Paper and Board Revenue (USD Million) By Country (2021-2032)
Figure 16. Australia Food Contact Paper and Board Revenue (USD Million) By Country (2021-2032)
Figure 17. South East Asia Food Contact Paper and Board Revenue (USD Million) By Country (2021-2032)
Figure 18. South America Food Contact Paper and Board Revenue (USD Million) By Country (2021-2032)
Figure 19. Brazil Food Contact Paper and Board Revenue (USD Million) By Country (2021-2032)
Figure 20. Argentina Food Contact Paper and Board Revenue (USD Million) By Country (2021-2032)
Figure 21. Rest of Asia Pacific Food Contact Paper and Board Revenue (USD Million) By Country (2021-2032)
Figure 22. Middle East and Africa Food Contact Paper and Board Revenue (USD Million) By Region (2021-2032)
Figure 23. Saudi Arabia Food Contact Paper and Board Revenue (USD Million) By Region (2021-2032)
Figure 24. The UAE Food Contact Paper and Board Revenue (USD Million) By Region (2021-2032)
Figure 25. Rest of Middle East Food Contact Paper and Board Revenue (USD Million) By Region (2021-2032)
Figure 26. South Africa Food Contact Paper and Board Revenue (USD Million) By Region (2021-2032)
Figure 27. Africa Food Contact Paper and Board Revenue (USD Million) By Region (2021-2032)
Figure 28. North America Food Contact Paper and Board Revenue (USD Million) By Type (2021-2032)
Figure 29. North America Food Contact Paper and Board Revenue (USD Million) By Application (2021-2032)
Figure 30. North America Food Contact Paper and Board Revenue (USD Million) By Product (2021-2032)
Figure 31. Europe Food Contact Paper and Board Revenue (USD Million) By Type (2021-2032)
Figure 32. Europe Food Contact Paper and Board Revenue (USD Million) By Application (2021-2032)
Figure 33. Europe Food Contact Paper and Board Revenue (USD Million) By Product (2021-2032)
Figure 34. Asia Pacific Food Contact Paper and Board Revenue (USD Million) By Type (2021-2032)
Figure 35. Asia Pacific Food Contact Paper and Board Revenue (USD Million) By Application (2021-2032)
Figure 36. Asia Pacific Food Contact Paper and Board Revenue (USD Million) By Product (2021-2032)
Figure 37. South America Food Contact Paper and Board Revenue (USD Million) By Type (2021-2032)
Figure 38. South America Food Contact Paper and Board Revenue (USD Million) By Application (2021-2032)
Figure 39. South America Food Contact Paper and Board Revenue (USD Million) By Product (2021-2032)
Figure 40. Middle East and Africa Food Contact Paper and Board Revenue (USD Million) By Type (2021-2032)
Figure 41. Middle East and Africa Food Contact Paper and Board Revenue (USD Million) By Application (2021-2032)
Figure 42. Middle East and Africa Food Contact Paper and Board Revenue (USD Million) By Product (2021-2032)
By Type
Poly Coated Paper and Board
Non-Poly Coated Paper and Board
By Application
Bakery
Confectionery
Pasta and Noodles
Dairy Products
Fruits and Vegetables
Meat, Fish and Poultry
Snacks and Side Dishes
Others
Countries Analyzed
North America (US, Canada, Mexico)
Europe (Germany, UK, France, Spain, Italy, Russia, Rest of Europe)
Asia Pacific (China, India, Japan, South Korea, Australia, South East Asia, Rest of Asia)
South America (Brazil, Argentina, Rest of South America)
Middle East and Africa (Saudi Arabia, UAE, Rest of Middle East, South Africa, Egypt, Rest of Africa)
