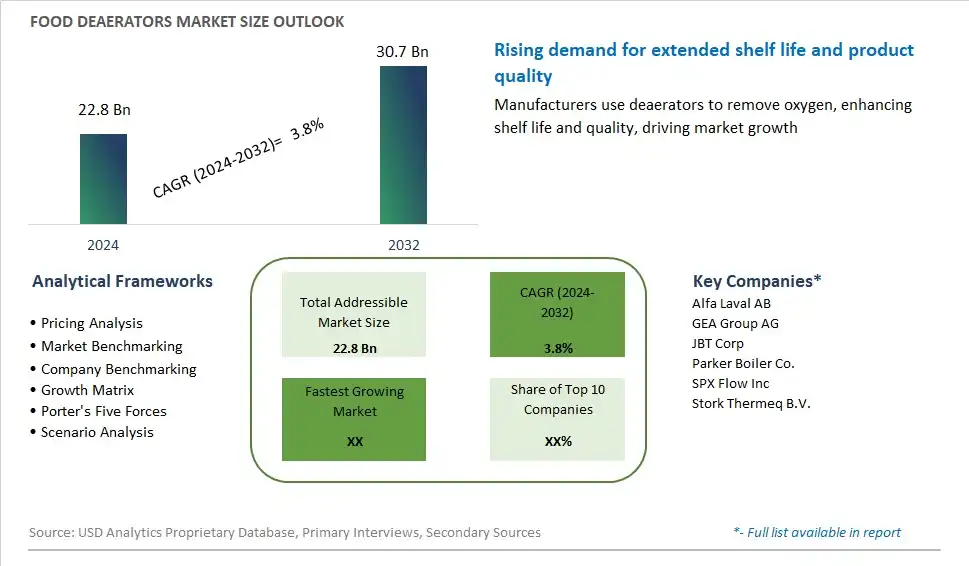
Global Food Deaerators Market Size is valued at $22.8 Billion in 2024 and is forecast to register a growth rate (CAGR) of 3.8% to reach $30.7 Billion by 2032.
The global Food Deaerators Market Comprehensive Study analyzes and forecasts the market size across 6 regions and 24 countries for diverse segments -By Type (Spray-Tray Type Deaerators, Spray Type Deaerators, Vacuum Type Deaerators), By Function (Oxygen Removal, Water Heating, Aroma & Flavor Retention, Others), By Application (Beverages, Food)
An Introduction to Food Deaerators Market
Food deaerators are specialized equipment used to remove dissolved gases, such as oxygen and carbon dioxide, from liquid food products to improve product quality and shelf life in 2024. Deaeration is an essential step in food processing, particularly in the production of beverages such as beer, juice, and dairy products, where dissolved gases can negatively impact taste, color, and stability. Deaeration systems utilize various techniques, including vacuum degassing, membrane filtration, and mechanical agitation, to efficiently remove gases from liquid streams while minimizing product loss and oxidation. With advancements in deaeration technology, such as multi-stage degassing, inert gas sparging, and inline deaeration, manufacturers can achieve precise control over dissolved gas levels and product characteristics, ensuring consistency and quality in their final products. Whether producing carbonated soft drinks, fruit juices, or dairy beverages, food manufacturers rely on deaeration systems to maintain product integrity and sensory attributes while extending shelf life and reducing the risk of spoilage. As consumer demand for fresh, natural, and preservative-free foods grows, the market for food deaerators is expected to expand, driven by investments in equipment upgrades, automation, and quality control measures that enhance product safety and stability.
Food Deaerators Competitive Landscape
The market report analyses the leading companies in the industry including Alfa Laval AB, GEA Group AG, JBT Corp, Parker Boiler Co., SPX Flow Inc, Stork Thermeq B.V., and Others.
Food Deaerators Market Dynamics
Food Deaerators Market Trend: Focus on Shelf-Life Extension and Quality Preservation
A prominent trend in the food deaerators market is the increasing emphasis on shelf-life extension and quality preservation of packaged food products. With consumers demanding fresher, longer-lasting foods and beverages, manufacturers are seeking solutions to prevent oxidative deterioration, flavor degradation, and spoilage caused by exposure to oxygen during processing, packaging, and storage. Deaerators play a crucial role in removing dissolved gases, primarily oxygen, from liquid and semi-liquid food products, thereby reducing the risk of oxidation and microbial growth. As food manufacturers prioritize the maintenance of product quality, safety, and sensory attributes throughout the supply chain, the adoption of deaeration technology continues to rise across various food and beverage categories, including juices, sauces, soups, dairy products, and condiments.
Market Driver: Increasing Demand for Premium and Functional Foods
A key driver propelling the growth of the food deaerators market is the rising consumer demand for premium and functional food products that offer superior quality, freshness, and nutritional value. As consumers become more health-conscious and discerning in their food choices, they are willing to pay a premium for foods and beverages that retain their natural flavors, colors, and nutrients while minimizing the need for artificial preservatives and additives. Deaerators enable manufacturers to enhance the sensory characteristics and nutritional integrity of their products by removing oxygen, which can cause oxidative reactions leading to flavor loss, color changes, and nutrient degradation. Moreover, deaeration helps maintain the visual appeal and texture of packaged foods, contributing to a positive consumer perception and increased product acceptance. The demand for deaerated products is further driven by the growing market for functional beverages, including sports drinks, energy drinks, and fortified waters, which require oxygen removal to prevent oxidation and maintain product stability and efficacy.
Market Opportunity: Expansion into Emerging Food Segments and Applications
An opportunity within the food deaerators market lies in the expansion into emerging food segments and applications, particularly in the plant-based and convenience food sectors. With the growing popularity of plant-based alternatives to traditional animal-derived foods, such as plant-based milks, yogurts, and meat substitutes, there is a need for deaeration solutions tailored to the unique characteristics and processing requirements of plant-based ingredients. Additionally, as consumers seek convenient, on-the-go food options, there is an opportunity to integrate deaeration technology into single-serve and ready-to-eat packaged foods, including salads, dips, dressings, and pre-cut fruits and vegetables. By addressing the specific deaeration needs of these emerging food categories, manufacturers can capitalize on shifting consumer preferences and market trends, expanding their product offerings and market presence in rapidly growing segments of the food industry.
Food Deaerators Market Share Analysis: Vacuum Type Deaerators held the dominant market share in 2024
In the Food Deaerators market segmented by Type, the Vacuum Type Deaerators segment is the largest category. This dominance is attributed to the widespread adoption of vacuum deaeration technology across various food processing applications due to its efficiency, reliability, and effectiveness in removing dissolved oxygen from liquid products. Vacuum deaerators utilize the principle of vacuum pressure to create a low-pressure environment, facilitating the release of dissolved gases, including oxygen, from liquids such as juices, sauces, soups, and dairy products. Further, vacuum deaeration preserves the sensory and nutritional qualities of food products by minimizing oxidation, microbial growth, and flavor degradation, ensuring product stability and quality throughout shelf life. Additionally, vacuum deaerators offer advantages such as continuous operation, minimal product loss, and easy integration into existing processing lines, making them preferred choices for food manufacturers seeking to optimize production efficiency and product quality. As food producers prioritize the preservation of product freshness, flavor integrity, and extended shelf life, the Vacuum Type Deaerators segment maintains its leadership position in the Food Deaerators market, driving growth and innovation to meet evolving industry demands.
Food Deaerators Market Share Analysis: Oxygen Removal Function market is poised to register the fastest growth rae over the forecast period to 2032
In the Food Deaerators market segmented by Function, the Oxygen Removal segment is the fastest-growing category. This accelerated growth is propelled by the increasing demand for oxygen removal solutions in food processing operations to enhance product stability, quality, and shelf life. Oxygen removal plays a crucial role in preventing oxidative reactions, microbial growth, and flavor deterioration in liquid food products such as juices, sauces, soups, and beverages. Additionally, oxygen removal extends the freshness and color retention of products, preserving their sensory attributes and nutritional value. Further, advancements in deaeration technology, including enhanced vacuum systems, membrane technologies, and inert gas injection methods, further improve the efficiency and effectiveness of oxygen removal processes, driving their widespread adoption across the food industry. As food manufacturers prioritize product freshness, shelf stability, and consumer satisfaction, the Oxygen Removal segment continues to witness rapid growth, underscoring its significance in ensuring product quality and integrity within the Food Deaerators market landscape.
Food Deaerators Market Share Analysis: Beverages Application held the dominant market share in 2024
In the Food Deaerators market segmented by Application, the Beverages segment is the largest category. This dominance is attributed to the critical role of deaeration in ensuring the quality and stability of beverages, particularly those sensitive to oxygen exposure. Beverages such as juices, soft drinks, beer, and wine are prone to oxidative reactions, which can lead to off-flavors, color changes, and reduced shelf life. Deaeration removes dissolved oxygen from beverages, preventing oxidation and preserving their sensory attributes and freshness. Additionally, deaeration enhances product stability, allowing beverages to maintain their quality and integrity throughout distribution and storage. Further, advancements in deaeration technology, such as vacuum deaeration systems and membrane contactors, offer efficient and cost-effective solutions to meet the oxygen removal needs of beverage manufacturers. As the beverage industry continues to innovate and diversify, the Beverages Application segment maintains its leadership position in the Food Deaerators market, driving growth and innovation to meet evolving industry demands.
Food Deaerators Market Segmentation
By Type
Spray-Tray Type Deaerators
Spray Type Deaerators
Vacuum Type Deaerators
By Function
Oxygen Removal
Water Heating
Aroma & Flavor Retention
Others
By Application
Beverages
Food
Countries Analyzed
North America (US, Canada, Mexico)
Europe (Germany, UK, France, Spain, Italy, Russia, Rest of Europe)
Asia Pacific (China, India, Japan, South Korea, Australia, South East Asia, Rest of Asia)
South America (Brazil, Argentina, Rest of South America)
Middle East and Africa (Saudi Arabia, UAE, Rest of Middle East, South Africa, Egypt, Rest of Africa)
Food Deaerators Companies Profiled in the Study
Alfa Laval AB
GEA Group AG
JBT Corp
Parker Boiler Co.
SPX Flow Inc
Stork Thermeq B.V.
*- List Not Exhaustive
Chapter 1. TABLE OF CONTENTS
Chapter 2. Introduction to Food Deaerators Market
2.1. Market Overview
2.2. Key Statistics and Report Highlights
2.3. Scope of the Comprehensive Study
2.3.1. Market Definition
2.3.2 Countries and Regions Covered
2.3.3 Research Objective
2.3.4 Units, Currency, and Conversions
2.3.5 Industry Value Chain
2.4. Key Market Segments
2.5. Key Companies
2.6. Study Period
Chapter 3. Strategic Analysis Review
3.1. Food Deaerators Pricing Analysis and Forecast
3.2. Porter’s Five Forces
3.3. Market Ecosystem
3.4. SWOT Analysis
3.5. Regulatory Scenario
3.3. Effects of Inflation, Russia-Ukraine War, moderating economic growth, and other macroeconomic factors
Chapter 4. Competitive Landscape
4.1. Market Share Analysis
4.1.1. Global Food Deaerators Market Share by Company, 2023
4.1.2. Product Offerings of Leading Food Deaerators Companies
4.2. Market Entropy
4.2.1. New Product Launches in the Industry
4.2.2. Mergers, Acquisitions, Joint ventures, and Partnerships
4.3. Key Strategies and Best Practices
Chapter 5. Global Market Projections: Best, Reference, and Low Case Scenarios
5.1. Growth Analysis- Case Scenario Definitions
5.2. Low Growth Case Scenario Forecasts
5.3. Reference Growth Case Scenario Forecasts
5.4. High Growth Case Scenario Forecasts
Chapter 6. Market Dynamics
6.1. Food Deaerators Market Drivers
6.2. Food Deaerators Market Challenges
6.6. Food Deaerators Market Opportunities
6.4. Food Deaerators Market Trends
Chapter 7. Global Food Deaerators Market Outlook Trends
7.1. Global Food Deaerators Revenue (USD Million) and CAGR (%) by Type (2021-2032)
7.2. Global Food Deaerators Revenue (USD Million) and CAGR (%) by Application (2021-2032)
7.3. Global Food Deaerators Revenue (USD Million) and CAGR (%) by Product (2021-2032)
By Type
Spray-Tray Type Deaerators
Spray Type Deaerators
Vacuum Type Deaerators
By Function
Oxygen Removal
Water Heating
Aroma & Flavor Retention
Others
By Application
Beverages
Food
Chapter 8. Global Food Deaerators Regional Analysis and Outlook
8.1. Global Food Deaerators Revenue (USD Million) By Regions (2021- 2032)
8.2. North America Food Deaerators Revenue (USD Million) by Country (2021-2032)
8.2.1. United States Food Deaerators Regional Analysis and Outlook
8.2.2. Canada Food Deaerators Regional Analysis and Outlook
8.2.3. Mexico Food Deaerators Regional Analysis and Outlook
8.3. Europe Food Deaerators Revenue (USD Million), by Country (2021-2032)
8.3.1. Germany Food Deaerators Regional Analysis and Outlook
8.3.2. France Food Deaerators Regional Analysis and Outlook
8.3.3. United Kingdom Food Deaerators Regional Analysis and Outlook
8.3.4. Spain Food Deaerators Regional Analysis and Outlook
8.3.5. Italy Food Deaerators Regional Analysis and Outlook
8.3.6. Russia Food Deaerators Regional Analysis and Outlook
8.3.7. Rest of Europe Food Deaerators Regional Analysis and Outlook
8.4. Asia Pacific Food Deaerators Revenue (USD Million) by Country (2021-2032)
8.4.1. China Food Deaerators Regional Analysis and Outlook
8.4.2. Japan Food Deaerators Regional Analysis and Outlook
8.4.3. India Food Deaerators Regional Analysis and Outlook
8.4.4. South Korea Food Deaerators Regional Analysis and Outlook
8.4.5. Australia Food Deaerators Regional Analysis and Outlook
8.4.6. South East Asia Food Deaerators Regional Analysis and Outlook
8.4.7. Rest of Asia Pacific Food Deaerators Regional Analysis and Outlook
8.5. South America Food Deaerators Revenue (USD Million), by Country (2021-2032)
8.5.1. Brazil Food Deaerators Regional Analysis and Outlook
8.5.2. Argentina Food Deaerators Regional Analysis and Outlook
8.5.3. Rest of South America Food Deaerators Regional Analysis and Outlook
8.6. Middle East and Africa Food Deaerators Revenue (USD Million) by Country (2021-2032)
8.6.1. Middle East Food Deaerators Regional Analysis and Outlook
8.6.2. Africa Food Deaerators Regional Analysis and Outlook
Chapter 9. North America Food Deaerators Analysis and Outlook
9.1. North America Food Deaerators Revenue (USD Million) by Segments (2021-2032)
9.1.1. North America Food Deaerators Revenue (USD Million) by Type (2021-2032)
9.1.2. North America Food Deaerators Revenue (USD Million) by Application (2021-2032)
9.1.3. North America Food Deaerators Revenue (USD Million) by Product (2021-2032)
By Type
Spray-Tray Type Deaerators
Spray Type Deaerators
Vacuum Type Deaerators
By Function
Oxygen Removal
Water Heating
Aroma & Flavor Retention
Others
By Application
Beverages
Food
Chapter 10. Europe Food Deaerators Analysis and Outlook
10.1. Europe Food Deaerators Revenue (USD Million), by Segments (USD Million) (2021-2032)
10.1.1. Europe Food Deaerators Revenue (USD Million) by Type (2021-2032)
10.1.2. Europe Food Deaerators Revenue (USD Million) by Application (2021-2032)
10.1.3. Europe Food Deaerators Revenue (USD Million) by Product (2021-2032)
By Type
Spray-Tray Type Deaerators
Spray Type Deaerators
Vacuum Type Deaerators
By Function
Oxygen Removal
Water Heating
Aroma & Flavor Retention
Others
By Application
Beverages
Food
Chapter 11. Asia Pacific Food Deaerators Analysis and Outlook
11.1. Asia Pacific Food Deaerators Revenue (USD Million), and Revenue (USD Million) by Segments (2021-2032)
11.1.1. Asia Pacific Food Deaerators Revenue (USD Million) by Type (2021-2032)
11.1.2. Asia Pacific Food Deaerators Revenue (USD Million) by Application (2021-2032)
11.1.3. Asia Pacific Food Deaerators Revenue (USD Million) by Product (2021-2032)
By Type
Spray-Tray Type Deaerators
Spray Type Deaerators
Vacuum Type Deaerators
By Function
Oxygen Removal
Water Heating
Aroma & Flavor Retention
Others
By Application
Beverages
Food
Chapter 12. South America Food Deaerators Analysis and Outlook
12.1. South America Food Deaerators Revenue (USD Million), by Segments (2021-2032)
12.1.1. South America Food Deaerators Revenue (USD Million) by Type (2021-2032)
12.1.2. South America Food Deaerators Revenue (USD Million) by Application (2021-2032)
12.1.3. South America Food Deaerators Revenue (USD Million) by Product (2021-2032)
By Type
Spray-Tray Type Deaerators
Spray Type Deaerators
Vacuum Type Deaerators
By Function
Oxygen Removal
Water Heating
Aroma & Flavor Retention
Others
By Application
Beverages
Food
Chapter 13. Middle East and Africa Food Deaerators Analysis and Outlook
13.1. Middle East and Africa Food Deaerators Revenue (USD Million), by Segments (2021-2032)
13.1.1. Middle East and Africa Food Deaerators Revenue (USD Million) by Type (2021-2032)
13.1.2. Middle East and Africa Food Deaerators Revenue (USD Million) by Application (2021-2032)
13.1.3. Middle East and Africa Food Deaerators Revenue (USD Million) by Product (2021-2032)
By Type
Spray-Tray Type Deaerators
Spray Type Deaerators
Vacuum Type Deaerators
By Function
Oxygen Removal
Water Heating
Aroma & Flavor Retention
Others
By Application
Beverages
Food
Chapter 14. Food Deaerators Company Profiles
14.1 Business Overview
14.2 Product Profiles
14.3 SWOT Profiles
14.5 Recent Developments
14.6 Financial Profile
List of Companies
Alfa Laval AB
GEA Group AG
JBT Corp
Parker Boiler Co.
SPX Flow Inc
Stork Thermeq B.V.
15. Methodology and Data Sources
15.1 Customization Offerings
15.2 Subscription Services
15.3 Related Reports
15.4 Publisher Expertise
LIST OF TABLES
Table 1 Market Segmentation Analysis
Table 2 Global Food Deaerators Market Share of Leading Companies, 2023
Table 3 Product Offerings of Leading Companies
Table 4 Low Growth Scenario Forecasts
Table 5 Reference Case Growth Scenario
Table 6 High Growth Case Scenario
Table 7 Global Food Deaerators Revenue (USD Million) And CAGR (%) By Type (2021-2032)
Table 8 Global Food Deaerators Revenue (USD Million) And CAGR (%) By Application (2021-2032)
Table 9 Global Food Deaerators Revenue (USD Million) And CAGR (%) By Product (2021-2032)
Table 10 Global Food Deaerators Market Revenue (USD Million) By Regions (2021-2032)
Table 11 Global Food Deaerators Market Share (%) By Regions (2021-2032)
Table 12 North America Food Deaerators Revenue (USD Million) By Country (2021-2032)
Table 13 Europe Food Deaerators Revenue (USD Million) By Country (2021-2032)
Table 14 Asia Pacific Food Deaerators Revenue (USD Million) By Country (2021-2032)
Table 15 South America Food Deaerators Revenue (USD Million) By Country (2021-2032)
Table 16 Middle East and Africa Food Deaerators Revenue (USD Million) By Region (2021-2032)
Table 17 North America Food Deaerators Revenue (USD Million) By Type (2021-2032)
Table 18 North America Food Deaerators Revenue (USD Million) By Application (2021-2032)
Table 19 North America Food Deaerators Revenue (USD Million) By Product (2021-2032)
Table 20 Europe Food Deaerators Revenue (USD Million) By Type (2021-2032)
Table 21 Europe Food Deaerators Revenue (USD Million) By Application (2021-2032)
Table 22 Europe Food Deaerators Revenue (USD Million) By Product (2021-2032)
Table 23 Asia Pacific Food Deaerators Revenue (USD Million) By Type (2021-2032)
Table 24 Asia Pacific Food Deaerators Revenue (USD Million) By Application (2021-2032)
Table 25 Asia Pacific Food Deaerators Revenue (USD Million) By Product (2021-2032)
Table 26 South America Food Deaerators Revenue (USD Million) By Type (2021-2032)
Table 27 South America Food Deaerators Revenue (USD Million) By Application (2021-2032)
Table 28 South America Food Deaerators Revenue (USD Million) By Product (2021-2032)
Table 29 Middle East and Africa Food Deaerators Revenue (USD Million) By Type (2021-2032)
Table 30 Middle East and Africa Food Deaerators Revenue (USD Million) By Application (2021-2032)
Table 31 Middle East and Africa Food Deaerators Revenue (USD Million) By Product (2021-2032)
LIST OF FIGURES
Figure 1. Market Scope
Figure 2. Pricing Forecasts Per Unit, 2023- 2032
Figure 3. Porter’s Five Forces
Figure 4. Global Food Deaerators Market Revenue (USD Million) By Regions (2021-2032)
Figure 5. Global Food Deaerators Market Share (%) By Regions (2023)
Figure 6. North America Food Deaerators Revenue (USD Million) By Country (2021-2032)
Figure 7. United States Food Deaerators Revenue (USD Million) By Country (2021-2032)
Figure 8. Canada Food Deaerators Revenue (USD Million) By Country (2021-2032)
Figure 9. Mexico Food Deaerators Revenue (USD Million) By Country (2021-2032)
Figure 10. Europe Food Deaerators Revenue (USD Million) By Country (2021-2032)
Figure 11. Germany Food Deaerators Revenue (USD Million) By Country (2021-2032)
Figure 12. France Food Deaerators Revenue (USD Million) By Country (2021-2032)
Figure 13. United Kingdom Food Deaerators Revenue (USD Million) By Country (2021-2032)
Figure 14. Spain Food Deaerators Revenue (USD Million) By Country (2021-2032)
Figure 15. Italy Food Deaerators Revenue (USD Million) By Country (2021-2032)
Figure 16. Russia Food Deaerators Revenue (USD Million) By Country (2021-2032)
Figure 17. Rest of Europe Food Deaerators Revenue (USD Million) By Country (2021-2032)
Figure 11. Asia Pacific Food Deaerators Revenue (USD Million) By Country (2021-2032)
Figure 12. China Food Deaerators Revenue (USD Million) By Country (2021-2032)
Figure 13. Japan Food Deaerators Revenue (USD Million) By Country (2021-2032)
Figure 14. India Food Deaerators Revenue (USD Million) By Country (2021-2032)
Figure 15. South Korea Food Deaerators Revenue (USD Million) By Country (2021-2032)
Figure 16. Australia Food Deaerators Revenue (USD Million) By Country (2021-2032)
Figure 17. South East Asia Food Deaerators Revenue (USD Million) By Country (2021-2032)
Figure 18. South America Food Deaerators Revenue (USD Million) By Country (2021-2032)
Figure 19. Brazil Food Deaerators Revenue (USD Million) By Country (2021-2032)
Figure 20. Argentina Food Deaerators Revenue (USD Million) By Country (2021-2032)
Figure 21. Rest of Asia Pacific Food Deaerators Revenue (USD Million) By Country (2021-2032)
Figure 22. Middle East and Africa Food Deaerators Revenue (USD Million) By Region (2021-2032)
Figure 23. Saudi Arabia Food Deaerators Revenue (USD Million) By Region (2021-2032)
Figure 24. The UAE Food Deaerators Revenue (USD Million) By Region (2021-2032)
Figure 25. Rest of Middle East Food Deaerators Revenue (USD Million) By Region (2021-2032)
Figure 26. South Africa Food Deaerators Revenue (USD Million) By Region (2021-2032)
Figure 27. Africa Food Deaerators Revenue (USD Million) By Region (2021-2032)
Figure 28. North America Food Deaerators Revenue (USD Million) By Type (2021-2032)
Figure 29. North America Food Deaerators Revenue (USD Million) By Application (2021-2032)
Figure 30. North America Food Deaerators Revenue (USD Million) By Product (2021-2032)
Figure 31. Europe Food Deaerators Revenue (USD Million) By Type (2021-2032)
Figure 32. Europe Food Deaerators Revenue (USD Million) By Application (2021-2032)
Figure 33. Europe Food Deaerators Revenue (USD Million) By Product (2021-2032)
Figure 34. Asia Pacific Food Deaerators Revenue (USD Million) By Type (2021-2032)
Figure 35. Asia Pacific Food Deaerators Revenue (USD Million) By Application (2021-2032)
Figure 36. Asia Pacific Food Deaerators Revenue (USD Million) By Product (2021-2032)
Figure 37. South America Food Deaerators Revenue (USD Million) By Type (2021-2032)
Figure 38. South America Food Deaerators Revenue (USD Million) By Application (2021-2032)
Figure 39. South America Food Deaerators Revenue (USD Million) By Product (2021-2032)
Figure 40. Middle East and Africa Food Deaerators Revenue (USD Million) By Type (2021-2032)
Figure 41. Middle East and Africa Food Deaerators Revenue (USD Million) By Application (2021-2032)
Figure 42. Middle East and Africa Food Deaerators Revenue (USD Million) By Product (2021-2032)
By Type
Spray-Tray Type Deaerators
Spray Type Deaerators
Vacuum Type Deaerators
By Function
Oxygen Removal
Water Heating
Aroma & Flavor Retention
Others
By Application
Beverages
Food
Countries Analyzed
North America (US, Canada, Mexico)
Europe (Germany, UK, France, Spain, Italy, Russia, Rest of Europe)
Asia Pacific (China, India, Japan, South Korea, Australia, South East Asia, Rest of Asia)
South America (Brazil, Argentina, Rest of South America)
Middle East and Africa (Saudi Arabia, UAE, Rest of Middle East, South Africa, Egypt, Rest of Africa)
