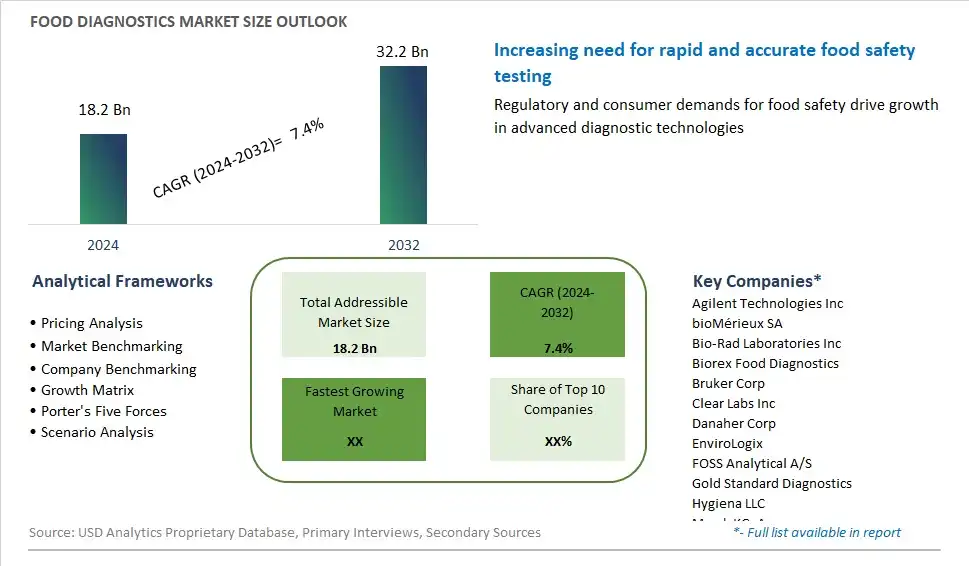
Global Food Diagnostics Market Size is valued at $18.2 Billion in 2024 and is forecast to register a growth rate (CAGR) of 7.4% to reach $32.2 Billion by 2032.
The global Food Diagnostics Market Comprehensive Study analyzes and forecasts the market size across 6 regions and 24 countries for diverse segments -By Type (Systems, Test Kits, Consumables), By Testing (Safety, Quality), By Site (Outsourcing Facility, Inhouse), By Food Tested (Meat, poultry, and seafood, Dairy products, Processed food, Fruits & vegetables, Cereals, Grains, Others)
An Introduction to Food Diagnostics Market
Food diagnostics involves the use of analytical techniques and methods to detect, identify, and quantify contaminants, pathogens, and adulterants in food products in 2024. With increasing globalization, supply chain complexity, and regulatory scrutiny, ensuring the safety and quality of food products has become a top priority for manufacturers, regulators, and consumers alike. Food diagnostics encompass a wide range of analytical disciplines, including microbiology, chemistry, molecular biology, and spectroscopy, to detect various hazards and quality attributes in food matrices. Whether testing for microbial pathogens, chemical residues, allergens, or authenticity markers, food diagnostics laboratories provide valuable insights and assurance to stakeholders across the food supply chain. With advancements in instrumentation, automation, and data analytics, food diagnostics labs are equipped to perform rapid, sensitive, and accurate testing to support risk assessment, compliance monitoring, and product safety assurance. As consumer awareness of food safety issues grows, the demand for food diagnostics services and technologies is expected to increase, driving innovation and investment in analytical methods, instrumentation, and quality management systems that enhance food safety and public health.
Food Diagnostics Competitive Landscape
The market report analyses the leading companies in the industry including Agilent Technologies Inc, bioMérieux SA, Bio-Rad Laboratories Inc, Biorex Food Diagnostics, Bruker Corp, Clear Labs Inc, Danaher Corp, EnviroLogix, FOSS Analytical A/S, Gold Standard Diagnostics, Hygiena LLC, Merck KGaA, Nemis Technologies AG, Neogen Corp, PathogenDx Corp, PerkinElmer Inc, Promega Corp, QIAGEN N.V., Randox Food Diagnostics, R-Biopharm AG, Ring Biotechnology Co Ltd, Roka BioScience, Romer Labs Division Holding, Shimadzu Corp, Thermo Fisher Scientific Inc, and Others.
Food Diagnostics Market Dynamics
Food Diagnostics Market Trend: Rising Focus on Food Safety and Quality Assurance
A prominent trend in the food diagnostics market is the increasing emphasis on food safety and quality assurance measures throughout the food supply chain. With consumers becoming more aware and concerned about foodborne illnesses and contaminants, regulatory bodies and industry stakeholders are implementing stringent standards and regulations to ensure the safety and integrity of food products. As a result, there is a growing demand for advanced diagnostic technologies capable of detecting and identifying a wide range of pathogens, toxins, allergens, and adulterants in food and beverage samples. Additionally, advancements in molecular biology, genomics, and bioinformatics are driving the development of rapid, sensitive, and accurate diagnostic assays, enabling food manufacturers, retailers, and regulatory agencies to identify and mitigate potential risks to public health and consumer confidence.
Market Driver: Regulatory Compliance and Consumer Protection
A key driver fueling the growth of the food diagnostics market is the need for regulatory compliance and consumer protection against foodborne hazards and adulteration incidents. Government agencies and international organizations, such as the FDA, USDA, EFSA, and WHO, have implemented strict regulations and guidelines governing food safety and quality standards, mandating regular testing and monitoring of food products for microbial, chemical, and physical contaminants. Furthermore, increasing instances of food fraud, contamination outbreaks, and product recalls have heightened consumer awareness and demand for transparent and reliable food testing practices. Food diagnostics technologies play a critical role in enabling proactive risk management, ensuring regulatory compliance, and safeguarding public health by identifying and addressing potential hazards and adulterants before they reach the market.
Market Opportunity: Adoption of Rapid and Portable Diagnostic Solutions
An opportunity within the food diagnostics market lies in the adoption of rapid and portable diagnostic solutions that offer convenience, efficiency, and versatility for on-site testing and monitoring applications. With the globalization of food supply chains and the growing complexity of food matrices, there is a need for diagnostic technologies that can deliver rapid results, enable real-time decision-making, and facilitate traceability and transparency across the entire food production and distribution process. Portable diagnostic devices, such as handheld PCR systems, immunoassay kits, and spectroscopy instruments, offer the flexibility to perform on-site testing in diverse settings, including farms, processing facilities, restaurants, and retail stores. By leveraging the capabilities of these portable diagnostic solutions, food industry stakeholders can enhance food safety, reduce time-to-market, minimize product losses, and build consumer trust and confidence in the safety and quality of their food products.
Food Diagnostics Market Share Analysis: Consumables Segment held the dominant market share in 2024
In the Food Diagnostics market segmented by Type, the Consumables segment is the largest category. This dominance is attributed to the indispensable role of consumables in food testing procedures, including reagents, assay kits, and other disposable components essential for sample preparation, analysis, and detection of contaminants or pathogens. Consumables are critical for conducting various diagnostic tests, such as immunoassays, PCR assays, and microbiological analyses, enabling food laboratories to accurately assess the safety and quality of food products. Further, the ongoing need for routine testing, compliance with food safety regulations, and the increasing incidence of foodborne illnesses drive the demand for consumables in food diagnostics. Additionally, advancements in consumable technologies, such as rapid test kits and multiplex assays, offer improved sensitivity, specificity, and efficiency in detecting contaminants or adulterants in food samples. As food manufacturers and regulatory agencies prioritize food safety and quality assurance, the Consumables segment maintains its leadership position in the Food Diagnostics market, driving growth and innovation to meet evolving industry needs.
Food Diagnostics Market Share Analysis: Safety Testing Segment market is poised to register the fastest growth rae over the forecast period to 2032
In the Food Diagnostics market segmented by Testing, the Safety Testing segment is the fastest-growing category. This accelerated growth is propelled by several factors, including increasingly stringent food safety regulations, rising consumer awareness regarding foodborne illnesses, and the growing emphasis on preventive measures to ensure the safety of food products. Safety testing encompasses a wide range of diagnostic tests aimed at detecting and quantifying contaminants, pathogens, toxins, and allergens in food samples, including microbiological analyses, chemical assays, and molecular tests. Additionally, food safety incidents and outbreaks continue to highlight the importance of robust testing protocols to identify and mitigate risks associated with foodborne pathogens and contaminants. Further, advancements in diagnostic technologies, such as rapid testing methods, automation, and molecular detection platforms, enable faster and more accurate detection of foodborne hazards, driving the adoption of safety testing solutions across the food industry. As stakeholders prioritize proactive measures to safeguard public health and maintain consumer confidence, the Safety Testing segment continues to witness rapid growth, underscoring its significance in ensuring the safety and integrity of food products within the Food Diagnostics market.
Food Diagnostics Market Share Analysis: In-house Testing held the dominant market share in 2024
In the Food Diagnostics market segmented by Site, the In-house segment is the largest category. This dominance is attributed to the growing trend among food manufacturers and processors to conduct diagnostic testing within their own facilities to maintain control over the quality and safety of their products. In-house testing offers several advantages, including real-time monitoring, faster turnaround times, and greater flexibility in managing testing protocols and schedules. Further, as food safety regulations become more stringent, in-house testing enables companies to ensure compliance and implement corrective actions promptly. Additionally, advancements in diagnostic technologies and automation systems have made it increasingly feasible for food companies to establish fully equipped testing laboratories onsite, reducing the need for outsourcing to third-party facilities. As food producers prioritize quality assurance and risk management, the In-house segment maintains its leadership position in the Food Diagnostics market, driving growth and innovation to meet evolving industry needs.
Food Diagnostics Market Segmentation
By Type
Systems
Test Kits
Consumables
By Testing
Safety
Quality
By Site
Outsourcing Facility
Inhouse
By Food Tested
Meat, poultry and seafood
Dairy products
Processed food
Fruits & vegetables
Cereals
Grains
Others
Countries Analyzed
North America (US, Canada, Mexico)
Europe (Germany, UK, France, Spain, Italy, Russia, Rest of Europe)
Asia Pacific (China, India, Japan, South Korea, Australia, South East Asia, Rest of Asia)
South America (Brazil, Argentina, Rest of South America)
Middle East and Africa (Saudi Arabia, UAE, Rest of Middle East, South Africa, Egypt, Rest of Africa)
Food Diagnostics Companies Profiled in the Study
Agilent Technologies Inc
bioMérieux SA
Bio-Rad Laboratories Inc
Biorex Food Diagnostics
Bruker Corp
Clear Labs Inc
Danaher Corp
EnviroLogix
FOSS Analytical A/S
Gold Standard Diagnostics
Hygiena LLC
Merck KGaA
Nemis Technologies AG
Neogen Corp
PathogenDx Corp
PerkinElmer Inc
Promega Corp
QIAGEN N.V.
Randox Food Diagnostics
R-Biopharm AG
Ring Biotechnology Co Ltd
Roka BioScience
Romer Labs Division Holding
Shimadzu Corp
Thermo Fisher Scientific Inc
*- List Not Exhaustive
Chapter 1. TABLE OF CONTENTS
Chapter 2. Introduction to Food Diagnostics Market
2.1. Market Overview
2.2. Key Statistics and Report Highlights
2.3. Scope of the Comprehensive Study
2.3.1. Market Definition
2.3.2 Countries and Regions Covered
2.3.3 Research Objective
2.3.4 Units, Currency, and Conversions
2.3.5 Industry Value Chain
2.4. Key Market Segments
2.5. Key Companies
2.6. Study Period
Chapter 3. Strategic Analysis Review
3.1. Food Diagnostics Pricing Analysis and Forecast
3.2. Porter’s Five Forces
3.3. Market Ecosystem
3.4. SWOT Analysis
3.5. Regulatory Scenario
3.3. Effects of Inflation, Russia-Ukraine War, moderating economic growth, and other macroeconomic factors
Chapter 4. Competitive Landscape
4.1. Market Share Analysis
4.1.1. Global Food Diagnostics Market Share by Company, 2023
4.1.2. Product Offerings of Leading Food Diagnostics Companies
4.2. Market Entropy
4.2.1. New Product Launches in the Industry
4.2.2. Mergers, Acquisitions, Joint ventures, and Partnerships
4.3. Key Strategies and Best Practices
Chapter 5. Global Market Projections: Best, Reference, and Low Case Scenarios
5.1. Growth Analysis- Case Scenario Definitions
5.2. Low Growth Case Scenario Forecasts
5.3. Reference Growth Case Scenario Forecasts
5.4. High Growth Case Scenario Forecasts
Chapter 6. Market Dynamics
6.1. Food Diagnostics Market Drivers
6.2. Food Diagnostics Market Challenges
6.6. Food Diagnostics Market Opportunities
6.4. Food Diagnostics Market Trends
Chapter 7. Global Food Diagnostics Market Outlook Trends
7.1. Global Food Diagnostics Revenue (USD Million) and CAGR (%) by Type (2021-2032)
7.2. Global Food Diagnostics Revenue (USD Million) and CAGR (%) by Application (2021-2032)
7.3. Global Food Diagnostics Revenue (USD Million) and CAGR (%) by Product (2021-2032)
By Type
Systems
Test Kits
Consumables
By Testing
Safety
Quality
By Site
Outsourcing Facility
Inhouse
By Food Tested
Meat, poultry and seafood
Dairy products
Processed food
Fruits & vegetables
Cereals
Grains
Others
Chapter 8. Global Food Diagnostics Regional Analysis and Outlook
8.1. Global Food Diagnostics Revenue (USD Million) By Regions (2021- 2032)
8.2. North America Food Diagnostics Revenue (USD Million) by Country (2021-2032)
8.2.1. United States Food Diagnostics Regional Analysis and Outlook
8.2.2. Canada Food Diagnostics Regional Analysis and Outlook
8.2.3. Mexico Food Diagnostics Regional Analysis and Outlook
8.3. Europe Food Diagnostics Revenue (USD Million), by Country (2021-2032)
8.3.1. Germany Food Diagnostics Regional Analysis and Outlook
8.3.2. France Food Diagnostics Regional Analysis and Outlook
8.3.3. United Kingdom Food Diagnostics Regional Analysis and Outlook
8.3.4. Spain Food Diagnostics Regional Analysis and Outlook
8.3.5. Italy Food Diagnostics Regional Analysis and Outlook
8.3.6. Russia Food Diagnostics Regional Analysis and Outlook
8.3.7. Rest of Europe Food Diagnostics Regional Analysis and Outlook
8.4. Asia Pacific Food Diagnostics Revenue (USD Million) by Country (2021-2032)
8.4.1. China Food Diagnostics Regional Analysis and Outlook
8.4.2. Japan Food Diagnostics Regional Analysis and Outlook
8.4.3. India Food Diagnostics Regional Analysis and Outlook
8.4.4. South Korea Food Diagnostics Regional Analysis and Outlook
8.4.5. Australia Food Diagnostics Regional Analysis and Outlook
8.4.6. South East Asia Food Diagnostics Regional Analysis and Outlook
8.4.7. Rest of Asia Pacific Food Diagnostics Regional Analysis and Outlook
8.5. South America Food Diagnostics Revenue (USD Million), by Country (2021-2032)
8.5.1. Brazil Food Diagnostics Regional Analysis and Outlook
8.5.2. Argentina Food Diagnostics Regional Analysis and Outlook
8.5.3. Rest of South America Food Diagnostics Regional Analysis and Outlook
8.6. Middle East and Africa Food Diagnostics Revenue (USD Million) by Country (2021-2032)
8.6.1. Middle East Food Diagnostics Regional Analysis and Outlook
8.6.2. Africa Food Diagnostics Regional Analysis and Outlook
Chapter 9. North America Food Diagnostics Analysis and Outlook
9.1. North America Food Diagnostics Revenue (USD Million) by Segments (2021-2032)
9.1.1. North America Food Diagnostics Revenue (USD Million) by Type (2021-2032)
9.1.2. North America Food Diagnostics Revenue (USD Million) by Application (2021-2032)
9.1.3. North America Food Diagnostics Revenue (USD Million) by Product (2021-2032)
By Type
Systems
Test Kits
Consumables
By Testing
Safety
Quality
By Site
Outsourcing Facility
Inhouse
By Food Tested
Meat, poultry and seafood
Dairy products
Processed food
Fruits & vegetables
Cereals
Grains
Others
Chapter 10. Europe Food Diagnostics Analysis and Outlook
10.1. Europe Food Diagnostics Revenue (USD Million), by Segments (USD Million) (2021-2032)
10.1.1. Europe Food Diagnostics Revenue (USD Million) by Type (2021-2032)
10.1.2. Europe Food Diagnostics Revenue (USD Million) by Application (2021-2032)
10.1.3. Europe Food Diagnostics Revenue (USD Million) by Product (2021-2032)
By Type
Systems
Test Kits
Consumables
By Testing
Safety
Quality
By Site
Outsourcing Facility
Inhouse
By Food Tested
Meat, poultry and seafood
Dairy products
Processed food
Fruits & vegetables
Cereals
Grains
Others
Chapter 11. Asia Pacific Food Diagnostics Analysis and Outlook
11.1. Asia Pacific Food Diagnostics Revenue (USD Million), and Revenue (USD Million) by Segments (2021-2032)
11.1.1. Asia Pacific Food Diagnostics Revenue (USD Million) by Type (2021-2032)
11.1.2. Asia Pacific Food Diagnostics Revenue (USD Million) by Application (2021-2032)
11.1.3. Asia Pacific Food Diagnostics Revenue (USD Million) by Product (2021-2032)
By Type
Systems
Test Kits
Consumables
By Testing
Safety
Quality
By Site
Outsourcing Facility
Inhouse
By Food Tested
Meat, poultry and seafood
Dairy products
Processed food
Fruits & vegetables
Cereals
Grains
Others
Chapter 12. South America Food Diagnostics Analysis and Outlook
12.1. South America Food Diagnostics Revenue (USD Million), by Segments (2021-2032)
12.1.1. South America Food Diagnostics Revenue (USD Million) by Type (2021-2032)
12.1.2. South America Food Diagnostics Revenue (USD Million) by Application (2021-2032)
12.1.3. South America Food Diagnostics Revenue (USD Million) by Product (2021-2032)
By Type
Systems
Test Kits
Consumables
By Testing
Safety
Quality
By Site
Outsourcing Facility
Inhouse
By Food Tested
Meat, poultry and seafood
Dairy products
Processed food
Fruits & vegetables
Cereals
Grains
Others
Chapter 13. Middle East and Africa Food Diagnostics Analysis and Outlook
13.1. Middle East and Africa Food Diagnostics Revenue (USD Million), by Segments (2021-2032)
13.1.1. Middle East and Africa Food Diagnostics Revenue (USD Million) by Type (2021-2032)
13.1.2. Middle East and Africa Food Diagnostics Revenue (USD Million) by Application (2021-2032)
13.1.3. Middle East and Africa Food Diagnostics Revenue (USD Million) by Product (2021-2032)
By Type
Systems
Test Kits
Consumables
By Testing
Safety
Quality
By Site
Outsourcing Facility
Inhouse
By Food Tested
Meat, poultry and seafood
Dairy products
Processed food
Fruits & vegetables
Cereals
Grains
Others
Chapter 14. Food Diagnostics Company Profiles
14.1 Business Overview
14.2 Product Profiles
14.3 SWOT Profiles
14.5 Recent Developments
14.6 Financial Profile
List of Companies
Agilent Technologies Inc
bioMérieux SA
Bio-Rad Laboratories Inc
Biorex Food Diagnostics
Bruker Corp
Clear Labs Inc
Danaher Corp
EnviroLogix
FOSS Analytical A/S
Gold Standard Diagnostics
Hygiena LLC
Merck KGaA
Nemis Technologies AG
Neogen Corp
PathogenDx Corp
PerkinElmer Inc
Promega Corp
QIAGEN N.V.
Randox Food Diagnostics
R-Biopharm AG
Ring Biotechnology Co Ltd
Roka BioScience
Romer Labs Division Holding
Shimadzu Corp
Thermo Fisher Scientific Inc
15. Methodology and Data Sources
15.1 Customization Offerings
15.2 Subscription Services
15.3 Related Reports
15.4 Publisher Expertise
LIST OF TABLES
Table 1 Market Segmentation Analysis
Table 2 Global Food Diagnostics Market Share of Leading Companies, 2023
Table 3 Product Offerings of Leading Companies
Table 4 Low Growth Scenario Forecasts
Table 5 Reference Case Growth Scenario
Table 6 High Growth Case Scenario
Table 7 Global Food Diagnostics Revenue (USD Million) And CAGR (%) By Type (2021-2032)
Table 8 Global Food Diagnostics Revenue (USD Million) And CAGR (%) By Application (2021-2032)
Table 9 Global Food Diagnostics Revenue (USD Million) And CAGR (%) By Product (2021-2032)
Table 10 Global Food Diagnostics Market Revenue (USD Million) By Regions (2021-2032)
Table 11 Global Food Diagnostics Market Share (%) By Regions (2021-2032)
Table 12 North America Food Diagnostics Revenue (USD Million) By Country (2021-2032)
Table 13 Europe Food Diagnostics Revenue (USD Million) By Country (2021-2032)
Table 14 Asia Pacific Food Diagnostics Revenue (USD Million) By Country (2021-2032)
Table 15 South America Food Diagnostics Revenue (USD Million) By Country (2021-2032)
Table 16 Middle East and Africa Food Diagnostics Revenue (USD Million) By Region (2021-2032)
Table 17 North America Food Diagnostics Revenue (USD Million) By Type (2021-2032)
Table 18 North America Food Diagnostics Revenue (USD Million) By Application (2021-2032)
Table 19 North America Food Diagnostics Revenue (USD Million) By Product (2021-2032)
Table 20 Europe Food Diagnostics Revenue (USD Million) By Type (2021-2032)
Table 21 Europe Food Diagnostics Revenue (USD Million) By Application (2021-2032)
Table 22 Europe Food Diagnostics Revenue (USD Million) By Product (2021-2032)
Table 23 Asia Pacific Food Diagnostics Revenue (USD Million) By Type (2021-2032)
Table 24 Asia Pacific Food Diagnostics Revenue (USD Million) By Application (2021-2032)
Table 25 Asia Pacific Food Diagnostics Revenue (USD Million) By Product (2021-2032)
Table 26 South America Food Diagnostics Revenue (USD Million) By Type (2021-2032)
Table 27 South America Food Diagnostics Revenue (USD Million) By Application (2021-2032)
Table 28 South America Food Diagnostics Revenue (USD Million) By Product (2021-2032)
Table 29 Middle East and Africa Food Diagnostics Revenue (USD Million) By Type (2021-2032)
Table 30 Middle East and Africa Food Diagnostics Revenue (USD Million) By Application (2021-2032)
Table 31 Middle East and Africa Food Diagnostics Revenue (USD Million) By Product (2021-2032)
LIST OF FIGURES
Figure 1. Market Scope
Figure 2. Pricing Forecasts Per Unit, 2023- 2032
Figure 3. Porter’s Five Forces
Figure 4. Global Food Diagnostics Market Revenue (USD Million) By Regions (2021-2032)
Figure 5. Global Food Diagnostics Market Share (%) By Regions (2023)
Figure 6. North America Food Diagnostics Revenue (USD Million) By Country (2021-2032)
Figure 7. United States Food Diagnostics Revenue (USD Million) By Country (2021-2032)
Figure 8. Canada Food Diagnostics Revenue (USD Million) By Country (2021-2032)
Figure 9. Mexico Food Diagnostics Revenue (USD Million) By Country (2021-2032)
Figure 10. Europe Food Diagnostics Revenue (USD Million) By Country (2021-2032)
Figure 11. Germany Food Diagnostics Revenue (USD Million) By Country (2021-2032)
Figure 12. France Food Diagnostics Revenue (USD Million) By Country (2021-2032)
Figure 13. United Kingdom Food Diagnostics Revenue (USD Million) By Country (2021-2032)
Figure 14. Spain Food Diagnostics Revenue (USD Million) By Country (2021-2032)
Figure 15. Italy Food Diagnostics Revenue (USD Million) By Country (2021-2032)
Figure 16. Russia Food Diagnostics Revenue (USD Million) By Country (2021-2032)
Figure 17. Rest of Europe Food Diagnostics Revenue (USD Million) By Country (2021-2032)
Figure 11. Asia Pacific Food Diagnostics Revenue (USD Million) By Country (2021-2032)
Figure 12. China Food Diagnostics Revenue (USD Million) By Country (2021-2032)
Figure 13. Japan Food Diagnostics Revenue (USD Million) By Country (2021-2032)
Figure 14. India Food Diagnostics Revenue (USD Million) By Country (2021-2032)
Figure 15. South Korea Food Diagnostics Revenue (USD Million) By Country (2021-2032)
Figure 16. Australia Food Diagnostics Revenue (USD Million) By Country (2021-2032)
Figure 17. South East Asia Food Diagnostics Revenue (USD Million) By Country (2021-2032)
Figure 18. South America Food Diagnostics Revenue (USD Million) By Country (2021-2032)
Figure 19. Brazil Food Diagnostics Revenue (USD Million) By Country (2021-2032)
Figure 20. Argentina Food Diagnostics Revenue (USD Million) By Country (2021-2032)
Figure 21. Rest of Asia Pacific Food Diagnostics Revenue (USD Million) By Country (2021-2032)
Figure 22. Middle East and Africa Food Diagnostics Revenue (USD Million) By Region (2021-2032)
Figure 23. Saudi Arabia Food Diagnostics Revenue (USD Million) By Region (2021-2032)
Figure 24. The UAE Food Diagnostics Revenue (USD Million) By Region (2021-2032)
Figure 25. Rest of Middle East Food Diagnostics Revenue (USD Million) By Region (2021-2032)
Figure 26. South Africa Food Diagnostics Revenue (USD Million) By Region (2021-2032)
Figure 27. Africa Food Diagnostics Revenue (USD Million) By Region (2021-2032)
Figure 28. North America Food Diagnostics Revenue (USD Million) By Type (2021-2032)
Figure 29. North America Food Diagnostics Revenue (USD Million) By Application (2021-2032)
Figure 30. North America Food Diagnostics Revenue (USD Million) By Product (2021-2032)
Figure 31. Europe Food Diagnostics Revenue (USD Million) By Type (2021-2032)
Figure 32. Europe Food Diagnostics Revenue (USD Million) By Application (2021-2032)
Figure 33. Europe Food Diagnostics Revenue (USD Million) By Product (2021-2032)
Figure 34. Asia Pacific Food Diagnostics Revenue (USD Million) By Type (2021-2032)
Figure 35. Asia Pacific Food Diagnostics Revenue (USD Million) By Application (2021-2032)
Figure 36. Asia Pacific Food Diagnostics Revenue (USD Million) By Product (2021-2032)
Figure 37. South America Food Diagnostics Revenue (USD Million) By Type (2021-2032)
Figure 38. South America Food Diagnostics Revenue (USD Million) By Application (2021-2032)
Figure 39. South America Food Diagnostics Revenue (USD Million) By Product (2021-2032)
Figure 40. Middle East and Africa Food Diagnostics Revenue (USD Million) By Type (2021-2032)
Figure 41. Middle East and Africa Food Diagnostics Revenue (USD Million) By Application (2021-2032)
Figure 42. Middle East and Africa Food Diagnostics Revenue (USD Million) By Product (2021-2032)
By Type
Systems
Test Kits
Consumables
By Testing
Safety
Quality
By Site
Outsourcing Facility
Inhouse
By Food Tested
Meat, poultry and seafood
Dairy products
Processed food
Fruits & vegetables
Cereals
Grains
Others
Countries Analyzed
North America (US, Canada, Mexico)
Europe (Germany, UK, France, Spain, Italy, Russia, Rest of Europe)
Asia Pacific (China, India, Japan, South Korea, Australia, South East Asia, Rest of Asia)
South America (Brazil, Argentina, Rest of South America)
Middle East and Africa (Saudi Arabia, UAE, Rest of Middle East, South Africa, Egypt, Rest of Africa)
