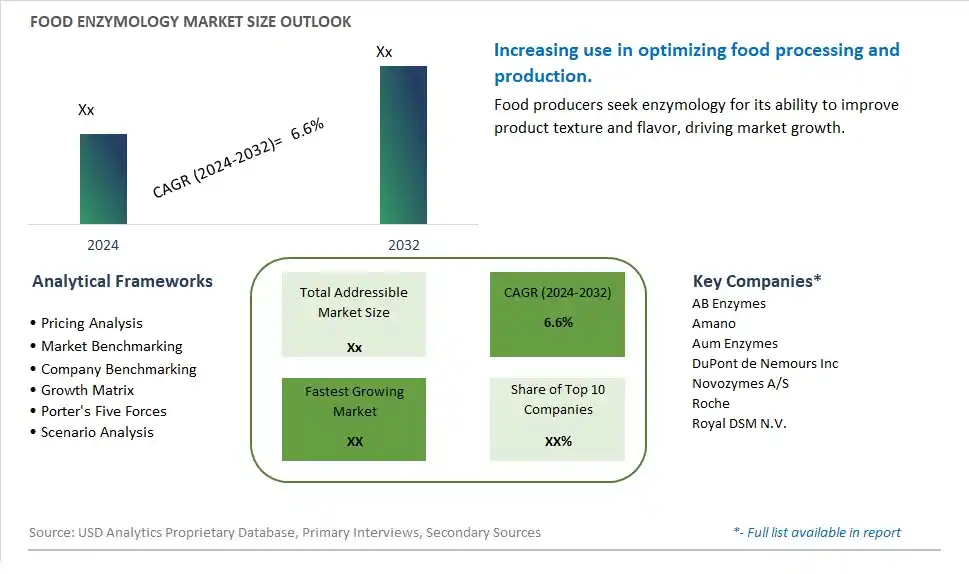
Global Food Enzymology Market Size is valued at $XX Million in 2024 and is forecast to register a growth rate (CAGR) of 6.6% to reach $XX Million by 2032.
The global Food Enzymology Market Comprehensive Study analyzes and forecasts the market size across 6 regions and 24 countries for diverse segments -By Type (Beta-Glucanase, Xylanase, Pectinase, Cellulase, A - Amylase, Neutral Protease), By Application (Food Science and Engineering, Animal Food Processing, Fruit and Vegetable Food Processing, Oil Processing, Others)
An Introduction to Food Enzymology Market
The Food Enzymology market in 2024 is witnessing robust growth, driven by the increasing demand for enzymes that enhance food processing and improve product quality. Food enzymes, such as proteases, amylases, and lipases, are used to catalyze biochemical reactions in various food applications. The market benefits from advancements in enzyme technology, the growing trend of clean label and natural processing aids, and the expansion of the functional food and beverage sectors. Additionally, the rising awareness of the benefits of enzymes for improving food texture, flavor, and nutritional value is contributing to market growth.
Food Enzymology Competitive Landscape
The market report analyses the leading companies in the industry including AB Enzymes, Amano, Aum Enzymes, DuPont de Nemours Inc, Novozymes A/S, Roche, Royal DSM N.V., and Others.
Food Enzymology Market Dynamics
Food Enzymology Market Trend: Shift Towards Enzyme-Based Food Processing and Production
One prominent trend in the food enzymology market is the shift towards enzyme-based food processing and production. As the food industry seeks sustainable and efficient solutions, enzymes are gaining popularity for their role in enhancing food quality, flavor, texture, and nutritional value. Enzymes are used in various applications such as baking, brewing, dairy processing, meat tenderizing, and beverage production to improve process efficiency, reduce production costs, and meet consumer demands for natural and clean label ingredients. This trend is driven by advancements in enzyme technology, growing awareness of enzymatic benefits, and the quest for environmentally friendly and innovative food processing methods.
Food Enzymology Market Driver: Demand for Clean Label and Health-Conscious Food Products
A key driver propelling the food enzymology market is the demand for clean label and health-conscious food products. Consumers are increasingly seeking natural, minimally processed, and additive-free food options that offer nutritional benefits and align with their wellness goals. Enzymes play a crucial role in clean label formulations by replacing synthetic additives, improving product quality, and supporting healthier food choices. The driver behind this trend is consumer preferences for transparent ingredient lists, sustainability, and functional foods, prompting food manufacturers to adopt enzyme-based solutions that enhance product appeal, nutritional profiles, and market competitiveness.
Food Enzymology Market Opportunity: Innovation in Specialty Enzymes and Customized Solutions
A significant opportunity in the food enzymology market lies in innovation in specialty enzymes and customized solutions tailored to specific food processing needs and challenges. Companies can capitalize on this opportunity by developing enzymes with unique functionalities such as gluten modification, fat reduction, flavor enhancement, shelf-life extension, and allergen reduction to address market demands and industry trends. Additionally, there's potential for providing customized enzyme solutions and enzyme blends optimized for different food applications, production processes, and formulation requirements, offering value-added benefits, performance improvements, and cost-effective solutions to food manufacturers. By focusing on innovation, customization, and addressing evolving market needs, companies can expand their product portfolios, capture new market segments, and drive growth in the dynamic food enzymology sector.
Food Enzymology Market Share Analysis: A - Amylase segment generated the highest revenue share in the industry
In the Food Enzymology Market, A - Amylase emerges as the largest segment. A - Amylase enzymes play a crucial role in food processing industries by breaking down starch molecules into sugars like maltose and glucose. This enzymatic activity is widely utilized in various food applications such as baking, brewing, starch liquefaction, and sweetener production. A - Amylase enzymes are favored for their efficiency in improving dough handling, enhancing fermentation processes, and optimizing the texture and shelf life of baked goods and beverages. Their ability to withstand a range of processing conditions makes them indispensable in modern food production, ensuring consistent quality and sensory attributes in finished products.
Food Enzymology Market Share Analysis: Food Science and Engineering Application is the fastest growing segment over the forecast period to 2032
Among the applications in the Food Enzymology Market, the Food Science and Engineering segment is experiencing the fastest growth leading up to 2032. This growth is driven by increasing research and development activities aimed at enhancing food processing techniques and improving nutritional profiles. A - Amylase enzymes, along with other enzymes like cellulases, proteases, and lipases, are pivotal in food science and engineering for their role in modifying food textures, flavors, and nutrient bioavailability. Advances in enzymology are enabling food manufacturers to develop healthier and more sustainable products by reducing processing time, energy consumption, and waste generation. As consumer preferences shift towards clean-label and functional foods, the demand for food enzymes in food science and engineering applications is expected to expand, driving innovation and market growth.
Food Enzymology Market Segmentation
By Type
Beta-Glucanase
Xylanase
Pectinase
Cellulase
A - Amylase
Neutral Protease
By Application
Food Science and Engineering
Animal Food Processing
Fruit and Vegetable Food Processing
Oil Processing
Others
Countries Analyzed
North America (US, Canada, Mexico)
Europe (Germany, UK, France, Spain, Italy, Russia, Rest of Europe)
Asia Pacific (China, India, Japan, South Korea, Australia, South East Asia, Rest of Asia)
South America (Brazil, Argentina, Rest of South America)
Middle East and Africa (Saudi Arabia, UAE, Rest of Middle East, South Africa, Egypt, Rest of Africa)
Food Enzymology Companies Profiled in the Study
AB Enzymes
Amano
Aum Enzymes
DuPont de Nemours Inc
Novozymes A/S
Roche
Royal DSM N.V.
*- List Not Exhaustive
Chapter 1. TABLE OF CONTENTS
Chapter 2. Introduction to Food Enzymology Market
2.1. Market Overview
2.2. Key Statistics and Report Highlights
2.3. Scope of the Comprehensive Study
2.3.1. Market Definition
2.3.2 Countries and Regions Covered
2.3.3 Research Objective
2.3.4 Units, Currency, and Conversions
2.3.5 Industry Value Chain
2.4. Key Market Segments
2.5. Key Companies
2.6. Study Period
Chapter 3. Strategic Analysis Review
3.1. Food Enzymology Pricing Analysis and Forecast
3.2. Porter’s Five Forces
3.3. Market Ecosystem
3.4. SWOT Analysis
3.5. Regulatory Scenario
3.3. Effects of Inflation, Russia-Ukraine War, moderating economic growth, and other macroeconomic factors
Chapter 4. Competitive Landscape
4.1. Market Share Analysis
4.1.1. Global Food Enzymology Market Share by Company, 2023
4.1.2. Product Offerings of Leading Food Enzymology Companies
4.2. Market Entropy
4.2.1. New Product Launches in the Industry
4.2.2. Mergers, Acquisitions, Joint ventures, and Partnerships
4.3. Key Strategies and Best Practices
Chapter 5. Global Market Projections: Best, Reference, and Low Case Scenarios
5.1. Growth Analysis- Case Scenario Definitions
5.2. Low Growth Case Scenario Forecasts
5.3. Reference Growth Case Scenario Forecasts
5.4. High Growth Case Scenario Forecasts
Chapter 6. Market Dynamics
6.1. Food Enzymology Market Drivers
6.2. Food Enzymology Market Challenges
6.6. Food Enzymology Market Opportunities
6.4. Food Enzymology Market Trends
Chapter 7. Global Food Enzymology Market Outlook Trends
7.1. Global Food Enzymology Revenue (USD Million) and CAGR (%) by Type (2021-2032)
7.2. Global Food Enzymology Revenue (USD Million) and CAGR (%) by Application (2021-2032)
7.3. Global Food Enzymology Revenue (USD Million) and CAGR (%) by Product (2021-2032)
By Type
Beta-Glucanase
Xylanase
Pectinase
Cellulase
A - Amylase
Neutral Protease
By Application
Food Science and Engineering
Animal Food Processing
Fruit and Vegetable Food Processing
Oil Processing
Others
Chapter 8. Global Food Enzymology Regional Analysis and Outlook
8.1. Global Food Enzymology Revenue (USD Million) By Regions (2021- 2032)
8.2. North America Food Enzymology Revenue (USD Million) by Country (2021-2032)
8.2.1. United States Food Enzymology Regional Analysis and Outlook
8.2.2. Canada Food Enzymology Regional Analysis and Outlook
8.2.3. Mexico Food Enzymology Regional Analysis and Outlook
8.3. Europe Food Enzymology Revenue (USD Million), by Country (2021-2032)
8.3.1. Germany Food Enzymology Regional Analysis and Outlook
8.3.2. France Food Enzymology Regional Analysis and Outlook
8.3.3. United Kingdom Food Enzymology Regional Analysis and Outlook
8.3.4. Spain Food Enzymology Regional Analysis and Outlook
8.3.5. Italy Food Enzymology Regional Analysis and Outlook
8.3.6. Russia Food Enzymology Regional Analysis and Outlook
8.3.7. Rest of Europe Food Enzymology Regional Analysis and Outlook
8.4. Asia Pacific Food Enzymology Revenue (USD Million) by Country (2021-2032)
8.4.1. China Food Enzymology Regional Analysis and Outlook
8.4.2. Japan Food Enzymology Regional Analysis and Outlook
8.4.3. India Food Enzymology Regional Analysis and Outlook
8.4.4. South Korea Food Enzymology Regional Analysis and Outlook
8.4.5. Australia Food Enzymology Regional Analysis and Outlook
8.4.6. South East Asia Food Enzymology Regional Analysis and Outlook
8.4.7. Rest of Asia Pacific Food Enzymology Regional Analysis and Outlook
8.5. South America Food Enzymology Revenue (USD Million), by Country (2021-2032)
8.5.1. Brazil Food Enzymology Regional Analysis and Outlook
8.5.2. Argentina Food Enzymology Regional Analysis and Outlook
8.5.3. Rest of South America Food Enzymology Regional Analysis and Outlook
8.6. Middle East and Africa Food Enzymology Revenue (USD Million) by Country (2021-2032)
8.6.1. Middle East Food Enzymology Regional Analysis and Outlook
8.6.2. Africa Food Enzymology Regional Analysis and Outlook
Chapter 9. North America Food Enzymology Analysis and Outlook
9.1. North America Food Enzymology Revenue (USD Million) by Segments (2021-2032)
9.1.1. North America Food Enzymology Revenue (USD Million) by Type (2021-2032)
9.1.2. North America Food Enzymology Revenue (USD Million) by Application (2021-2032)
9.1.3. North America Food Enzymology Revenue (USD Million) by Product (2021-2032)
By Type
Beta-Glucanase
Xylanase
Pectinase
Cellulase
A - Amylase
Neutral Protease
By Application
Food Science and Engineering
Animal Food Processing
Fruit and Vegetable Food Processing
Oil Processing
Others
Chapter 10. Europe Food Enzymology Analysis and Outlook
10.1. Europe Food Enzymology Revenue (USD Million), by Segments (USD Million) (2021-2032)
10.1.1. Europe Food Enzymology Revenue (USD Million) by Type (2021-2032)
10.1.2. Europe Food Enzymology Revenue (USD Million) by Application (2021-2032)
10.1.3. Europe Food Enzymology Revenue (USD Million) by Product (2021-2032)
By Type
Beta-Glucanase
Xylanase
Pectinase
Cellulase
A - Amylase
Neutral Protease
By Application
Food Science and Engineering
Animal Food Processing
Fruit and Vegetable Food Processing
Oil Processing
Others
Chapter 11. Asia Pacific Food Enzymology Analysis and Outlook
11.1. Asia Pacific Food Enzymology Revenue (USD Million), and Revenue (USD Million) by Segments (2021-2032)
11.1.1. Asia Pacific Food Enzymology Revenue (USD Million) by Type (2021-2032)
11.1.2. Asia Pacific Food Enzymology Revenue (USD Million) by Application (2021-2032)
11.1.3. Asia Pacific Food Enzymology Revenue (USD Million) by Product (2021-2032)
By Type
Beta-Glucanase
Xylanase
Pectinase
Cellulase
A - Amylase
Neutral Protease
By Application
Food Science and Engineering
Animal Food Processing
Fruit and Vegetable Food Processing
Oil Processing
Others
Chapter 12. South America Food Enzymology Analysis and Outlook
12.1. South America Food Enzymology Revenue (USD Million), by Segments (2021-2032)
12.1.1. South America Food Enzymology Revenue (USD Million) by Type (2021-2032)
12.1.2. South America Food Enzymology Revenue (USD Million) by Application (2021-2032)
12.1.3. South America Food Enzymology Revenue (USD Million) by Product (2021-2032)
By Type
Beta-Glucanase
Xylanase
Pectinase
Cellulase
A - Amylase
Neutral Protease
By Application
Food Science and Engineering
Animal Food Processing
Fruit and Vegetable Food Processing
Oil Processing
Others
Chapter 13. Middle East and Africa Food Enzymology Analysis and Outlook
13.1. Middle East and Africa Food Enzymology Revenue (USD Million), by Segments (2021-2032)
13.1.1. Middle East and Africa Food Enzymology Revenue (USD Million) by Type (2021-2032)
13.1.2. Middle East and Africa Food Enzymology Revenue (USD Million) by Application (2021-2032)
13.1.3. Middle East and Africa Food Enzymology Revenue (USD Million) by Product (2021-2032)
By Type
Beta-Glucanase
Xylanase
Pectinase
Cellulase
A - Amylase
Neutral Protease
By Application
Food Science and Engineering
Animal Food Processing
Fruit and Vegetable Food Processing
Oil Processing
Others
Chapter 14. Food Enzymology Company Profiles
14.1 Business Overview
14.2 Product Profiles
14.3 SWOT Profiles
14.5 Recent Developments
14.6 Financial Profile
List of Companies
AB Enzymes
Amano
Aum Enzymes
DuPont de Nemours Inc
Novozymes A/S
Roche
Royal DSM N.V.
15. Methodology and Data Sources
15.1 Customization Offerings
15.2 Subscription Services
15.3 Related Reports
15.4 Publisher Expertise
LIST OF TABLES
Table 1 Market Segmentation Analysis
Table 2 Global Food Enzymology Market Share of Leading Companies, 2023
Table 3 Product Offerings of Leading Companies
Table 4 Low Growth Scenario Forecasts
Table 5 Reference Case Growth Scenario
Table 6 High Growth Case Scenario
Table 7 Global Food Enzymology Revenue (USD Million) And CAGR (%) By Type (2021-2032)
Table 8 Global Food Enzymology Revenue (USD Million) And CAGR (%) By Application (2021-2032)
Table 9 Global Food Enzymology Revenue (USD Million) And CAGR (%) By Product (2021-2032)
Table 10 Global Food Enzymology Market Revenue (USD Million) By Regions (2021-2032)
Table 11 Global Food Enzymology Market Share (%) By Regions (2021-2032)
Table 12 North America Food Enzymology Revenue (USD Million) By Country (2021-2032)
Table 13 Europe Food Enzymology Revenue (USD Million) By Country (2021-2032)
Table 14 Asia Pacific Food Enzymology Revenue (USD Million) By Country (2021-2032)
Table 15 South America Food Enzymology Revenue (USD Million) By Country (2021-2032)
Table 16 Middle East and Africa Food Enzymology Revenue (USD Million) By Region (2021-2032)
Table 17 North America Food Enzymology Revenue (USD Million) By Type (2021-2032)
Table 18 North America Food Enzymology Revenue (USD Million) By Application (2021-2032)
Table 19 North America Food Enzymology Revenue (USD Million) By Product (2021-2032)
Table 20 Europe Food Enzymology Revenue (USD Million) By Type (2021-2032)
Table 21 Europe Food Enzymology Revenue (USD Million) By Application (2021-2032)
Table 22 Europe Food Enzymology Revenue (USD Million) By Product (2021-2032)
Table 23 Asia Pacific Food Enzymology Revenue (USD Million) By Type (2021-2032)
Table 24 Asia Pacific Food Enzymology Revenue (USD Million) By Application (2021-2032)
Table 25 Asia Pacific Food Enzymology Revenue (USD Million) By Product (2021-2032)
Table 26 South America Food Enzymology Revenue (USD Million) By Type (2021-2032)
Table 27 South America Food Enzymology Revenue (USD Million) By Application (2021-2032)
Table 28 South America Food Enzymology Revenue (USD Million) By Product (2021-2032)
Table 29 Middle East and Africa Food Enzymology Revenue (USD Million) By Type (2021-2032)
Table 30 Middle East and Africa Food Enzymology Revenue (USD Million) By Application (2021-2032)
Table 31 Middle East and Africa Food Enzymology Revenue (USD Million) By Product (2021-2032)
LIST OF FIGURES
Figure 1. Market Scope
Figure 2. Pricing Forecasts Per Unit, 2023- 2032
Figure 3. Porter’s Five Forces
Figure 4. Global Food Enzymology Market Revenue (USD Million) By Regions (2021-2032)
Figure 5. Global Food Enzymology Market Share (%) By Regions (2023)
Figure 6. North America Food Enzymology Revenue (USD Million) By Country (2021-2032)
Figure 7. United States Food Enzymology Revenue (USD Million) By Country (2021-2032)
Figure 8. Canada Food Enzymology Revenue (USD Million) By Country (2021-2032)
Figure 9. Mexico Food Enzymology Revenue (USD Million) By Country (2021-2032)
Figure 10. Europe Food Enzymology Revenue (USD Million) By Country (2021-2032)
Figure 11. Germany Food Enzymology Revenue (USD Million) By Country (2021-2032)
Figure 12. France Food Enzymology Revenue (USD Million) By Country (2021-2032)
Figure 13. United Kingdom Food Enzymology Revenue (USD Million) By Country (2021-2032)
Figure 14. Spain Food Enzymology Revenue (USD Million) By Country (2021-2032)
Figure 15. Italy Food Enzymology Revenue (USD Million) By Country (2021-2032)
Figure 16. Russia Food Enzymology Revenue (USD Million) By Country (2021-2032)
Figure 17. Rest of Europe Food Enzymology Revenue (USD Million) By Country (2021-2032)
Figure 11. Asia Pacific Food Enzymology Revenue (USD Million) By Country (2021-2032)
Figure 12. China Food Enzymology Revenue (USD Million) By Country (2021-2032)
Figure 13. Japan Food Enzymology Revenue (USD Million) By Country (2021-2032)
Figure 14. India Food Enzymology Revenue (USD Million) By Country (2021-2032)
Figure 15. South Korea Food Enzymology Revenue (USD Million) By Country (2021-2032)
Figure 16. Australia Food Enzymology Revenue (USD Million) By Country (2021-2032)
Figure 17. South East Asia Food Enzymology Revenue (USD Million) By Country (2021-2032)
Figure 18. South America Food Enzymology Revenue (USD Million) By Country (2021-2032)
Figure 19. Brazil Food Enzymology Revenue (USD Million) By Country (2021-2032)
Figure 20. Argentina Food Enzymology Revenue (USD Million) By Country (2021-2032)
Figure 21. Rest of Asia Pacific Food Enzymology Revenue (USD Million) By Country (2021-2032)
Figure 22. Middle East and Africa Food Enzymology Revenue (USD Million) By Region (2021-2032)
Figure 23. Saudi Arabia Food Enzymology Revenue (USD Million) By Region (2021-2032)
Figure 24. The UAE Food Enzymology Revenue (USD Million) By Region (2021-2032)
Figure 25. Rest of Middle East Food Enzymology Revenue (USD Million) By Region (2021-2032)
Figure 26. South Africa Food Enzymology Revenue (USD Million) By Region (2021-2032)
Figure 27. Africa Food Enzymology Revenue (USD Million) By Region (2021-2032)
Figure 28. North America Food Enzymology Revenue (USD Million) By Type (2021-2032)
Figure 29. North America Food Enzymology Revenue (USD Million) By Application (2021-2032)
Figure 30. North America Food Enzymology Revenue (USD Million) By Product (2021-2032)
Figure 31. Europe Food Enzymology Revenue (USD Million) By Type (2021-2032)
Figure 32. Europe Food Enzymology Revenue (USD Million) By Application (2021-2032)
Figure 33. Europe Food Enzymology Revenue (USD Million) By Product (2021-2032)
Figure 34. Asia Pacific Food Enzymology Revenue (USD Million) By Type (2021-2032)
Figure 35. Asia Pacific Food Enzymology Revenue (USD Million) By Application (2021-2032)
Figure 36. Asia Pacific Food Enzymology Revenue (USD Million) By Product (2021-2032)
Figure 37. South America Food Enzymology Revenue (USD Million) By Type (2021-2032)
Figure 38. South America Food Enzymology Revenue (USD Million) By Application (2021-2032)
Figure 39. South America Food Enzymology Revenue (USD Million) By Product (2021-2032)
Figure 40. Middle East and Africa Food Enzymology Revenue (USD Million) By Type (2021-2032)
Figure 41. Middle East and Africa Food Enzymology Revenue (USD Million) By Application (2021-2032)
Figure 42. Middle East and Africa Food Enzymology Revenue (USD Million) By Product (2021-2032)
By Type
Beta-Glucanase
Xylanase
Pectinase
Cellulase
A - Amylase
Neutral Protease
By Application
Food Science and Engineering
Animal Food Processing
Fruit and Vegetable Food Processing
Oil Processing
Others
Countries Analyzed
North America (US, Canada, Mexico)
Europe (Germany, UK, France, Spain, Italy, Russia, Rest of Europe)
Asia Pacific (China, India, Japan, South Korea, Australia, South East Asia, Rest of Asia)
South America (Brazil, Argentina, Rest of South America)
Middle East and Africa (Saudi Arabia, UAE, Rest of Middle East, South Africa, Egypt, Rest of Africa)
