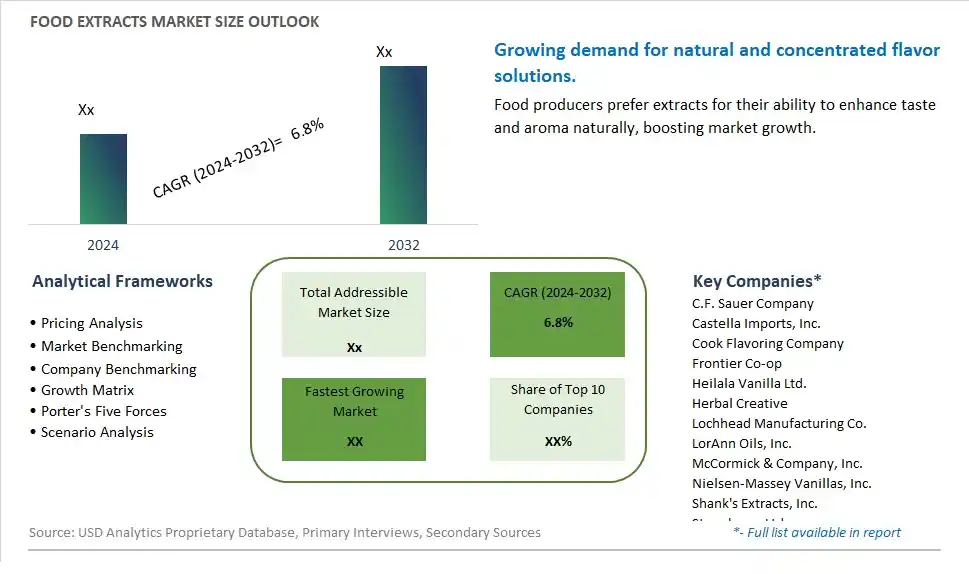
Global Food Extracts Market Size is valued at $XX Million in 2024 and is forecast to register a growth rate (CAGR) of 6.8% to reach $XX Million by 2032.
The global Food Extracts Market Comprehensive Study analyzes and forecasts the market size across 6 regions and 24 countries for diverse segments -By Type (Liquid, Powder), By Application (Food Processing, Commercial, Residential)
An Introduction to Food Extracts Market
In 2024, the Food Extracts market is experiencing significant growth, driven by the rising demand for natural and concentrated flavors and nutrients in food products. Food extracts, derived from fruits, vegetables, herbs, and spices, are used to enhance the flavor, aroma, and health benefits of various foods and beverages. The market benefits from advancements in extraction and preservation technologies, the growing trend of clean label and natural ingredients, and the expansion of the functional and specialty food sectors. Additionally, the increasing consumer preference for natural over artificial additives is driving market growth.
Food Extracts Competitive Landscape
The market report analyses the leading companies in the industry including C.F. Sauer Company, Castella Imports, Inc., Cook Flavoring Company, Frontier Co-op, Heilala Vanilla Ltd., Herbal Creative, Lochhead Manufacturing Co., LorAnn Oils, Inc., McCormick & Company, Inc., Nielsen-Massey Vanillas, Inc., Shank's Extracts, Inc., Steenbergs Ltd., and Others.
Food Extracts Market Dynamics
Food Extracts Market Trend: Growing Demand for Natural and Functional Ingredients
One prominent trend in the food extracts market is the growing demand for natural and functional ingredients. Consumers are increasingly seeking food products with clean label profiles and recognizable ingredients, leading to a preference for extracts derived from natural sources such as plants, fruits, herbs, and spices. These extracts offer not only flavor and aroma enhancement but also potential health benefits due to their bioactive compounds and nutritional properties. This trend is driven by consumer preferences for wholesome, minimally processed foods, as well as the desire for products with added functionality, such as antioxidant-rich extracts, immune-boosting botanicals, and natural flavor enhancers.
Food Extracts Market Driver: Health and Wellness Trends and Functional Benefits
A key driver propelling the food extracts market is health and wellness trends and the functional benefits offered by extracts. With a growing focus on preventive healthcare, nutrition, and well-being, consumers are gravitating towards food products fortified with extracts known for their health-promoting properties. Extracts such as green tea, turmeric, ginger, and elderberry are sought after for their antioxidant, anti-inflammatory, and immune-boosting properties, driving demand for food and beverage formulations that incorporate these functional ingredients. The driver behind this trend is the consumer desire for products that not only taste good but also contribute to overall health and wellness goals, spurring innovation and market growth in the food extracts segment.
Food Extracts Market Opportunity: Expansion into Specialty and Niche Extracts
A significant opportunity in the food extracts market lies in the expansion into specialty and niche extracts that cater to specific consumer preferences, dietary needs, and market segments. Manufacturers can capitalize on this opportunity by developing extracts from unique and exotic sources, targeting trends such as plant-based diets, ethnic cuisines, and functional beverages. Additionally, there's potential for creating extracts with specific bioactive compounds or phytonutrients known for their health benefits, such as polyphenols, flavonoids, or essential oils, to meet the demand for functional and value-added ingredients in food formulations. By diversifying their extract offerings, exploring novel sources, and addressing emerging consumer trends, companies can differentiate their products, attract new customers, and unlock growth opportunities in the dynamic food extracts market.
Food Extracts Market Share Analysis: Liquid Extracts segment generated the highest revenue share in the industry
In the Food Extracts Market, Liquid Extracts stand out as the largest segment. Liquid extracts are concentrated forms of flavor compounds extracted from various natural sources such as fruits, herbs, spices, and botanicals. They are widely preferred in the food and beverage industry due to their ease of use, versatility in application, and ability to deliver intense flavors and aromas. Liquid extracts are commonly used in beverages, bakery products, confectionery, sauces, dressings, and dairy products to impart specific flavors without altering the texture significantly. Their liquid form allows for easier blending into recipes and precise dosing, making them a preferred choice for manufacturers seeking consistent flavor profiles in their products. The liquid extract market continues to expand as consumer demand for natural and authentic flavors grows, driving innovation in extraction techniques and product formulations.
Food Extracts Market Share Analysis: Food Processing is the fastest growing segment over the forecast period to 2032
Within the Food Extracts Market, the Food Processing segment emerges as the fastest growing to 2032. This growth can be attributed to several factors driving demand in the food processing industry. Food extracts, whether in liquid or powder form, play a crucial role in enhancing flavor profiles, improving product consistency, and meeting consumer preferences for natural ingredients. In food processing applications, extracts are extensively used across various categories such as beverages, bakery, snacks, and prepared meals. They not only contribute to flavor enhancement but also serve functional purposes like color enhancement and preservation, aligning with the industry's shift towards cleaner labels and healthier product formulations. As food manufacturers seek innovative ways to meet evolving consumer demands for natural and sustainable ingredients, the adoption of food extracts in food processing is expected to witness robust growth. This trend underscores the importance of food extracts in driving product differentiation and meeting market trends towards clean label and natural food products.
Food Extracts Market Segmentation
By Type
Liquid
Powder
By Application
Food Processing
Commercial
Residential
Countries Analyzed
North America (US, Canada, Mexico)
Europe (Germany, UK, France, Spain, Italy, Russia, Rest of Europe)
Asia Pacific (China, India, Japan, South Korea, Australia, South East Asia, Rest of Asia)
South America (Brazil, Argentina, Rest of South America)
Middle East and Africa (Saudi Arabia, UAE, Rest of Middle East, South Africa, Egypt, Rest of Africa)
Food Extracts Companies Profiled in the Study
C.F. Sauer Company
Castella Imports, Inc.
Cook Flavoring Company
Frontier Co-op
Heilala Vanilla Ltd.
Herbal Creative
Lochhead Manufacturing Co.
LorAnn Oils, Inc.
McCormick & Company, Inc.
Nielsen-Massey Vanillas, Inc.
Shank's Extracts, Inc.
Steenbergs Ltd.
*- List Not Exhaustive
Chapter 1. TABLE OF CONTENTS
Chapter 2. Introduction to Food Extracts Market
2.1. Market Overview
2.2. Key Statistics and Report Highlights
2.3. Scope of the Comprehensive Study
2.3.1. Market Definition
2.3.2 Countries and Regions Covered
2.3.3 Research Objective
2.3.4 Units, Currency, and Conversions
2.3.5 Industry Value Chain
2.4. Key Market Segments
2.5. Key Companies
2.6. Study Period
Chapter 3. Strategic Analysis Review
3.1. Food Extracts Pricing Analysis and Forecast
3.2. Porter’s Five Forces
3.3. Market Ecosystem
3.4. SWOT Analysis
3.5. Regulatory Scenario
3.3. Effects of Inflation, Russia-Ukraine War, moderating economic growth, and other macroeconomic factors
Chapter 4. Competitive Landscape
4.1. Market Share Analysis
4.1.1. Global Food Extracts Market Share by Company, 2023
4.1.2. Product Offerings of Leading Food Extracts Companies
4.2. Market Entropy
4.2.1. New Product Launches in the Industry
4.2.2. Mergers, Acquisitions, Joint ventures, and Partnerships
4.3. Key Strategies and Best Practices
Chapter 5. Global Market Projections: Best, Reference, and Low Case Scenarios
5.1. Growth Analysis- Case Scenario Definitions
5.2. Low Growth Case Scenario Forecasts
5.3. Reference Growth Case Scenario Forecasts
5.4. High Growth Case Scenario Forecasts
Chapter 6. Market Dynamics
6.1. Food Extracts Market Drivers
6.2. Food Extracts Market Challenges
6.6. Food Extracts Market Opportunities
6.4. Food Extracts Market Trends
Chapter 7. Global Food Extracts Market Outlook Trends
7.1. Global Food Extracts Revenue (USD Million) and CAGR (%) by Type (2021-2032)
7.2. Global Food Extracts Revenue (USD Million) and CAGR (%) by Application (2021-2032)
7.3. Global Food Extracts Revenue (USD Million) and CAGR (%) by Product (2021-2032)
By Type
Liquid
Powder
By Application
Food Processing
Commercial
Residential
Chapter 8. Global Food Extracts Regional Analysis and Outlook
8.1. Global Food Extracts Revenue (USD Million) By Regions (2021- 2032)
8.2. North America Food Extracts Revenue (USD Million) by Country (2021-2032)
8.2.1. United States Food Extracts Regional Analysis and Outlook
8.2.2. Canada Food Extracts Regional Analysis and Outlook
8.2.3. Mexico Food Extracts Regional Analysis and Outlook
8.3. Europe Food Extracts Revenue (USD Million), by Country (2021-2032)
8.3.1. Germany Food Extracts Regional Analysis and Outlook
8.3.2. France Food Extracts Regional Analysis and Outlook
8.3.3. United Kingdom Food Extracts Regional Analysis and Outlook
8.3.4. Spain Food Extracts Regional Analysis and Outlook
8.3.5. Italy Food Extracts Regional Analysis and Outlook
8.3.6. Russia Food Extracts Regional Analysis and Outlook
8.3.7. Rest of Europe Food Extracts Regional Analysis and Outlook
8.4. Asia Pacific Food Extracts Revenue (USD Million) by Country (2021-2032)
8.4.1. China Food Extracts Regional Analysis and Outlook
8.4.2. Japan Food Extracts Regional Analysis and Outlook
8.4.3. India Food Extracts Regional Analysis and Outlook
8.4.4. South Korea Food Extracts Regional Analysis and Outlook
8.4.5. Australia Food Extracts Regional Analysis and Outlook
8.4.6. South East Asia Food Extracts Regional Analysis and Outlook
8.4.7. Rest of Asia Pacific Food Extracts Regional Analysis and Outlook
8.5. South America Food Extracts Revenue (USD Million), by Country (2021-2032)
8.5.1. Brazil Food Extracts Regional Analysis and Outlook
8.5.2. Argentina Food Extracts Regional Analysis and Outlook
8.5.3. Rest of South America Food Extracts Regional Analysis and Outlook
8.6. Middle East and Africa Food Extracts Revenue (USD Million) by Country (2021-2032)
8.6.1. Middle East Food Extracts Regional Analysis and Outlook
8.6.2. Africa Food Extracts Regional Analysis and Outlook
Chapter 9. North America Food Extracts Analysis and Outlook
9.1. North America Food Extracts Revenue (USD Million) by Segments (2021-2032)
9.1.1. North America Food Extracts Revenue (USD Million) by Type (2021-2032)
9.1.2. North America Food Extracts Revenue (USD Million) by Application (2021-2032)
9.1.3. North America Food Extracts Revenue (USD Million) by Product (2021-2032)
By Type
Liquid
Powder
By Application
Food Processing
Commercial
Residential
Chapter 10. Europe Food Extracts Analysis and Outlook
10.1. Europe Food Extracts Revenue (USD Million), by Segments (USD Million) (2021-2032)
10.1.1. Europe Food Extracts Revenue (USD Million) by Type (2021-2032)
10.1.2. Europe Food Extracts Revenue (USD Million) by Application (2021-2032)
10.1.3. Europe Food Extracts Revenue (USD Million) by Product (2021-2032)
By Type
Liquid
Powder
By Application
Food Processing
Commercial
Residential
Chapter 11. Asia Pacific Food Extracts Analysis and Outlook
11.1. Asia Pacific Food Extracts Revenue (USD Million), and Revenue (USD Million) by Segments (2021-2032)
11.1.1. Asia Pacific Food Extracts Revenue (USD Million) by Type (2021-2032)
11.1.2. Asia Pacific Food Extracts Revenue (USD Million) by Application (2021-2032)
11.1.3. Asia Pacific Food Extracts Revenue (USD Million) by Product (2021-2032)
By Type
Liquid
Powder
By Application
Food Processing
Commercial
Residential
Chapter 12. South America Food Extracts Analysis and Outlook
12.1. South America Food Extracts Revenue (USD Million), by Segments (2021-2032)
12.1.1. South America Food Extracts Revenue (USD Million) by Type (2021-2032)
12.1.2. South America Food Extracts Revenue (USD Million) by Application (2021-2032)
12.1.3. South America Food Extracts Revenue (USD Million) by Product (2021-2032)
By Type
Liquid
Powder
By Application
Food Processing
Commercial
Residential
Chapter 13. Middle East and Africa Food Extracts Analysis and Outlook
13.1. Middle East and Africa Food Extracts Revenue (USD Million), by Segments (2021-2032)
13.1.1. Middle East and Africa Food Extracts Revenue (USD Million) by Type (2021-2032)
13.1.2. Middle East and Africa Food Extracts Revenue (USD Million) by Application (2021-2032)
13.1.3. Middle East and Africa Food Extracts Revenue (USD Million) by Product (2021-2032)
By Type
Liquid
Powder
By Application
Food Processing
Commercial
Residential
Chapter 14. Food Extracts Company Profiles
14.1 Business Overview
14.2 Product Profiles
14.3 SWOT Profiles
14.5 Recent Developments
14.6 Financial Profile
List of Companies
C.F. Sauer Company
Castella Imports, Inc.
Cook Flavoring Company
Frontier Co-op
Heilala Vanilla Ltd.
Herbal Creative
Lochhead Manufacturing Co.
LorAnn Oils, Inc.
McCormick & Company, Inc.
Nielsen-Massey Vanillas, Inc.
Shank's Extracts, Inc.
Steenbergs Ltd.
15. Methodology and Data Sources
15.1 Customization Offerings
15.2 Subscription Services
15.3 Related Reports
15.4 Publisher Expertise
LIST OF TABLES
Table 1 Market Segmentation Analysis
Table 2 Global Food Extracts Market Share of Leading Companies, 2023
Table 3 Product Offerings of Leading Companies
Table 4 Low Growth Scenario Forecasts
Table 5 Reference Case Growth Scenario
Table 6 High Growth Case Scenario
Table 7 Global Food Extracts Revenue (USD Million) And CAGR (%) By Type (2021-2032)
Table 8 Global Food Extracts Revenue (USD Million) And CAGR (%) By Application (2021-2032)
Table 9 Global Food Extracts Revenue (USD Million) And CAGR (%) By Product (2021-2032)
Table 10 Global Food Extracts Market Revenue (USD Million) By Regions (2021-2032)
Table 11 Global Food Extracts Market Share (%) By Regions (2021-2032)
Table 12 North America Food Extracts Revenue (USD Million) By Country (2021-2032)
Table 13 Europe Food Extracts Revenue (USD Million) By Country (2021-2032)
Table 14 Asia Pacific Food Extracts Revenue (USD Million) By Country (2021-2032)
Table 15 South America Food Extracts Revenue (USD Million) By Country (2021-2032)
Table 16 Middle East and Africa Food Extracts Revenue (USD Million) By Region (2021-2032)
Table 17 North America Food Extracts Revenue (USD Million) By Type (2021-2032)
Table 18 North America Food Extracts Revenue (USD Million) By Application (2021-2032)
Table 19 North America Food Extracts Revenue (USD Million) By Product (2021-2032)
Table 20 Europe Food Extracts Revenue (USD Million) By Type (2021-2032)
Table 21 Europe Food Extracts Revenue (USD Million) By Application (2021-2032)
Table 22 Europe Food Extracts Revenue (USD Million) By Product (2021-2032)
Table 23 Asia Pacific Food Extracts Revenue (USD Million) By Type (2021-2032)
Table 24 Asia Pacific Food Extracts Revenue (USD Million) By Application (2021-2032)
Table 25 Asia Pacific Food Extracts Revenue (USD Million) By Product (2021-2032)
Table 26 South America Food Extracts Revenue (USD Million) By Type (2021-2032)
Table 27 South America Food Extracts Revenue (USD Million) By Application (2021-2032)
Table 28 South America Food Extracts Revenue (USD Million) By Product (2021-2032)
Table 29 Middle East and Africa Food Extracts Revenue (USD Million) By Type (2021-2032)
Table 30 Middle East and Africa Food Extracts Revenue (USD Million) By Application (2021-2032)
Table 31 Middle East and Africa Food Extracts Revenue (USD Million) By Product (2021-2032)
LIST OF FIGURES
Figure 1. Market Scope
Figure 2. Pricing Forecasts Per Unit, 2023- 2032
Figure 3. Porter’s Five Forces
Figure 4. Global Food Extracts Market Revenue (USD Million) By Regions (2021-2032)
Figure 5. Global Food Extracts Market Share (%) By Regions (2023)
Figure 6. North America Food Extracts Revenue (USD Million) By Country (2021-2032)
Figure 7. United States Food Extracts Revenue (USD Million) By Country (2021-2032)
Figure 8. Canada Food Extracts Revenue (USD Million) By Country (2021-2032)
Figure 9. Mexico Food Extracts Revenue (USD Million) By Country (2021-2032)
Figure 10. Europe Food Extracts Revenue (USD Million) By Country (2021-2032)
Figure 11. Germany Food Extracts Revenue (USD Million) By Country (2021-2032)
Figure 12. France Food Extracts Revenue (USD Million) By Country (2021-2032)
Figure 13. United Kingdom Food Extracts Revenue (USD Million) By Country (2021-2032)
Figure 14. Spain Food Extracts Revenue (USD Million) By Country (2021-2032)
Figure 15. Italy Food Extracts Revenue (USD Million) By Country (2021-2032)
Figure 16. Russia Food Extracts Revenue (USD Million) By Country (2021-2032)
Figure 17. Rest of Europe Food Extracts Revenue (USD Million) By Country (2021-2032)
Figure 11. Asia Pacific Food Extracts Revenue (USD Million) By Country (2021-2032)
Figure 12. China Food Extracts Revenue (USD Million) By Country (2021-2032)
Figure 13. Japan Food Extracts Revenue (USD Million) By Country (2021-2032)
Figure 14. India Food Extracts Revenue (USD Million) By Country (2021-2032)
Figure 15. South Korea Food Extracts Revenue (USD Million) By Country (2021-2032)
Figure 16. Australia Food Extracts Revenue (USD Million) By Country (2021-2032)
Figure 17. South East Asia Food Extracts Revenue (USD Million) By Country (2021-2032)
Figure 18. South America Food Extracts Revenue (USD Million) By Country (2021-2032)
Figure 19. Brazil Food Extracts Revenue (USD Million) By Country (2021-2032)
Figure 20. Argentina Food Extracts Revenue (USD Million) By Country (2021-2032)
Figure 21. Rest of Asia Pacific Food Extracts Revenue (USD Million) By Country (2021-2032)
Figure 22. Middle East and Africa Food Extracts Revenue (USD Million) By Region (2021-2032)
Figure 23. Saudi Arabia Food Extracts Revenue (USD Million) By Region (2021-2032)
Figure 24. The UAE Food Extracts Revenue (USD Million) By Region (2021-2032)
Figure 25. Rest of Middle East Food Extracts Revenue (USD Million) By Region (2021-2032)
Figure 26. South Africa Food Extracts Revenue (USD Million) By Region (2021-2032)
Figure 27. Africa Food Extracts Revenue (USD Million) By Region (2021-2032)
Figure 28. North America Food Extracts Revenue (USD Million) By Type (2021-2032)
Figure 29. North America Food Extracts Revenue (USD Million) By Application (2021-2032)
Figure 30. North America Food Extracts Revenue (USD Million) By Product (2021-2032)
Figure 31. Europe Food Extracts Revenue (USD Million) By Type (2021-2032)
Figure 32. Europe Food Extracts Revenue (USD Million) By Application (2021-2032)
Figure 33. Europe Food Extracts Revenue (USD Million) By Product (2021-2032)
Figure 34. Asia Pacific Food Extracts Revenue (USD Million) By Type (2021-2032)
Figure 35. Asia Pacific Food Extracts Revenue (USD Million) By Application (2021-2032)
Figure 36. Asia Pacific Food Extracts Revenue (USD Million) By Product (2021-2032)
Figure 37. South America Food Extracts Revenue (USD Million) By Type (2021-2032)
Figure 38. South America Food Extracts Revenue (USD Million) By Application (2021-2032)
Figure 39. South America Food Extracts Revenue (USD Million) By Product (2021-2032)
Figure 40. Middle East and Africa Food Extracts Revenue (USD Million) By Type (2021-2032)
Figure 41. Middle East and Africa Food Extracts Revenue (USD Million) By Application (2021-2032)
Figure 42. Middle East and Africa Food Extracts Revenue (USD Million) By Product (2021-2032)
By Type
Liquid
Powder
By Application
Food Processing
Commercial
Residential
Countries Analyzed
North America (US, Canada, Mexico)
Europe (Germany, UK, France, Spain, Italy, Russia, Rest of Europe)
Asia Pacific (China, India, Japan, South Korea, Australia, South East Asia, Rest of Asia)
South America (Brazil, Argentina, Rest of South America)
Middle East and Africa (Saudi Arabia, UAE, Rest of Middle East, South Africa, Egypt, Rest of Africa)
