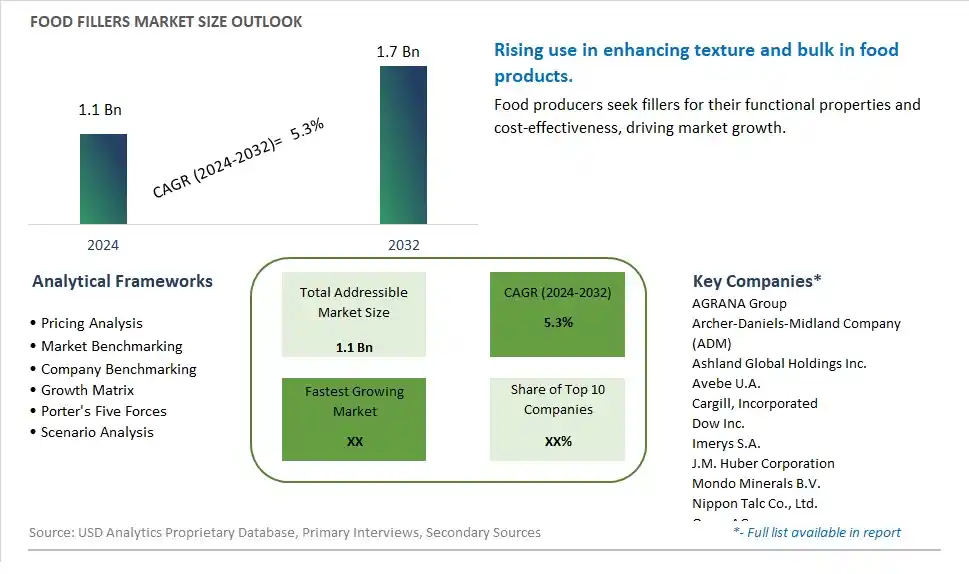
Global Food Fillers Market Size is valued at $1.1 Billion in 2024 and is forecast to register a growth rate (CAGR) of 5.3% to reach $1.7 Billion by 2032.
The global Food Fillers Market Comprehensive Study analyzes and forecasts the market size across 6 regions and 24 countries for diverse segments -By Type (Starch, Cellulose, Calcium Carbonate, Talc, Others), By Application (Meat and Seafood, Dairy, Beverage, Others)
An Introduction to Food Fillers Market
The Food Fillers market in 2024 is thriving, fueled by the rising demand for cost-effective and functional ingredients that enhance the texture, volume, and nutritional profile of food products. Food fillers, such as starches, fibers, and proteins, are used in various applications including bakery, meat products, and dairy. The market benefits from advancements in filler technologies, the growing trend of clean label and health-conscious foods, and the expansion of the global food processing industry. Additionally, the increasing focus on food sustainability and resource efficiency is contributing to market growth.
Food Fillers Competitive Landscape
The market report analyses the leading companies in the industry including AGRANA Group, Archer-Daniels-Midland Company (ADM), Ashland Global Holdings Inc., Avebe U.A., Cargill, Incorporated, Dow Inc., Imerys S.A., J.M. Huber Corporation, Mondo Minerals B.V., Nippon Talc Co., Ltd., Omya AG, Rayonier Advanced Materials Inc., Shin-Etsu Chemical Co., Ltd., and Others.
Food Fillers Market Dynamics
Food Fillers Market Trend: Shift Towards Clean Label and Natural Ingredients
One prominent trend in the food fillers market is the shift towards clean label and natural ingredients. Consumers are increasingly seeking food products with transparent ingredient lists and recognizable, wholesome components. This trend is driving the demand for food fillers derived from natural sources such as grains, fruits, vegetables, and legumes, as opposed to synthetic or heavily processed fillers. Manufacturers are responding by incorporating natural fillers into various food products to meet consumer preferences for clean label foods, nutritional transparency, and healthier options.
Food Fillers Market Driver: Cost-Effective Formulation Solutions and Product Enhancement
A key driver propelling the food fillers market is the need for cost-effective formulation solutions and product enhancement. Food fillers play a crucial role in improving texture, consistency, and mouthfeel while extending product volume and reducing formulation costs. The driver behind this trend is the desire of food manufacturers to optimize product formulations, enhance sensory attributes, and maintain product affordability without compromising on quality or nutritional value. Fillers also help in bulking up products, improving processing efficiencies, and creating satisfying eating experiences for consumers.
Food Fillers Market Opportunity: Development of Functional and Nutrient-Rich Fillers
A significant opportunity in the food fillers market lies in the development of functional and nutrient-rich fillers that add value and appeal to food products. Manufacturers can capitalize on this opportunity by creating fillers enriched with vitamins, minerals, dietary fibers, and functional compounds to enhance the nutritional profile of foods. Additionally, there's potential for developing fillers with specific functional properties such as binding, gelling, or emulsifying capabilities to improve product texture, stability, and shelf life. By focusing on innovation in fillers that offer both functional benefits and nutritional value, companies can meet the demand for healthier and more functional food options while addressing market trends and consumer preferences in the food fillers segment.
Food Fillers Market Share Analysis: Starch segment generated the highest revenue share in the industry
Among the types listed in the Food Fillers Market, Starch emerges as the largest segment. Starch is widely utilized in the food industry for its versatile properties, serving as a key filler ingredient across various food products. It acts as a thickening agent in sauces, soups, and gravies, providing texture and consistency. Further, starch is crucial in bakery applications, where it enhances dough elasticity and shelf life. In processed meats and dairy products, starch helps improve texture and moisture retention. The widespread adoption of starch in food manufacturing is driven by its cost-effectiveness, functionality, and ability to meet diverse application requirements. As consumer preferences shift towards cleaner labels and natural ingredients, starches derived from natural sources like corn, tapioca, and potato are increasingly favored. This trend reflects the importance of starch as a fundamental ingredient supporting the texture, stability, and sensory attributes of a wide range of food products.
Food Fillers Market Share Analysis: Meat and Seafood is the fastest growing segment over the forecast period to 2032
The Meat and Seafood segment stands out as the fastest growing in the Food Fillers Market by Application. This growth is driven by several factors shaping consumer preferences and industry trends. In processed meat products, fillers such as starches and cellulose derivatives are used to improve texture, reduce costs, and enhance moisture retention. These fillers play a crucial role in maintaining product quality during processing and storage, thereby extending shelf life. Further, as the demand for convenient and ready-to-eat meat products rises, manufacturers are increasingly incorporating fillers to achieve consistent texture and appearance across their product lines. In the seafood sector, fillers are utilized in surimi-based products like imitation crab meat to mimic the texture and taste of real seafood while optimizing cost-efficiency. The application of fillers in meat and seafood processing underscores their importance in meeting consumer expectations for quality, affordability, and sustainability in food products.
Food Fillers Market Segmentation
By Type
Starch
Cellulose
Calcium Carbonate
Talc
Others
By Application
Meat and Seafood
Dairy
Beverage
Others
Countries Analyzed
North America (US, Canada, Mexico)
Europe (Germany, UK, France, Spain, Italy, Russia, Rest of Europe)
Asia Pacific (China, India, Japan, South Korea, Australia, South East Asia, Rest of Asia)
South America (Brazil, Argentina, Rest of South America)
Middle East and Africa (Saudi Arabia, UAE, Rest of Middle East, South Africa, Egypt, Rest of Africa)
Food Fillers Companies Profiled in the Study
AGRANA Group
Archer-Daniels-Midland Company (ADM)
Ashland Global Holdings Inc.
Avebe U.A.
Cargill, Incorporated
Dow Inc.
Imerys S.A.
J.M. Huber Corporation
Mondo Minerals B.V.
Nippon Talc Co., Ltd.
Omya AG
Rayonier Advanced Materials Inc.
Shin-Etsu Chemical Co., Ltd.
*- List Not Exhaustive
Chapter 1. TABLE OF CONTENTS
Chapter 2. Introduction to Food Fillers Market
2.1. Market Overview
2.2. Key Statistics and Report Highlights
2.3. Scope of the Comprehensive Study
2.3.1. Market Definition
2.3.2 Countries and Regions Covered
2.3.3 Research Objective
2.3.4 Units, Currency, and Conversions
2.3.5 Industry Value Chain
2.4. Key Market Segments
2.5. Key Companies
2.6. Study Period
Chapter 3. Strategic Analysis Review
3.1. Food Fillers Pricing Analysis and Forecast
3.2. Porter’s Five Forces
3.3. Market Ecosystem
3.4. SWOT Analysis
3.5. Regulatory Scenario
3.3. Effects of Inflation, Russia-Ukraine War, moderating economic growth, and other macroeconomic factors
Chapter 4. Competitive Landscape
4.1. Market Share Analysis
4.1.1. Global Food Fillers Market Share by Company, 2023
4.1.2. Product Offerings of Leading Food Fillers Companies
4.2. Market Entropy
4.2.1. New Product Launches in the Industry
4.2.2. Mergers, Acquisitions, Joint ventures, and Partnerships
4.3. Key Strategies and Best Practices
Chapter 5. Global Market Projections: Best, Reference, and Low Case Scenarios
5.1. Growth Analysis- Case Scenario Definitions
5.2. Low Growth Case Scenario Forecasts
5.3. Reference Growth Case Scenario Forecasts
5.4. High Growth Case Scenario Forecasts
Chapter 6. Market Dynamics
6.1. Food Fillers Market Drivers
6.2. Food Fillers Market Challenges
6.6. Food Fillers Market Opportunities
6.4. Food Fillers Market Trends
Chapter 7. Global Food Fillers Market Outlook Trends
7.1. Global Food Fillers Revenue (USD Million) and CAGR (%) by Type (2021-2032)
7.2. Global Food Fillers Revenue (USD Million) and CAGR (%) by Application (2021-2032)
7.3. Global Food Fillers Revenue (USD Million) and CAGR (%) by Product (2021-2032)
By Type
Starch
Cellulose
Calcium Carbonate
Talc
Others
By Application
Meat and Seafood
Dairy
Beverage
Others
Chapter 8. Global Food Fillers Regional Analysis and Outlook
8.1. Global Food Fillers Revenue (USD Million) By Regions (2021- 2032)
8.2. North America Food Fillers Revenue (USD Million) by Country (2021-2032)
8.2.1. United States Food Fillers Regional Analysis and Outlook
8.2.2. Canada Food Fillers Regional Analysis and Outlook
8.2.3. Mexico Food Fillers Regional Analysis and Outlook
8.3. Europe Food Fillers Revenue (USD Million), by Country (2021-2032)
8.3.1. Germany Food Fillers Regional Analysis and Outlook
8.3.2. France Food Fillers Regional Analysis and Outlook
8.3.3. United Kingdom Food Fillers Regional Analysis and Outlook
8.3.4. Spain Food Fillers Regional Analysis and Outlook
8.3.5. Italy Food Fillers Regional Analysis and Outlook
8.3.6. Russia Food Fillers Regional Analysis and Outlook
8.3.7. Rest of Europe Food Fillers Regional Analysis and Outlook
8.4. Asia Pacific Food Fillers Revenue (USD Million) by Country (2021-2032)
8.4.1. China Food Fillers Regional Analysis and Outlook
8.4.2. Japan Food Fillers Regional Analysis and Outlook
8.4.3. India Food Fillers Regional Analysis and Outlook
8.4.4. South Korea Food Fillers Regional Analysis and Outlook
8.4.5. Australia Food Fillers Regional Analysis and Outlook
8.4.6. South East Asia Food Fillers Regional Analysis and Outlook
8.4.7. Rest of Asia Pacific Food Fillers Regional Analysis and Outlook
8.5. South America Food Fillers Revenue (USD Million), by Country (2021-2032)
8.5.1. Brazil Food Fillers Regional Analysis and Outlook
8.5.2. Argentina Food Fillers Regional Analysis and Outlook
8.5.3. Rest of South America Food Fillers Regional Analysis and Outlook
8.6. Middle East and Africa Food Fillers Revenue (USD Million) by Country (2021-2032)
8.6.1. Middle East Food Fillers Regional Analysis and Outlook
8.6.2. Africa Food Fillers Regional Analysis and Outlook
Chapter 9. North America Food Fillers Analysis and Outlook
9.1. North America Food Fillers Revenue (USD Million) by Segments (2021-2032)
9.1.1. North America Food Fillers Revenue (USD Million) by Type (2021-2032)
9.1.2. North America Food Fillers Revenue (USD Million) by Application (2021-2032)
9.1.3. North America Food Fillers Revenue (USD Million) by Product (2021-2032)
By Type
Starch
Cellulose
Calcium Carbonate
Talc
Others
By Application
Meat and Seafood
Dairy
Beverage
Others
Chapter 10. Europe Food Fillers Analysis and Outlook
10.1. Europe Food Fillers Revenue (USD Million), by Segments (USD Million) (2021-2032)
10.1.1. Europe Food Fillers Revenue (USD Million) by Type (2021-2032)
10.1.2. Europe Food Fillers Revenue (USD Million) by Application (2021-2032)
10.1.3. Europe Food Fillers Revenue (USD Million) by Product (2021-2032)
By Type
Starch
Cellulose
Calcium Carbonate
Talc
Others
By Application
Meat and Seafood
Dairy
Beverage
Others
Chapter 11. Asia Pacific Food Fillers Analysis and Outlook
11.1. Asia Pacific Food Fillers Revenue (USD Million), and Revenue (USD Million) by Segments (2021-2032)
11.1.1. Asia Pacific Food Fillers Revenue (USD Million) by Type (2021-2032)
11.1.2. Asia Pacific Food Fillers Revenue (USD Million) by Application (2021-2032)
11.1.3. Asia Pacific Food Fillers Revenue (USD Million) by Product (2021-2032)
By Type
Starch
Cellulose
Calcium Carbonate
Talc
Others
By Application
Meat and Seafood
Dairy
Beverage
Others
Chapter 12. South America Food Fillers Analysis and Outlook
12.1. South America Food Fillers Revenue (USD Million), by Segments (2021-2032)
12.1.1. South America Food Fillers Revenue (USD Million) by Type (2021-2032)
12.1.2. South America Food Fillers Revenue (USD Million) by Application (2021-2032)
12.1.3. South America Food Fillers Revenue (USD Million) by Product (2021-2032)
By Type
Starch
Cellulose
Calcium Carbonate
Talc
Others
By Application
Meat and Seafood
Dairy
Beverage
Others
Chapter 13. Middle East and Africa Food Fillers Analysis and Outlook
13.1. Middle East and Africa Food Fillers Revenue (USD Million), by Segments (2021-2032)
13.1.1. Middle East and Africa Food Fillers Revenue (USD Million) by Type (2021-2032)
13.1.2. Middle East and Africa Food Fillers Revenue (USD Million) by Application (2021-2032)
13.1.3. Middle East and Africa Food Fillers Revenue (USD Million) by Product (2021-2032)
By Type
Starch
Cellulose
Calcium Carbonate
Talc
Others
By Application
Meat and Seafood
Dairy
Beverage
Others
Chapter 14. Food Fillers Company Profiles
14.1 Business Overview
14.2 Product Profiles
14.3 SWOT Profiles
14.5 Recent Developments
14.6 Financial Profile
List of Companies
AGRANA Group
Archer-Daniels-Midland Company (ADM)
Ashland Global Holdings Inc.
Avebe U.A.
Cargill, Incorporated
Dow Inc.
Imerys S.A.
J.M. Huber Corporation
Mondo Minerals B.V.
Nippon Talc Co., Ltd.
Omya AG
Rayonier Advanced Materials Inc.
Shin-Etsu Chemical Co., Ltd.
15. Methodology and Data Sources
15.1 Customization Offerings
15.2 Subscription Services
15.3 Related Reports
15.4 Publisher Expertise
LIST OF TABLES
Table 1 Market Segmentation Analysis
Table 2 Global Food Fillers Market Share of Leading Companies, 2023
Table 3 Product Offerings of Leading Companies
Table 4 Low Growth Scenario Forecasts
Table 5 Reference Case Growth Scenario
Table 6 High Growth Case Scenario
Table 7 Global Food Fillers Revenue (USD Million) And CAGR (%) By Type (2021-2032)
Table 8 Global Food Fillers Revenue (USD Million) And CAGR (%) By Application (2021-2032)
Table 9 Global Food Fillers Revenue (USD Million) And CAGR (%) By Product (2021-2032)
Table 10 Global Food Fillers Market Revenue (USD Million) By Regions (2021-2032)
Table 11 Global Food Fillers Market Share (%) By Regions (2021-2032)
Table 12 North America Food Fillers Revenue (USD Million) By Country (2021-2032)
Table 13 Europe Food Fillers Revenue (USD Million) By Country (2021-2032)
Table 14 Asia Pacific Food Fillers Revenue (USD Million) By Country (2021-2032)
Table 15 South America Food Fillers Revenue (USD Million) By Country (2021-2032)
Table 16 Middle East and Africa Food Fillers Revenue (USD Million) By Region (2021-2032)
Table 17 North America Food Fillers Revenue (USD Million) By Type (2021-2032)
Table 18 North America Food Fillers Revenue (USD Million) By Application (2021-2032)
Table 19 North America Food Fillers Revenue (USD Million) By Product (2021-2032)
Table 20 Europe Food Fillers Revenue (USD Million) By Type (2021-2032)
Table 21 Europe Food Fillers Revenue (USD Million) By Application (2021-2032)
Table 22 Europe Food Fillers Revenue (USD Million) By Product (2021-2032)
Table 23 Asia Pacific Food Fillers Revenue (USD Million) By Type (2021-2032)
Table 24 Asia Pacific Food Fillers Revenue (USD Million) By Application (2021-2032)
Table 25 Asia Pacific Food Fillers Revenue (USD Million) By Product (2021-2032)
Table 26 South America Food Fillers Revenue (USD Million) By Type (2021-2032)
Table 27 South America Food Fillers Revenue (USD Million) By Application (2021-2032)
Table 28 South America Food Fillers Revenue (USD Million) By Product (2021-2032)
Table 29 Middle East and Africa Food Fillers Revenue (USD Million) By Type (2021-2032)
Table 30 Middle East and Africa Food Fillers Revenue (USD Million) By Application (2021-2032)
Table 31 Middle East and Africa Food Fillers Revenue (USD Million) By Product (2021-2032)
LIST OF FIGURES
Figure 1. Market Scope
Figure 2. Pricing Forecasts Per Unit, 2023- 2032
Figure 3. Porter’s Five Forces
Figure 4. Global Food Fillers Market Revenue (USD Million) By Regions (2021-2032)
Figure 5. Global Food Fillers Market Share (%) By Regions (2023)
Figure 6. North America Food Fillers Revenue (USD Million) By Country (2021-2032)
Figure 7. United States Food Fillers Revenue (USD Million) By Country (2021-2032)
Figure 8. Canada Food Fillers Revenue (USD Million) By Country (2021-2032)
Figure 9. Mexico Food Fillers Revenue (USD Million) By Country (2021-2032)
Figure 10. Europe Food Fillers Revenue (USD Million) By Country (2021-2032)
Figure 11. Germany Food Fillers Revenue (USD Million) By Country (2021-2032)
Figure 12. France Food Fillers Revenue (USD Million) By Country (2021-2032)
Figure 13. United Kingdom Food Fillers Revenue (USD Million) By Country (2021-2032)
Figure 14. Spain Food Fillers Revenue (USD Million) By Country (2021-2032)
Figure 15. Italy Food Fillers Revenue (USD Million) By Country (2021-2032)
Figure 16. Russia Food Fillers Revenue (USD Million) By Country (2021-2032)
Figure 17. Rest of Europe Food Fillers Revenue (USD Million) By Country (2021-2032)
Figure 11. Asia Pacific Food Fillers Revenue (USD Million) By Country (2021-2032)
Figure 12. China Food Fillers Revenue (USD Million) By Country (2021-2032)
Figure 13. Japan Food Fillers Revenue (USD Million) By Country (2021-2032)
Figure 14. India Food Fillers Revenue (USD Million) By Country (2021-2032)
Figure 15. South Korea Food Fillers Revenue (USD Million) By Country (2021-2032)
Figure 16. Australia Food Fillers Revenue (USD Million) By Country (2021-2032)
Figure 17. South East Asia Food Fillers Revenue (USD Million) By Country (2021-2032)
Figure 18. South America Food Fillers Revenue (USD Million) By Country (2021-2032)
Figure 19. Brazil Food Fillers Revenue (USD Million) By Country (2021-2032)
Figure 20. Argentina Food Fillers Revenue (USD Million) By Country (2021-2032)
Figure 21. Rest of Asia Pacific Food Fillers Revenue (USD Million) By Country (2021-2032)
Figure 22. Middle East and Africa Food Fillers Revenue (USD Million) By Region (2021-2032)
Figure 23. Saudi Arabia Food Fillers Revenue (USD Million) By Region (2021-2032)
Figure 24. The UAE Food Fillers Revenue (USD Million) By Region (2021-2032)
Figure 25. Rest of Middle East Food Fillers Revenue (USD Million) By Region (2021-2032)
Figure 26. South Africa Food Fillers Revenue (USD Million) By Region (2021-2032)
Figure 27. Africa Food Fillers Revenue (USD Million) By Region (2021-2032)
Figure 28. North America Food Fillers Revenue (USD Million) By Type (2021-2032)
Figure 29. North America Food Fillers Revenue (USD Million) By Application (2021-2032)
Figure 30. North America Food Fillers Revenue (USD Million) By Product (2021-2032)
Figure 31. Europe Food Fillers Revenue (USD Million) By Type (2021-2032)
Figure 32. Europe Food Fillers Revenue (USD Million) By Application (2021-2032)
Figure 33. Europe Food Fillers Revenue (USD Million) By Product (2021-2032)
Figure 34. Asia Pacific Food Fillers Revenue (USD Million) By Type (2021-2032)
Figure 35. Asia Pacific Food Fillers Revenue (USD Million) By Application (2021-2032)
Figure 36. Asia Pacific Food Fillers Revenue (USD Million) By Product (2021-2032)
Figure 37. South America Food Fillers Revenue (USD Million) By Type (2021-2032)
Figure 38. South America Food Fillers Revenue (USD Million) By Application (2021-2032)
Figure 39. South America Food Fillers Revenue (USD Million) By Product (2021-2032)
Figure 40. Middle East and Africa Food Fillers Revenue (USD Million) By Type (2021-2032)
Figure 41. Middle East and Africa Food Fillers Revenue (USD Million) By Application (2021-2032)
Figure 42. Middle East and Africa Food Fillers Revenue (USD Million) By Product (2021-2032)
By Type
Starch
Cellulose
Calcium Carbonate
Talc
Others
By Application
Meat and Seafood
Dairy
Beverage
Others
Countries Analyzed
North America (US, Canada, Mexico)
Europe (Germany, UK, France, Spain, Italy, Russia, Rest of Europe)
Asia Pacific (China, India, Japan, South Korea, Australia, South East Asia, Rest of Asia)
South America (Brazil, Argentina, Rest of South America)
Middle East and Africa (Saudi Arabia, UAE, Rest of Middle East, South Africa, Egypt, Rest of Africa)
