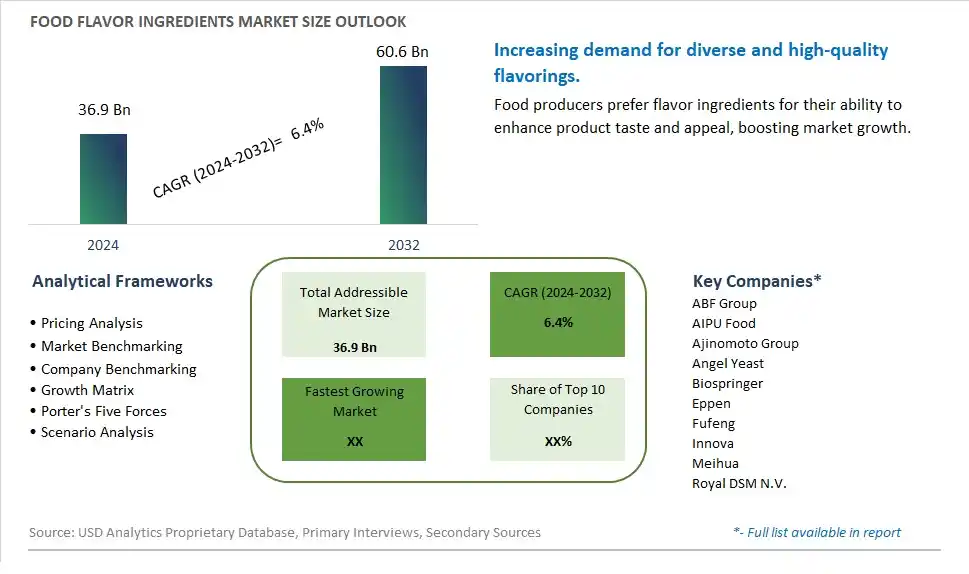
Global Food Flavor Ingredients Market Size is valued at $36.9 Billion in 2024 and is forecast to register a growth rate (CAGR) of 6.4% to reach $60.6 Billion by 2032.
The global Food Flavor Ingredients Market Comprehensive Study analyzes and forecasts the market size across 6 regions and 24 countries for diverse segments -By Type (Monosodium Glutamate (MSG), Hydrolyzed Vegetable Protein (HVP), Yeast Extract, Others), By Application (Food Processing, Restaurants, Residential, Others)
An Introduction to Food Flavor Ingredients Market
The Food Flavor Ingredients market in 2024 is witnessing robust growth, driven by the increasing demand for diverse and authentic flavors in food and beverage products. Food flavor ingredients, including natural extracts, essential oils, and flavor enhancers, are used to create appealing taste profiles. The market benefits from advancements in flavor formulation and delivery technologies, the growing trend of global and ethnic cuisines, and the expansion of the functional and specialty food sectors. Additionally, the rising focus on clean label and natural flavor solutions is driving market growth.
Food Flavor Ingredients Competitive Landscape
The market report analyses the leading companies in the industry including ABF Group, AIPU Food, Ajinomoto Group, Angel Yeast, Biospringer, Eppen, Fufeng, Innova, Meihua, Royal DSM N.V., and Others.
Food Flavor Ingredients Market Dynamics
Food Flavor Ingredients Market Trend: Growing Demand for Natural and Authentic Flavor Experiences
One prominent trend in the food flavor ingredients market is the growing demand for natural and authentic flavor experiences. Consumers are increasingly seeking food products that offer genuine, true-to-source flavors derived from natural ingredients such as fruits, herbs, spices, and botanical extracts. This trend is driven by the shift towards clean label products, consumer preferences for healthier and more wholesome foods, and the desire for sensory-rich culinary experiences. Food manufacturers are responding by sourcing natural flavor ingredients and creating formulations that deliver robust, flavorful profiles without artificial additives or synthetic flavors, aligning with market trends and consumer expectations.
Food Flavor Ingredients Market Driver: Innovation in Flavor Technology and Customization
A key driver propelling the food flavor ingredients market is innovation in flavor technology and customization options. Advancements in flavor science, encapsulation techniques, and ingredient blending allow for the creation of complex and nuanced flavor profiles that cater to diverse taste preferences and product applications. The driver behind this trend is the demand for unique and differentiated flavor experiences, as well as the ability to tailor flavors to specific product categories, dietary requirements, and regional preferences. Food manufacturers leverage flavor customization to enhance product differentiation, brand identity, and consumer satisfaction, driving growth and competitiveness in the market.
Food Flavor Ingredients Market Opportunity: Development of Functional and Health-Promoting Flavors
A significant opportunity in the food flavor ingredients market lies in the development of functional and health-promoting flavors that offer added value and nutritional benefits. Companies can capitalize on this opportunity by incorporating functional ingredients such as vitamins, antioxidants, probiotics, or plant-based extracts into flavor formulations, creating products that not only taste great but also contribute to overall health and wellness. Additionally, there's potential for developing flavors with specific health claims or functional properties, such as energy-boosting flavors, digestive health-supporting flavors, or mood-enhancing flavors, to meet consumer demands for functional foods and beverages. By innovating in functional flavor ingredients, companies can tap into the growing market for health-conscious products, differentiate their offerings, and capture new consumer segments seeking flavorful and beneficial food experiences.
Food Flavor Ingredients Market Share Analysis: Monosodium Glutamate (MSG) segment generated the highest revenue share in the industry
Among the types in the Food Flavor Ingredients Market, Monosodium Glutamate (MSG) emerges as the largest segment. MSG, a flavor enhancer widely used in various cuisines globally, enhances the savory taste of foods without imparting its own flavor. Its popularity stems from its ability to intensify the umami flavor, which is considered the fifth basic taste alongside sweet, sour, salty, and bitter. MSG is commonly found in processed foods, soups, snacks, and restaurant dishes to improve taste perception and overall palatability. The demand for MSG continues to grow due to its cost-effectiveness in enhancing food flavors, its compatibility with a wide range of food applications, and its ability to reduce the need for added salt, thereby addressing health concerns related to excessive sodium intake. As consumer preferences for savory and umami flavors persist, MSG remains a crucial ingredient in the food industry's flavor enhancement strategies.
Food Flavor Ingredients Market Share Analysis: Food Processing is the fastest growing segment over the forecast period to 2032
In the Food Flavor Ingredients Market, the Food Processing segment stands out as the fastest-growing to 2032. Food processing involves the transformation of raw ingredients into food products, and flavor ingredients play a pivotal role in enhancing taste profiles, ensuring consistency, and meeting consumer preferences. As consumer demand for convenience foods, ready-to-eat meals, and processed snacks continues to rise globally, there is a corresponding increase in the use of flavor ingredients in food processing. These ingredients not only improve taste but also contribute to product differentiation and brand identity in a competitive market landscape. Manufacturers are increasingly adopting innovative flavor solutions to cater to changing consumer tastes, dietary preferences, and cultural influences, thereby driving the growth of flavor ingredients in the food processing sector. Further, advancements in food technology and flavor encapsulation techniques are further boosting the application of flavor ingredients in processed foods, ensuring sustained growth in this segment.
Food Flavor Ingredients Market Segmentation
By Type
Monosodium Glutamate (MSG)
Hydrolyzed Vegetable Protein (HVP)
Yeast Extract
Others
By Application
Food Processing
Restaurants
Residential
Others
Countries Analyzed
North America (US, Canada, Mexico)
Europe (Germany, UK, France, Spain, Italy, Russia, Rest of Europe)
Asia Pacific (China, India, Japan, South Korea, Australia, South East Asia, Rest of Asia)
South America (Brazil, Argentina, Rest of South America)
Middle East and Africa (Saudi Arabia, UAE, Rest of Middle East, South Africa, Egypt, Rest of Africa)
Food Flavor Ingredients Companies Profiled in the Study
ABF Group
AIPU Food
Ajinomoto Group
Angel Yeast
Biospringer
Eppen
Fufeng
Innova
Meihua
Royal DSM N.V.
*- List Not Exhaustive
Chapter 1. TABLE OF CONTENTS
Chapter 2. Introduction to Food Flavor Ingredients Market
2.1. Market Overview
2.2. Key Statistics and Report Highlights
2.3. Scope of the Comprehensive Study
2.3.1. Market Definition
2.3.2 Countries and Regions Covered
2.3.3 Research Objective
2.3.4 Units, Currency, and Conversions
2.3.5 Industry Value Chain
2.4. Key Market Segments
2.5. Key Companies
2.6. Study Period
Chapter 3. Strategic Analysis Review
3.1. Food Flavor Ingredients Pricing Analysis and Forecast
3.2. Porter’s Five Forces
3.3. Market Ecosystem
3.4. SWOT Analysis
3.5. Regulatory Scenario
3.3. Effects of Inflation, Russia-Ukraine War, moderating economic growth, and other macroeconomic factors
Chapter 4. Competitive Landscape
4.1. Market Share Analysis
4.1.1. Global Food Flavor Ingredients Market Share by Company, 2023
4.1.2. Product Offerings of Leading Food Flavor Ingredients Companies
4.2. Market Entropy
4.2.1. New Product Launches in the Industry
4.2.2. Mergers, Acquisitions, Joint ventures, and Partnerships
4.3. Key Strategies and Best Practices
Chapter 5. Global Market Projections: Best, Reference, and Low Case Scenarios
5.1. Growth Analysis- Case Scenario Definitions
5.2. Low Growth Case Scenario Forecasts
5.3. Reference Growth Case Scenario Forecasts
5.4. High Growth Case Scenario Forecasts
Chapter 6. Market Dynamics
6.1. Food Flavor Ingredients Market Drivers
6.2. Food Flavor Ingredients Market Challenges
6.6. Food Flavor Ingredients Market Opportunities
6.4. Food Flavor Ingredients Market Trends
Chapter 7. Global Food Flavor Ingredients Market Outlook Trends
7.1. Global Food Flavor Ingredients Revenue (USD Million) and CAGR (%) by Type (2021-2032)
7.2. Global Food Flavor Ingredients Revenue (USD Million) and CAGR (%) by Application (2021-2032)
7.3. Global Food Flavor Ingredients Revenue (USD Million) and CAGR (%) by Product (2021-2032)
By Type
Monosodium Glutamate (MSG)
Hydrolyzed Vegetable Protein (HVP)
Yeast Extract
Others
By Application
Food Processing
Restaurants
Residential
Others
Chapter 8. Global Food Flavor Ingredients Regional Analysis and Outlook
8.1. Global Food Flavor Ingredients Revenue (USD Million) By Regions (2021- 2032)
8.2. North America Food Flavor Ingredients Revenue (USD Million) by Country (2021-2032)
8.2.1. United States Food Flavor Ingredients Regional Analysis and Outlook
8.2.2. Canada Food Flavor Ingredients Regional Analysis and Outlook
8.2.3. Mexico Food Flavor Ingredients Regional Analysis and Outlook
8.3. Europe Food Flavor Ingredients Revenue (USD Million), by Country (2021-2032)
8.3.1. Germany Food Flavor Ingredients Regional Analysis and Outlook
8.3.2. France Food Flavor Ingredients Regional Analysis and Outlook
8.3.3. United Kingdom Food Flavor Ingredients Regional Analysis and Outlook
8.3.4. Spain Food Flavor Ingredients Regional Analysis and Outlook
8.3.5. Italy Food Flavor Ingredients Regional Analysis and Outlook
8.3.6. Russia Food Flavor Ingredients Regional Analysis and Outlook
8.3.7. Rest of Europe Food Flavor Ingredients Regional Analysis and Outlook
8.4. Asia Pacific Food Flavor Ingredients Revenue (USD Million) by Country (2021-2032)
8.4.1. China Food Flavor Ingredients Regional Analysis and Outlook
8.4.2. Japan Food Flavor Ingredients Regional Analysis and Outlook
8.4.3. India Food Flavor Ingredients Regional Analysis and Outlook
8.4.4. South Korea Food Flavor Ingredients Regional Analysis and Outlook
8.4.5. Australia Food Flavor Ingredients Regional Analysis and Outlook
8.4.6. South East Asia Food Flavor Ingredients Regional Analysis and Outlook
8.4.7. Rest of Asia Pacific Food Flavor Ingredients Regional Analysis and Outlook
8.5. South America Food Flavor Ingredients Revenue (USD Million), by Country (2021-2032)
8.5.1. Brazil Food Flavor Ingredients Regional Analysis and Outlook
8.5.2. Argentina Food Flavor Ingredients Regional Analysis and Outlook
8.5.3. Rest of South America Food Flavor Ingredients Regional Analysis and Outlook
8.6. Middle East and Africa Food Flavor Ingredients Revenue (USD Million) by Country (2021-2032)
8.6.1. Middle East Food Flavor Ingredients Regional Analysis and Outlook
8.6.2. Africa Food Flavor Ingredients Regional Analysis and Outlook
Chapter 9. North America Food Flavor Ingredients Analysis and Outlook
9.1. North America Food Flavor Ingredients Revenue (USD Million) by Segments (2021-2032)
9.1.1. North America Food Flavor Ingredients Revenue (USD Million) by Type (2021-2032)
9.1.2. North America Food Flavor Ingredients Revenue (USD Million) by Application (2021-2032)
9.1.3. North America Food Flavor Ingredients Revenue (USD Million) by Product (2021-2032)
By Type
Monosodium Glutamate (MSG)
Hydrolyzed Vegetable Protein (HVP)
Yeast Extract
Others
By Application
Food Processing
Restaurants
Residential
Others
Chapter 10. Europe Food Flavor Ingredients Analysis and Outlook
10.1. Europe Food Flavor Ingredients Revenue (USD Million), by Segments (USD Million) (2021-2032)
10.1.1. Europe Food Flavor Ingredients Revenue (USD Million) by Type (2021-2032)
10.1.2. Europe Food Flavor Ingredients Revenue (USD Million) by Application (2021-2032)
10.1.3. Europe Food Flavor Ingredients Revenue (USD Million) by Product (2021-2032)
By Type
Monosodium Glutamate (MSG)
Hydrolyzed Vegetable Protein (HVP)
Yeast Extract
Others
By Application
Food Processing
Restaurants
Residential
Others
Chapter 11. Asia Pacific Food Flavor Ingredients Analysis and Outlook
11.1. Asia Pacific Food Flavor Ingredients Revenue (USD Million), and Revenue (USD Million) by Segments (2021-2032)
11.1.1. Asia Pacific Food Flavor Ingredients Revenue (USD Million) by Type (2021-2032)
11.1.2. Asia Pacific Food Flavor Ingredients Revenue (USD Million) by Application (2021-2032)
11.1.3. Asia Pacific Food Flavor Ingredients Revenue (USD Million) by Product (2021-2032)
By Type
Monosodium Glutamate (MSG)
Hydrolyzed Vegetable Protein (HVP)
Yeast Extract
Others
By Application
Food Processing
Restaurants
Residential
Others
Chapter 12. South America Food Flavor Ingredients Analysis and Outlook
12.1. South America Food Flavor Ingredients Revenue (USD Million), by Segments (2021-2032)
12.1.1. South America Food Flavor Ingredients Revenue (USD Million) by Type (2021-2032)
12.1.2. South America Food Flavor Ingredients Revenue (USD Million) by Application (2021-2032)
12.1.3. South America Food Flavor Ingredients Revenue (USD Million) by Product (2021-2032)
By Type
Monosodium Glutamate (MSG)
Hydrolyzed Vegetable Protein (HVP)
Yeast Extract
Others
By Application
Food Processing
Restaurants
Residential
Others
Chapter 13. Middle East and Africa Food Flavor Ingredients Analysis and Outlook
13.1. Middle East and Africa Food Flavor Ingredients Revenue (USD Million), by Segments (2021-2032)
13.1.1. Middle East and Africa Food Flavor Ingredients Revenue (USD Million) by Type (2021-2032)
13.1.2. Middle East and Africa Food Flavor Ingredients Revenue (USD Million) by Application (2021-2032)
13.1.3. Middle East and Africa Food Flavor Ingredients Revenue (USD Million) by Product (2021-2032)
By Type
Monosodium Glutamate (MSG)
Hydrolyzed Vegetable Protein (HVP)
Yeast Extract
Others
By Application
Food Processing
Restaurants
Residential
Others
Chapter 14. Food Flavor Ingredients Company Profiles
14.1 Business Overview
14.2 Product Profiles
14.3 SWOT Profiles
14.5 Recent Developments
14.6 Financial Profile
List of Companies
ABF Group
AIPU Food
Ajinomoto Group
Angel Yeast
Biospringer
Eppen
Fufeng
Innova
Meihua
Royal DSM N.V.
15. Methodology and Data Sources
15.1 Customization Offerings
15.2 Subscription Services
15.3 Related Reports
15.4 Publisher Expertise
LIST OF TABLES
Table 1 Market Segmentation Analysis
Table 2 Global Food Flavor Ingredients Market Share of Leading Companies, 2023
Table 3 Product Offerings of Leading Companies
Table 4 Low Growth Scenario Forecasts
Table 5 Reference Case Growth Scenario
Table 6 High Growth Case Scenario
Table 7 Global Food Flavor Ingredients Revenue (USD Million) And CAGR (%) By Type (2021-2032)
Table 8 Global Food Flavor Ingredients Revenue (USD Million) And CAGR (%) By Application (2021-2032)
Table 9 Global Food Flavor Ingredients Revenue (USD Million) And CAGR (%) By Product (2021-2032)
Table 10 Global Food Flavor Ingredients Market Revenue (USD Million) By Regions (2021-2032)
Table 11 Global Food Flavor Ingredients Market Share (%) By Regions (2021-2032)
Table 12 North America Food Flavor Ingredients Revenue (USD Million) By Country (2021-2032)
Table 13 Europe Food Flavor Ingredients Revenue (USD Million) By Country (2021-2032)
Table 14 Asia Pacific Food Flavor Ingredients Revenue (USD Million) By Country (2021-2032)
Table 15 South America Food Flavor Ingredients Revenue (USD Million) By Country (2021-2032)
Table 16 Middle East and Africa Food Flavor Ingredients Revenue (USD Million) By Region (2021-2032)
Table 17 North America Food Flavor Ingredients Revenue (USD Million) By Type (2021-2032)
Table 18 North America Food Flavor Ingredients Revenue (USD Million) By Application (2021-2032)
Table 19 North America Food Flavor Ingredients Revenue (USD Million) By Product (2021-2032)
Table 20 Europe Food Flavor Ingredients Revenue (USD Million) By Type (2021-2032)
Table 21 Europe Food Flavor Ingredients Revenue (USD Million) By Application (2021-2032)
Table 22 Europe Food Flavor Ingredients Revenue (USD Million) By Product (2021-2032)
Table 23 Asia Pacific Food Flavor Ingredients Revenue (USD Million) By Type (2021-2032)
Table 24 Asia Pacific Food Flavor Ingredients Revenue (USD Million) By Application (2021-2032)
Table 25 Asia Pacific Food Flavor Ingredients Revenue (USD Million) By Product (2021-2032)
Table 26 South America Food Flavor Ingredients Revenue (USD Million) By Type (2021-2032)
Table 27 South America Food Flavor Ingredients Revenue (USD Million) By Application (2021-2032)
Table 28 South America Food Flavor Ingredients Revenue (USD Million) By Product (2021-2032)
Table 29 Middle East and Africa Food Flavor Ingredients Revenue (USD Million) By Type (2021-2032)
Table 30 Middle East and Africa Food Flavor Ingredients Revenue (USD Million) By Application (2021-2032)
Table 31 Middle East and Africa Food Flavor Ingredients Revenue (USD Million) By Product (2021-2032)
LIST OF FIGURES
Figure 1. Market Scope
Figure 2. Pricing Forecasts Per Unit, 2023- 2032
Figure 3. Porter’s Five Forces
Figure 4. Global Food Flavor Ingredients Market Revenue (USD Million) By Regions (2021-2032)
Figure 5. Global Food Flavor Ingredients Market Share (%) By Regions (2023)
Figure 6. North America Food Flavor Ingredients Revenue (USD Million) By Country (2021-2032)
Figure 7. United States Food Flavor Ingredients Revenue (USD Million) By Country (2021-2032)
Figure 8. Canada Food Flavor Ingredients Revenue (USD Million) By Country (2021-2032)
Figure 9. Mexico Food Flavor Ingredients Revenue (USD Million) By Country (2021-2032)
Figure 10. Europe Food Flavor Ingredients Revenue (USD Million) By Country (2021-2032)
Figure 11. Germany Food Flavor Ingredients Revenue (USD Million) By Country (2021-2032)
Figure 12. France Food Flavor Ingredients Revenue (USD Million) By Country (2021-2032)
Figure 13. United Kingdom Food Flavor Ingredients Revenue (USD Million) By Country (2021-2032)
Figure 14. Spain Food Flavor Ingredients Revenue (USD Million) By Country (2021-2032)
Figure 15. Italy Food Flavor Ingredients Revenue (USD Million) By Country (2021-2032)
Figure 16. Russia Food Flavor Ingredients Revenue (USD Million) By Country (2021-2032)
Figure 17. Rest of Europe Food Flavor Ingredients Revenue (USD Million) By Country (2021-2032)
Figure 11. Asia Pacific Food Flavor Ingredients Revenue (USD Million) By Country (2021-2032)
Figure 12. China Food Flavor Ingredients Revenue (USD Million) By Country (2021-2032)
Figure 13. Japan Food Flavor Ingredients Revenue (USD Million) By Country (2021-2032)
Figure 14. India Food Flavor Ingredients Revenue (USD Million) By Country (2021-2032)
Figure 15. South Korea Food Flavor Ingredients Revenue (USD Million) By Country (2021-2032)
Figure 16. Australia Food Flavor Ingredients Revenue (USD Million) By Country (2021-2032)
Figure 17. South East Asia Food Flavor Ingredients Revenue (USD Million) By Country (2021-2032)
Figure 18. South America Food Flavor Ingredients Revenue (USD Million) By Country (2021-2032)
Figure 19. Brazil Food Flavor Ingredients Revenue (USD Million) By Country (2021-2032)
Figure 20. Argentina Food Flavor Ingredients Revenue (USD Million) By Country (2021-2032)
Figure 21. Rest of Asia Pacific Food Flavor Ingredients Revenue (USD Million) By Country (2021-2032)
Figure 22. Middle East and Africa Food Flavor Ingredients Revenue (USD Million) By Region (2021-2032)
Figure 23. Saudi Arabia Food Flavor Ingredients Revenue (USD Million) By Region (2021-2032)
Figure 24. The UAE Food Flavor Ingredients Revenue (USD Million) By Region (2021-2032)
Figure 25. Rest of Middle East Food Flavor Ingredients Revenue (USD Million) By Region (2021-2032)
Figure 26. South Africa Food Flavor Ingredients Revenue (USD Million) By Region (2021-2032)
Figure 27. Africa Food Flavor Ingredients Revenue (USD Million) By Region (2021-2032)
Figure 28. North America Food Flavor Ingredients Revenue (USD Million) By Type (2021-2032)
Figure 29. North America Food Flavor Ingredients Revenue (USD Million) By Application (2021-2032)
Figure 30. North America Food Flavor Ingredients Revenue (USD Million) By Product (2021-2032)
Figure 31. Europe Food Flavor Ingredients Revenue (USD Million) By Type (2021-2032)
Figure 32. Europe Food Flavor Ingredients Revenue (USD Million) By Application (2021-2032)
Figure 33. Europe Food Flavor Ingredients Revenue (USD Million) By Product (2021-2032)
Figure 34. Asia Pacific Food Flavor Ingredients Revenue (USD Million) By Type (2021-2032)
Figure 35. Asia Pacific Food Flavor Ingredients Revenue (USD Million) By Application (2021-2032)
Figure 36. Asia Pacific Food Flavor Ingredients Revenue (USD Million) By Product (2021-2032)
Figure 37. South America Food Flavor Ingredients Revenue (USD Million) By Type (2021-2032)
Figure 38. South America Food Flavor Ingredients Revenue (USD Million) By Application (2021-2032)
Figure 39. South America Food Flavor Ingredients Revenue (USD Million) By Product (2021-2032)
Figure 40. Middle East and Africa Food Flavor Ingredients Revenue (USD Million) By Type (2021-2032)
Figure 41. Middle East and Africa Food Flavor Ingredients Revenue (USD Million) By Application (2021-2032)
Figure 42. Middle East and Africa Food Flavor Ingredients Revenue (USD Million) By Product (2021-2032)
By Type
Monosodium Glutamate (MSG)
Hydrolyzed Vegetable Protein (HVP)
Yeast Extract
Others
By Application
Food Processing
Restaurants
Residential
Others
Countries Analyzed
North America (US, Canada, Mexico)
Europe (Germany, UK, France, Spain, Italy, Russia, Rest of Europe)
Asia Pacific (China, India, Japan, South Korea, Australia, South East Asia, Rest of Asia)
South America (Brazil, Argentina, Rest of South America)
Middle East and Africa (Saudi Arabia, UAE, Rest of Middle East, South Africa, Egypt, Rest of Africa)
