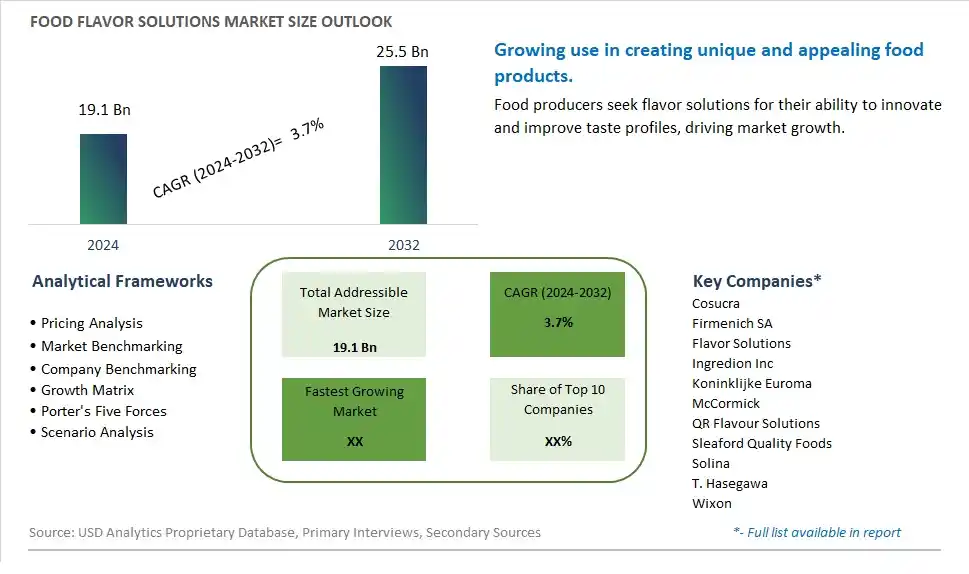
Global Food Flavor Solutions Market Size is valued at $19.1 Billion in 2024 and is forecast to register a growth rate (CAGR) of 3.7% to reach $25.5 Billion by 2032.
The global Food Flavor Solutions Market Comprehensive Study analyzes and forecasts the market size across 6 regions and 24 countries for diverse segments -By Type (Salty Food, Sweet Food), By Application (Food, Beverage, Nutraceutical Industries)
An Introduction to Food Flavor Solutions Market
In 2024, the Food Flavor Solutions market is experiencing significant growth, driven by the rising demand for comprehensive flavor systems that enhance the sensory attributes of food and beverages. Food flavor solutions, which combine various flavor ingredients and enhancers, are used to develop unique and appealing taste profiles. The market benefits from advancements in flavor technology, the growing trend of innovation in food and beverage formulations, and the expansion of the global food industry. Additionally, the increasing consumer preference for high-quality and authentic flavors is contributing to market growth.
Food Flavor Solutions Competitive Landscape
The market report analyses the leading companies in the industry including Cosucra, Firmenich SA, Flavor Solutions, Ingredion Inc, Koninklijke Euroma, McCormick, QR Flavour Solutions, Sleaford Quality Foods, Solina, T. Hasegawa, Wixon, and Others.
Food Flavor Solutions Market Dynamics
Food Flavor Solutions Market Trend: Demand for Customized and Authentic Flavor Experiences
One prominent trend in the food flavor solutions market is the increasing demand for customized and authentic flavor experiences. Consumers are seeking unique and personalized taste sensations that reflect their individual preferences, cultural influences, and culinary adventures. This trend is driven by the desire for sensory exploration, diverse flavor profiles, and memorable dining experiences. Food manufacturers and flavor companies are responding by offering a wide range of flavor solutions, including custom formulations, exotic flavors, regional specialties, and authentic taste recreations, catering to the evolving tastes and preferences of consumers worldwide.
Food Flavor Solutions Market Driver: Innovation in Flavor Creation and Application Technologies
A key driver propelling the food flavor solutions market is innovation in flavor creation and application technologies. Advancements in flavor science, ingredient sourcing, extraction methods, and encapsulation techniques enable the development of complex and robust flavor profiles that enhance product appeal and consumer satisfaction. The driver behind this trend is the continuous pursuit of flavor excellence, product differentiation, and market competitiveness through innovative flavor solutions that deliver authentic taste experiences, improve product formulations, and meet the diverse needs of food and beverage manufacturers across various sectors.
Food Flavor Solutions Market Opportunity: Expansion into Health-Conscious and Functional Flavors
A significant opportunity in the food flavor solutions market lies in the expansion into health-conscious and functional flavors that offer added value and nutritional benefits. Companies can capitalize on this opportunity by developing flavors enriched with functional ingredients such as vitamins, antioxidants, probiotics, or plant-based extracts, catering to the growing demand for functional foods and beverages. Additionally, there's potential for creating flavors with specific health claims or functional properties, such as immunity-boosting flavors, energy-enhancing flavors, or gut health-supporting flavors, aligning with consumer trends towards wellness-oriented products. By focusing on innovation in health-conscious flavor solutions, companies can tap into new market segments, differentiate their offerings, and contribute to the development of flavorful yet beneficial food and beverage options.
Food Flavor Solutions Market Share Analysis: Sweet Food segment generated the highest revenue share in the industry
In the Food Flavor Solutions Market, the Sweet Food segment emerges as the largest category. Sweet flavors are integral to a wide array of food and beverage products, ranging from desserts and confectioneries to beverages and baked goods. The popularity of sweet flavors is driven by consumer preferences for indulgent and enjoyable taste experiences. Manufacturers continuously innovate to meet evolving consumer demands for natural and authentic sweet flavors, while also addressing health and wellness trends by offering reduced sugar and natural sweetener alternatives. Sweet food flavors not only enhance the sensory appeal of products but also play a crucial role in product differentiation and brand positioning in the competitive food industry. As consumer awareness of flavor profiles expands and globalization influences culinary preferences, the sweet food segment remains robust with sustained growth potential, supported by innovations in flavor technology and consumer-driven product development strategies.
Food Flavor Solutions Market Share Analysis: Beverage is the fastest growing segment over the forecast period to 2032
Within the Food Flavor Solutions Market, the Beverage segment stands out as the fastest-growing category projected to 2032. This growth is driven by several key factors influencing consumer preferences and industry trends. Beverages encompass a diverse range of products including soft drinks, juices, energy drinks, alcoholic beverages, and functional beverages like health drinks and sports beverages. The demand for innovative and appealing flavor profiles in beverages is increasing as consumers seek unique taste experiences and healthier options. Manufacturers are responding by introducing new flavors, often incorporating natural ingredients and reducing sugar content to align with health-conscious consumer trends. Further, the rise of premiumization in beverages, driven by urbanization, higher disposable incomes, and changing lifestyles, further accelerates the adoption of sophisticated flavor solutions. As beverage consumption patterns evolve globally, driven by cultural influences and regional tastes, the beverage segment in food flavor solutions is poised for substantial growth with ongoing innovations and strategic market expansions.
Food Flavor Solutions Market Segmentation
By Type
Salty Food
Sweet Food
By Application
Food
Beverage
Nutraceutical Industries
Countries Analyzed
North America (US, Canada, Mexico)
Europe (Germany, UK, France, Spain, Italy, Russia, Rest of Europe)
Asia Pacific (China, India, Japan, South Korea, Australia, South East Asia, Rest of Asia)
South America (Brazil, Argentina, Rest of South America)
Middle East and Africa (Saudi Arabia, UAE, Rest of Middle East, South Africa, Egypt, Rest of Africa)
Food Flavor Solutions Companies Profiled in the Study
Cosucra
Firmenich SA
Flavor Solutions
Ingredion Inc
Koninklijke Euroma
McCormick
QR Flavour Solutions
Sleaford Quality Foods
Solina
T. Hasegawa
Wixon
*- List Not Exhaustive
Chapter 1. TABLE OF CONTENTS
Chapter 2. Introduction to Food Flavor Solutions Market
2.1. Market Overview
2.2. Key Statistics and Report Highlights
2.3. Scope of the Comprehensive Study
2.3.1. Market Definition
2.3.2 Countries and Regions Covered
2.3.3 Research Objective
2.3.4 Units, Currency, and Conversions
2.3.5 Industry Value Chain
2.4. Key Market Segments
2.5. Key Companies
2.6. Study Period
Chapter 3. Strategic Analysis Review
3.1. Food Flavor Solutions Pricing Analysis and Forecast
3.2. Porter’s Five Forces
3.3. Market Ecosystem
3.4. SWOT Analysis
3.5. Regulatory Scenario
3.3. Effects of Inflation, Russia-Ukraine War, moderating economic growth, and other macroeconomic factors
Chapter 4. Competitive Landscape
4.1. Market Share Analysis
4.1.1. Global Food Flavor Solutions Market Share by Company, 2023
4.1.2. Product Offerings of Leading Food Flavor Solutions Companies
4.2. Market Entropy
4.2.1. New Product Launches in the Industry
4.2.2. Mergers, Acquisitions, Joint ventures, and Partnerships
4.3. Key Strategies and Best Practices
Chapter 5. Global Market Projections: Best, Reference, and Low Case Scenarios
5.1. Growth Analysis- Case Scenario Definitions
5.2. Low Growth Case Scenario Forecasts
5.3. Reference Growth Case Scenario Forecasts
5.4. High Growth Case Scenario Forecasts
Chapter 6. Market Dynamics
6.1. Food Flavor Solutions Market Drivers
6.2. Food Flavor Solutions Market Challenges
6.6. Food Flavor Solutions Market Opportunities
6.4. Food Flavor Solutions Market Trends
Chapter 7. Global Food Flavor Solutions Market Outlook Trends
7.1. Global Food Flavor Solutions Revenue (USD Million) and CAGR (%) by Type (2021-2032)
7.2. Global Food Flavor Solutions Revenue (USD Million) and CAGR (%) by Application (2021-2032)
7.3. Global Food Flavor Solutions Revenue (USD Million) and CAGR (%) by Product (2021-2032)
By Type
Salty Food
Sweet Food
By Application
Food
Beverage
Nutraceutical Industries
Chapter 8. Global Food Flavor Solutions Regional Analysis and Outlook
8.1. Global Food Flavor Solutions Revenue (USD Million) By Regions (2021- 2032)
8.2. North America Food Flavor Solutions Revenue (USD Million) by Country (2021-2032)
8.2.1. United States Food Flavor Solutions Regional Analysis and Outlook
8.2.2. Canada Food Flavor Solutions Regional Analysis and Outlook
8.2.3. Mexico Food Flavor Solutions Regional Analysis and Outlook
8.3. Europe Food Flavor Solutions Revenue (USD Million), by Country (2021-2032)
8.3.1. Germany Food Flavor Solutions Regional Analysis and Outlook
8.3.2. France Food Flavor Solutions Regional Analysis and Outlook
8.3.3. United Kingdom Food Flavor Solutions Regional Analysis and Outlook
8.3.4. Spain Food Flavor Solutions Regional Analysis and Outlook
8.3.5. Italy Food Flavor Solutions Regional Analysis and Outlook
8.3.6. Russia Food Flavor Solutions Regional Analysis and Outlook
8.3.7. Rest of Europe Food Flavor Solutions Regional Analysis and Outlook
8.4. Asia Pacific Food Flavor Solutions Revenue (USD Million) by Country (2021-2032)
8.4.1. China Food Flavor Solutions Regional Analysis and Outlook
8.4.2. Japan Food Flavor Solutions Regional Analysis and Outlook
8.4.3. India Food Flavor Solutions Regional Analysis and Outlook
8.4.4. South Korea Food Flavor Solutions Regional Analysis and Outlook
8.4.5. Australia Food Flavor Solutions Regional Analysis and Outlook
8.4.6. South East Asia Food Flavor Solutions Regional Analysis and Outlook
8.4.7. Rest of Asia Pacific Food Flavor Solutions Regional Analysis and Outlook
8.5. South America Food Flavor Solutions Revenue (USD Million), by Country (2021-2032)
8.5.1. Brazil Food Flavor Solutions Regional Analysis and Outlook
8.5.2. Argentina Food Flavor Solutions Regional Analysis and Outlook
8.5.3. Rest of South America Food Flavor Solutions Regional Analysis and Outlook
8.6. Middle East and Africa Food Flavor Solutions Revenue (USD Million) by Country (2021-2032)
8.6.1. Middle East Food Flavor Solutions Regional Analysis and Outlook
8.6.2. Africa Food Flavor Solutions Regional Analysis and Outlook
Chapter 9. North America Food Flavor Solutions Analysis and Outlook
9.1. North America Food Flavor Solutions Revenue (USD Million) by Segments (2021-2032)
9.1.1. North America Food Flavor Solutions Revenue (USD Million) by Type (2021-2032)
9.1.2. North America Food Flavor Solutions Revenue (USD Million) by Application (2021-2032)
9.1.3. North America Food Flavor Solutions Revenue (USD Million) by Product (2021-2032)
By Type
Salty Food
Sweet Food
By Application
Food
Beverage
Nutraceutical Industries
Chapter 10. Europe Food Flavor Solutions Analysis and Outlook
10.1. Europe Food Flavor Solutions Revenue (USD Million), by Segments (USD Million) (2021-2032)
10.1.1. Europe Food Flavor Solutions Revenue (USD Million) by Type (2021-2032)
10.1.2. Europe Food Flavor Solutions Revenue (USD Million) by Application (2021-2032)
10.1.3. Europe Food Flavor Solutions Revenue (USD Million) by Product (2021-2032)
By Type
Salty Food
Sweet Food
By Application
Food
Beverage
Nutraceutical Industries
Chapter 11. Asia Pacific Food Flavor Solutions Analysis and Outlook
11.1. Asia Pacific Food Flavor Solutions Revenue (USD Million), and Revenue (USD Million) by Segments (2021-2032)
11.1.1. Asia Pacific Food Flavor Solutions Revenue (USD Million) by Type (2021-2032)
11.1.2. Asia Pacific Food Flavor Solutions Revenue (USD Million) by Application (2021-2032)
11.1.3. Asia Pacific Food Flavor Solutions Revenue (USD Million) by Product (2021-2032)
By Type
Salty Food
Sweet Food
By Application
Food
Beverage
Nutraceutical Industries
Chapter 12. South America Food Flavor Solutions Analysis and Outlook
12.1. South America Food Flavor Solutions Revenue (USD Million), by Segments (2021-2032)
12.1.1. South America Food Flavor Solutions Revenue (USD Million) by Type (2021-2032)
12.1.2. South America Food Flavor Solutions Revenue (USD Million) by Application (2021-2032)
12.1.3. South America Food Flavor Solutions Revenue (USD Million) by Product (2021-2032)
By Type
Salty Food
Sweet Food
By Application
Food
Beverage
Nutraceutical Industries
Chapter 13. Middle East and Africa Food Flavor Solutions Analysis and Outlook
13.1. Middle East and Africa Food Flavor Solutions Revenue (USD Million), by Segments (2021-2032)
13.1.1. Middle East and Africa Food Flavor Solutions Revenue (USD Million) by Type (2021-2032)
13.1.2. Middle East and Africa Food Flavor Solutions Revenue (USD Million) by Application (2021-2032)
13.1.3. Middle East and Africa Food Flavor Solutions Revenue (USD Million) by Product (2021-2032)
By Type
Salty Food
Sweet Food
By Application
Food
Beverage
Nutraceutical Industries
Chapter 14. Food Flavor Solutions Company Profiles
14.1 Business Overview
14.2 Product Profiles
14.3 SWOT Profiles
14.5 Recent Developments
14.6 Financial Profile
List of Companies
Cosucra
Firmenich SA
Flavor Solutions
Ingredion Inc
Koninklijke Euroma
McCormick
QR Flavour Solutions
Sleaford Quality Foods
Solina
T. Hasegawa
Wixon
15. Methodology and Data Sources
15.1 Customization Offerings
15.2 Subscription Services
15.3 Related Reports
15.4 Publisher Expertise
LIST OF TABLES
Table 1 Market Segmentation Analysis
Table 2 Global Food Flavor Solutions Market Share of Leading Companies, 2023
Table 3 Product Offerings of Leading Companies
Table 4 Low Growth Scenario Forecasts
Table 5 Reference Case Growth Scenario
Table 6 High Growth Case Scenario
Table 7 Global Food Flavor Solutions Revenue (USD Million) And CAGR (%) By Type (2021-2032)
Table 8 Global Food Flavor Solutions Revenue (USD Million) And CAGR (%) By Application (2021-2032)
Table 9 Global Food Flavor Solutions Revenue (USD Million) And CAGR (%) By Product (2021-2032)
Table 10 Global Food Flavor Solutions Market Revenue (USD Million) By Regions (2021-2032)
Table 11 Global Food Flavor Solutions Market Share (%) By Regions (2021-2032)
Table 12 North America Food Flavor Solutions Revenue (USD Million) By Country (2021-2032)
Table 13 Europe Food Flavor Solutions Revenue (USD Million) By Country (2021-2032)
Table 14 Asia Pacific Food Flavor Solutions Revenue (USD Million) By Country (2021-2032)
Table 15 South America Food Flavor Solutions Revenue (USD Million) By Country (2021-2032)
Table 16 Middle East and Africa Food Flavor Solutions Revenue (USD Million) By Region (2021-2032)
Table 17 North America Food Flavor Solutions Revenue (USD Million) By Type (2021-2032)
Table 18 North America Food Flavor Solutions Revenue (USD Million) By Application (2021-2032)
Table 19 North America Food Flavor Solutions Revenue (USD Million) By Product (2021-2032)
Table 20 Europe Food Flavor Solutions Revenue (USD Million) By Type (2021-2032)
Table 21 Europe Food Flavor Solutions Revenue (USD Million) By Application (2021-2032)
Table 22 Europe Food Flavor Solutions Revenue (USD Million) By Product (2021-2032)
Table 23 Asia Pacific Food Flavor Solutions Revenue (USD Million) By Type (2021-2032)
Table 24 Asia Pacific Food Flavor Solutions Revenue (USD Million) By Application (2021-2032)
Table 25 Asia Pacific Food Flavor Solutions Revenue (USD Million) By Product (2021-2032)
Table 26 South America Food Flavor Solutions Revenue (USD Million) By Type (2021-2032)
Table 27 South America Food Flavor Solutions Revenue (USD Million) By Application (2021-2032)
Table 28 South America Food Flavor Solutions Revenue (USD Million) By Product (2021-2032)
Table 29 Middle East and Africa Food Flavor Solutions Revenue (USD Million) By Type (2021-2032)
Table 30 Middle East and Africa Food Flavor Solutions Revenue (USD Million) By Application (2021-2032)
Table 31 Middle East and Africa Food Flavor Solutions Revenue (USD Million) By Product (2021-2032)
LIST OF FIGURES
Figure 1. Market Scope
Figure 2. Pricing Forecasts Per Unit, 2023- 2032
Figure 3. Porter’s Five Forces
Figure 4. Global Food Flavor Solutions Market Revenue (USD Million) By Regions (2021-2032)
Figure 5. Global Food Flavor Solutions Market Share (%) By Regions (2023)
Figure 6. North America Food Flavor Solutions Revenue (USD Million) By Country (2021-2032)
Figure 7. United States Food Flavor Solutions Revenue (USD Million) By Country (2021-2032)
Figure 8. Canada Food Flavor Solutions Revenue (USD Million) By Country (2021-2032)
Figure 9. Mexico Food Flavor Solutions Revenue (USD Million) By Country (2021-2032)
Figure 10. Europe Food Flavor Solutions Revenue (USD Million) By Country (2021-2032)
Figure 11. Germany Food Flavor Solutions Revenue (USD Million) By Country (2021-2032)
Figure 12. France Food Flavor Solutions Revenue (USD Million) By Country (2021-2032)
Figure 13. United Kingdom Food Flavor Solutions Revenue (USD Million) By Country (2021-2032)
Figure 14. Spain Food Flavor Solutions Revenue (USD Million) By Country (2021-2032)
Figure 15. Italy Food Flavor Solutions Revenue (USD Million) By Country (2021-2032)
Figure 16. Russia Food Flavor Solutions Revenue (USD Million) By Country (2021-2032)
Figure 17. Rest of Europe Food Flavor Solutions Revenue (USD Million) By Country (2021-2032)
Figure 11. Asia Pacific Food Flavor Solutions Revenue (USD Million) By Country (2021-2032)
Figure 12. China Food Flavor Solutions Revenue (USD Million) By Country (2021-2032)
Figure 13. Japan Food Flavor Solutions Revenue (USD Million) By Country (2021-2032)
Figure 14. India Food Flavor Solutions Revenue (USD Million) By Country (2021-2032)
Figure 15. South Korea Food Flavor Solutions Revenue (USD Million) By Country (2021-2032)
Figure 16. Australia Food Flavor Solutions Revenue (USD Million) By Country (2021-2032)
Figure 17. South East Asia Food Flavor Solutions Revenue (USD Million) By Country (2021-2032)
Figure 18. South America Food Flavor Solutions Revenue (USD Million) By Country (2021-2032)
Figure 19. Brazil Food Flavor Solutions Revenue (USD Million) By Country (2021-2032)
Figure 20. Argentina Food Flavor Solutions Revenue (USD Million) By Country (2021-2032)
Figure 21. Rest of Asia Pacific Food Flavor Solutions Revenue (USD Million) By Country (2021-2032)
Figure 22. Middle East and Africa Food Flavor Solutions Revenue (USD Million) By Region (2021-2032)
Figure 23. Saudi Arabia Food Flavor Solutions Revenue (USD Million) By Region (2021-2032)
Figure 24. The UAE Food Flavor Solutions Revenue (USD Million) By Region (2021-2032)
Figure 25. Rest of Middle East Food Flavor Solutions Revenue (USD Million) By Region (2021-2032)
Figure 26. South Africa Food Flavor Solutions Revenue (USD Million) By Region (2021-2032)
Figure 27. Africa Food Flavor Solutions Revenue (USD Million) By Region (2021-2032)
Figure 28. North America Food Flavor Solutions Revenue (USD Million) By Type (2021-2032)
Figure 29. North America Food Flavor Solutions Revenue (USD Million) By Application (2021-2032)
Figure 30. North America Food Flavor Solutions Revenue (USD Million) By Product (2021-2032)
Figure 31. Europe Food Flavor Solutions Revenue (USD Million) By Type (2021-2032)
Figure 32. Europe Food Flavor Solutions Revenue (USD Million) By Application (2021-2032)
Figure 33. Europe Food Flavor Solutions Revenue (USD Million) By Product (2021-2032)
Figure 34. Asia Pacific Food Flavor Solutions Revenue (USD Million) By Type (2021-2032)
Figure 35. Asia Pacific Food Flavor Solutions Revenue (USD Million) By Application (2021-2032)
Figure 36. Asia Pacific Food Flavor Solutions Revenue (USD Million) By Product (2021-2032)
Figure 37. South America Food Flavor Solutions Revenue (USD Million) By Type (2021-2032)
Figure 38. South America Food Flavor Solutions Revenue (USD Million) By Application (2021-2032)
Figure 39. South America Food Flavor Solutions Revenue (USD Million) By Product (2021-2032)
Figure 40. Middle East and Africa Food Flavor Solutions Revenue (USD Million) By Type (2021-2032)
Figure 41. Middle East and Africa Food Flavor Solutions Revenue (USD Million) By Application (2021-2032)
Figure 42. Middle East and Africa Food Flavor Solutions Revenue (USD Million) By Product (2021-2032)
By Type
Salty Food
Sweet Food
By Application
Food
Beverage
Nutraceutical Industries
Countries Analyzed
North America (US, Canada, Mexico)
Europe (Germany, UK, France, Spain, Italy, Russia, Rest of Europe)
Asia Pacific (China, India, Japan, South Korea, Australia, South East Asia, Rest of Asia)
South America (Brazil, Argentina, Rest of South America)
Middle East and Africa (Saudi Arabia, UAE, Rest of Middle East, South Africa, Egypt, Rest of Africa)
