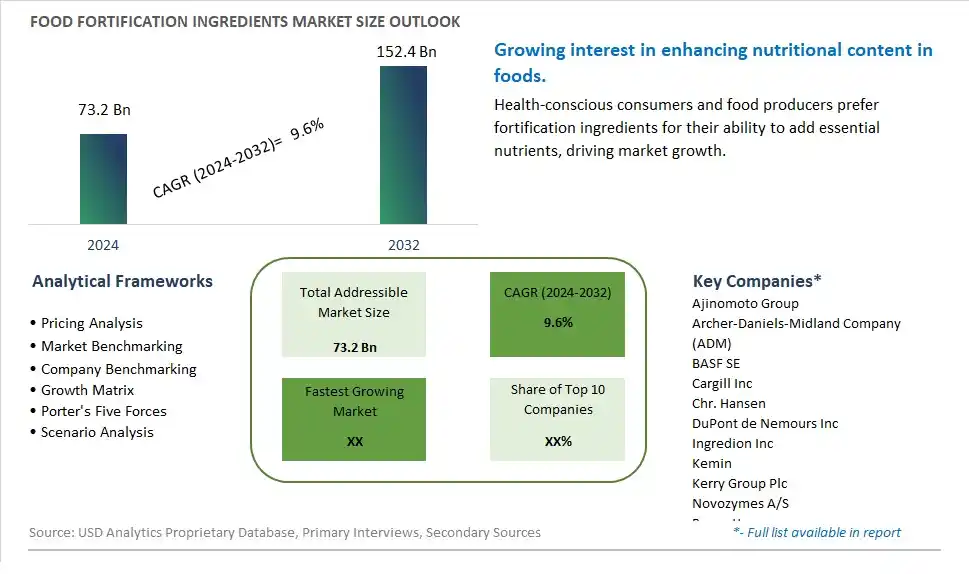
Global Food Fortification Ingredients Market Size is valued at $73.2 Billion in 2024 and is forecast to register a growth rate (CAGR) of 9.6% to reach $152.4 Billion by 2032.
The global Food Fortification Ingredients Market Comprehensive Study analyzes and forecasts the market size across 6 regions and 24 countries for diverse segments -By Type (Minerals, Vitamins, Probiotics, Others), By Application (Dairy Products, Beverages, Cereal & Cereal Products, Confectionery, Dietary Supplements, Others)
An Introduction to Food Fortification Ingredients Market
The Food Fortification Ingredients market in 2024 is experiencing significant growth, driven by the increasing demand for ingredients that enhance the nutritional value of food products. Fortification ingredients, including vitamins, minerals, and amino acids, are added to foods to address nutritional deficiencies and improve public health. The market benefits from advancements in fortification technologies, the growing trend of health and wellness, and the expansion of the functional food and beverage sectors. Additionally, the increasing focus on combating malnutrition and promoting nutrient-rich diets is contributing to market growth.
Food Fortification Ingredients Competitive Landscape
The market report analyses the leading companies in the industry including Ajinomoto Group, Archer-Daniels-Midland Company (ADM), BASF SE, Cargill Inc, Chr. Hansen, DuPont de Nemours Inc, Ingredion Inc, Kemin, Kerry Group Plc, Novozymes A/S, Roquette, Tate & Lyle PLC, and Others.
Food Fortification Ingredients Market Dynamics
Food Fortification Ingredients Market Trend: Focus on Nutrient Enrichment and Health Promotion
One prominent trend in the food fortification ingredients market is the focus on nutrient enrichment and health promotion. With increasing awareness of nutritional deficiencies and the role of diet in maintaining overall health, consumers are seeking food products fortified with essential vitamins, minerals, and functional nutrients. This trend is driven by the growing interest in preventive healthcare, wellness-oriented lifestyles, and the desire for convenient and accessible sources of key nutrients. Food fortification ingredients address this trend by providing manufacturers with options to enrich their products with targeted nutrients, improve nutritional profiles, and meet consumer demands for fortified foods that support health and well-being.
Food Fortification Ingredients Market Driver: Public Health Initiatives and Regulatory Requirements
A key driver propelling the food fortification ingredients market is public health initiatives and regulatory requirements aimed at addressing nutritional deficiencies and improving population health. Governments, healthcare organizations, and public health agencies advocate for food fortification as a cost-effective strategy to combat micronutrient deficiencies and reduce the prevalence of nutrition-related diseases. Regulatory mandates and guidelines require food manufacturers to fortify certain staple foods or products with essential nutrients such as vitamins, minerals, and folic acid to ensure adequate nutrient intake and promote public health. The driver behind this trend is the recognition of food fortification as a proven intervention to enhance nutritional status, prevent deficiencies, and support optimal health outcomes across populations.
Food Fortification Ingredients Market Opportunity: Expansion into Functional and Specialty Fortification Ingredients
A significant opportunity in the food fortification ingredients market lies in the expansion into functional and specialty fortification ingredients that offer targeted health benefits and meet evolving consumer needs. Companies can capitalize on this opportunity by developing fortification ingredients enriched with bioactive compounds, antioxidants, probiotics, omega-3 fatty acids, and plant-based extracts that provide additional health-promoting properties. Additionally, there's potential for offering fortification solutions tailored to specific dietary preferences, lifestyles, and health concerns, such as fortified plant-based alternatives, gluten-free fortification options, and fortified sports nutrition products. By innovating in functional fortification ingredients, companies can differentiate their offerings, address niche markets, and contribute to the development of fortified foods that cater to diverse consumer preferences and health goals.
Food Fortification Ingredients Market Share Analysis: Vitamins segment generated the highest revenue share in the industry
In the Food Fortification Ingredients Market, the Vitamins segment stands out as the largest. Vitamins are essential micronutrients that play crucial roles in maintaining overall health and preventing deficiencies. They are widely used in fortifying various food and beverage products to enhance their nutritional value. Vitamins such as Vitamin A, Vitamin C, Vitamin D, and various B vitamins are added to foods like cereals, dairy products, beverages, and infant formulas to address dietary deficiencies and support specific health benefits. For instance, Vitamin D is commonly added to dairy products to support bone health, while Vitamin C is included in beverages and foods to boost immune function. The demand for fortified foods enriched with vitamins is driven by increasing consumer awareness of nutrition, rising health consciousness, and the growing prevalence of vitamin deficiencies globally. As regulatory bodies emphasize the importance of fortification to address public health challenges, the vitamins segment continues to experience robust growth. Manufacturers are innovating with new formulations and delivery systems to meet diverse consumer preferences and health needs, further fueling the expansion of the vitamins segment in the Food Fortification Ingredients market.
Food Fortification Ingredients Market Share Analysis: Dietary Supplements is the fastest growing segment over the forecast period to 2032
Within the Food Fortification Ingredients Market, the Dietary Supplements segment emerges as the fastest-growing to 2032. Dietary supplements fortified with essential nutrients like vitamins, minerals, and probiotics are gaining significant traction among health-conscious consumers globally. These supplements cater to individuals seeking convenient ways to meet their daily nutritional requirements, especially in scenarios where diet alone may not suffice. The rising trend towards preventive healthcare and proactive wellness initiatives drives the demand for dietary supplements fortified with specific nutrients. Key factors influencing this growth include aging populations in developed regions, increasing disposable incomes, and a growing preference for personalized nutrition solutions. Manufacturers are increasingly focusing on developing fortified supplements tailored to address specific health concerns such as immunity support, bone health, and digestive wellness. Further, regulatory support for fortified dietary supplements in various markets further propels market expansion. As consumers continue to prioritize health and wellness, the dietary supplements segment is poised for robust growth in the Food Fortification Ingredients market, presenting ample opportunities for innovation and market penetration.
Food Fortification Ingredients Market Segmentation
By Type
Minerals
Vitamins
Probiotics
Others
By Application
Dairy Products
Beverages
Cereal & Cereal Products
Confectionery
Dietary Supplements
Others
Countries Analyzed
North America (US, Canada, Mexico)
Europe (Germany, UK, France, Spain, Italy, Russia, Rest of Europe)
Asia Pacific (China, India, Japan, South Korea, Australia, South East Asia, Rest of Asia)
South America (Brazil, Argentina, Rest of South America)
Middle East and Africa (Saudi Arabia, UAE, Rest of Middle East, South Africa, Egypt, Rest of Africa)
Food Fortification Ingredients Companies Profiled in the Study
Ajinomoto Group
Archer-Daniels-Midland Company (ADM)
BASF SE
Cargill Inc
Chr. Hansen
DuPont de Nemours Inc
Ingredion Inc
Kemin
Kerry Group Plc
Novozymes A/S
Roquette
Tate & Lyle PLC
*- List Not Exhaustive
Chapter 1. TABLE OF CONTENTS
Chapter 2. Introduction to Food Fortification Ingredients Market
2.1. Market Overview
2.2. Key Statistics and Report Highlights
2.3. Scope of the Comprehensive Study
2.3.1. Market Definition
2.3.2 Countries and Regions Covered
2.3.3 Research Objective
2.3.4 Units, Currency, and Conversions
2.3.5 Industry Value Chain
2.4. Key Market Segments
2.5. Key Companies
2.6. Study Period
Chapter 3. Strategic Analysis Review
3.1. Food Fortification Ingredients Pricing Analysis and Forecast
3.2. Porter’s Five Forces
3.3. Market Ecosystem
3.4. SWOT Analysis
3.5. Regulatory Scenario
3.3. Effects of Inflation, Russia-Ukraine War, moderating economic growth, and other macroeconomic factors
Chapter 4. Competitive Landscape
4.1. Market Share Analysis
4.1.1. Global Food Fortification Ingredients Market Share by Company, 2023
4.1.2. Product Offerings of Leading Food Fortification Ingredients Companies
4.2. Market Entropy
4.2.1. New Product Launches in the Industry
4.2.2. Mergers, Acquisitions, Joint ventures, and Partnerships
4.3. Key Strategies and Best Practices
Chapter 5. Global Market Projections: Best, Reference, and Low Case Scenarios
5.1. Growth Analysis- Case Scenario Definitions
5.2. Low Growth Case Scenario Forecasts
5.3. Reference Growth Case Scenario Forecasts
5.4. High Growth Case Scenario Forecasts
Chapter 6. Market Dynamics
6.1. Food Fortification Ingredients Market Drivers
6.2. Food Fortification Ingredients Market Challenges
6.6. Food Fortification Ingredients Market Opportunities
6.4. Food Fortification Ingredients Market Trends
Chapter 7. Global Food Fortification Ingredients Market Outlook Trends
7.1. Global Food Fortification Ingredients Revenue (USD Million) and CAGR (%) by Type (2021-2032)
7.2. Global Food Fortification Ingredients Revenue (USD Million) and CAGR (%) by Application (2021-2032)
7.3. Global Food Fortification Ingredients Revenue (USD Million) and CAGR (%) by Product (2021-2032)
By Type
Minerals
Vitamins
Probiotics
Others
By Application
Dairy Products
Beverages
Cereal & Cereal Products
Confectionery
Dietary Supplements
Others
Chapter 8. Global Food Fortification Ingredients Regional Analysis and Outlook
8.1. Global Food Fortification Ingredients Revenue (USD Million) By Regions (2021- 2032)
8.2. North America Food Fortification Ingredients Revenue (USD Million) by Country (2021-2032)
8.2.1. United States Food Fortification Ingredients Regional Analysis and Outlook
8.2.2. Canada Food Fortification Ingredients Regional Analysis and Outlook
8.2.3. Mexico Food Fortification Ingredients Regional Analysis and Outlook
8.3. Europe Food Fortification Ingredients Revenue (USD Million), by Country (2021-2032)
8.3.1. Germany Food Fortification Ingredients Regional Analysis and Outlook
8.3.2. France Food Fortification Ingredients Regional Analysis and Outlook
8.3.3. United Kingdom Food Fortification Ingredients Regional Analysis and Outlook
8.3.4. Spain Food Fortification Ingredients Regional Analysis and Outlook
8.3.5. Italy Food Fortification Ingredients Regional Analysis and Outlook
8.3.6. Russia Food Fortification Ingredients Regional Analysis and Outlook
8.3.7. Rest of Europe Food Fortification Ingredients Regional Analysis and Outlook
8.4. Asia Pacific Food Fortification Ingredients Revenue (USD Million) by Country (2021-2032)
8.4.1. China Food Fortification Ingredients Regional Analysis and Outlook
8.4.2. Japan Food Fortification Ingredients Regional Analysis and Outlook
8.4.3. India Food Fortification Ingredients Regional Analysis and Outlook
8.4.4. South Korea Food Fortification Ingredients Regional Analysis and Outlook
8.4.5. Australia Food Fortification Ingredients Regional Analysis and Outlook
8.4.6. South East Asia Food Fortification Ingredients Regional Analysis and Outlook
8.4.7. Rest of Asia Pacific Food Fortification Ingredients Regional Analysis and Outlook
8.5. South America Food Fortification Ingredients Revenue (USD Million), by Country (2021-2032)
8.5.1. Brazil Food Fortification Ingredients Regional Analysis and Outlook
8.5.2. Argentina Food Fortification Ingredients Regional Analysis and Outlook
8.5.3. Rest of South America Food Fortification Ingredients Regional Analysis and Outlook
8.6. Middle East and Africa Food Fortification Ingredients Revenue (USD Million) by Country (2021-2032)
8.6.1. Middle East Food Fortification Ingredients Regional Analysis and Outlook
8.6.2. Africa Food Fortification Ingredients Regional Analysis and Outlook
Chapter 9. North America Food Fortification Ingredients Analysis and Outlook
9.1. North America Food Fortification Ingredients Revenue (USD Million) by Segments (2021-2032)
9.1.1. North America Food Fortification Ingredients Revenue (USD Million) by Type (2021-2032)
9.1.2. North America Food Fortification Ingredients Revenue (USD Million) by Application (2021-2032)
9.1.3. North America Food Fortification Ingredients Revenue (USD Million) by Product (2021-2032)
By Type
Minerals
Vitamins
Probiotics
Others
By Application
Dairy Products
Beverages
Cereal & Cereal Products
Confectionery
Dietary Supplements
Others
Chapter 10. Europe Food Fortification Ingredients Analysis and Outlook
10.1. Europe Food Fortification Ingredients Revenue (USD Million), by Segments (USD Million) (2021-2032)
10.1.1. Europe Food Fortification Ingredients Revenue (USD Million) by Type (2021-2032)
10.1.2. Europe Food Fortification Ingredients Revenue (USD Million) by Application (2021-2032)
10.1.3. Europe Food Fortification Ingredients Revenue (USD Million) by Product (2021-2032)
By Type
Minerals
Vitamins
Probiotics
Others
By Application
Dairy Products
Beverages
Cereal & Cereal Products
Confectionery
Dietary Supplements
Others
Chapter 11. Asia Pacific Food Fortification Ingredients Analysis and Outlook
11.1. Asia Pacific Food Fortification Ingredients Revenue (USD Million), and Revenue (USD Million) by Segments (2021-2032)
11.1.1. Asia Pacific Food Fortification Ingredients Revenue (USD Million) by Type (2021-2032)
11.1.2. Asia Pacific Food Fortification Ingredients Revenue (USD Million) by Application (2021-2032)
11.1.3. Asia Pacific Food Fortification Ingredients Revenue (USD Million) by Product (2021-2032)
By Type
Minerals
Vitamins
Probiotics
Others
By Application
Dairy Products
Beverages
Cereal & Cereal Products
Confectionery
Dietary Supplements
Others
Chapter 12. South America Food Fortification Ingredients Analysis and Outlook
12.1. South America Food Fortification Ingredients Revenue (USD Million), by Segments (2021-2032)
12.1.1. South America Food Fortification Ingredients Revenue (USD Million) by Type (2021-2032)
12.1.2. South America Food Fortification Ingredients Revenue (USD Million) by Application (2021-2032)
12.1.3. South America Food Fortification Ingredients Revenue (USD Million) by Product (2021-2032)
By Type
Minerals
Vitamins
Probiotics
Others
By Application
Dairy Products
Beverages
Cereal & Cereal Products
Confectionery
Dietary Supplements
Others
Chapter 13. Middle East and Africa Food Fortification Ingredients Analysis and Outlook
13.1. Middle East and Africa Food Fortification Ingredients Revenue (USD Million), by Segments (2021-2032)
13.1.1. Middle East and Africa Food Fortification Ingredients Revenue (USD Million) by Type (2021-2032)
13.1.2. Middle East and Africa Food Fortification Ingredients Revenue (USD Million) by Application (2021-2032)
13.1.3. Middle East and Africa Food Fortification Ingredients Revenue (USD Million) by Product (2021-2032)
By Type
Minerals
Vitamins
Probiotics
Others
By Application
Dairy Products
Beverages
Cereal & Cereal Products
Confectionery
Dietary Supplements
Others
Chapter 14. Food Fortification Ingredients Company Profiles
14.1 Business Overview
14.2 Product Profiles
14.3 SWOT Profiles
14.5 Recent Developments
14.6 Financial Profile
List of Companies
Ajinomoto Group
Archer-Daniels-Midland Company (ADM)
BASF SE
Cargill Inc
Chr. Hansen
DuPont de Nemours Inc
Ingredion Inc
Kemin
Kerry Group Plc
Novozymes A/S
Roquette
Tate & Lyle PLC
15. Methodology and Data Sources
15.1 Customization Offerings
15.2 Subscription Services
15.3 Related Reports
15.4 Publisher Expertise
LIST OF TABLES
Table 1 Market Segmentation Analysis
Table 2 Global Food Fortification Ingredients Market Share of Leading Companies, 2023
Table 3 Product Offerings of Leading Companies
Table 4 Low Growth Scenario Forecasts
Table 5 Reference Case Growth Scenario
Table 6 High Growth Case Scenario
Table 7 Global Food Fortification Ingredients Revenue (USD Million) And CAGR (%) By Type (2021-2032)
Table 8 Global Food Fortification Ingredients Revenue (USD Million) And CAGR (%) By Application (2021-2032)
Table 9 Global Food Fortification Ingredients Revenue (USD Million) And CAGR (%) By Product (2021-2032)
Table 10 Global Food Fortification Ingredients Market Revenue (USD Million) By Regions (2021-2032)
Table 11 Global Food Fortification Ingredients Market Share (%) By Regions (2021-2032)
Table 12 North America Food Fortification Ingredients Revenue (USD Million) By Country (2021-2032)
Table 13 Europe Food Fortification Ingredients Revenue (USD Million) By Country (2021-2032)
Table 14 Asia Pacific Food Fortification Ingredients Revenue (USD Million) By Country (2021-2032)
Table 15 South America Food Fortification Ingredients Revenue (USD Million) By Country (2021-2032)
Table 16 Middle East and Africa Food Fortification Ingredients Revenue (USD Million) By Region (2021-2032)
Table 17 North America Food Fortification Ingredients Revenue (USD Million) By Type (2021-2032)
Table 18 North America Food Fortification Ingredients Revenue (USD Million) By Application (2021-2032)
Table 19 North America Food Fortification Ingredients Revenue (USD Million) By Product (2021-2032)
Table 20 Europe Food Fortification Ingredients Revenue (USD Million) By Type (2021-2032)
Table 21 Europe Food Fortification Ingredients Revenue (USD Million) By Application (2021-2032)
Table 22 Europe Food Fortification Ingredients Revenue (USD Million) By Product (2021-2032)
Table 23 Asia Pacific Food Fortification Ingredients Revenue (USD Million) By Type (2021-2032)
Table 24 Asia Pacific Food Fortification Ingredients Revenue (USD Million) By Application (2021-2032)
Table 25 Asia Pacific Food Fortification Ingredients Revenue (USD Million) By Product (2021-2032)
Table 26 South America Food Fortification Ingredients Revenue (USD Million) By Type (2021-2032)
Table 27 South America Food Fortification Ingredients Revenue (USD Million) By Application (2021-2032)
Table 28 South America Food Fortification Ingredients Revenue (USD Million) By Product (2021-2032)
Table 29 Middle East and Africa Food Fortification Ingredients Revenue (USD Million) By Type (2021-2032)
Table 30 Middle East and Africa Food Fortification Ingredients Revenue (USD Million) By Application (2021-2032)
Table 31 Middle East and Africa Food Fortification Ingredients Revenue (USD Million) By Product (2021-2032)
LIST OF FIGURES
Figure 1. Market Scope
Figure 2. Pricing Forecasts Per Unit, 2023- 2032
Figure 3. Porter’s Five Forces
Figure 4. Global Food Fortification Ingredients Market Revenue (USD Million) By Regions (2021-2032)
Figure 5. Global Food Fortification Ingredients Market Share (%) By Regions (2023)
Figure 6. North America Food Fortification Ingredients Revenue (USD Million) By Country (2021-2032)
Figure 7. United States Food Fortification Ingredients Revenue (USD Million) By Country (2021-2032)
Figure 8. Canada Food Fortification Ingredients Revenue (USD Million) By Country (2021-2032)
Figure 9. Mexico Food Fortification Ingredients Revenue (USD Million) By Country (2021-2032)
Figure 10. Europe Food Fortification Ingredients Revenue (USD Million) By Country (2021-2032)
Figure 11. Germany Food Fortification Ingredients Revenue (USD Million) By Country (2021-2032)
Figure 12. France Food Fortification Ingredients Revenue (USD Million) By Country (2021-2032)
Figure 13. United Kingdom Food Fortification Ingredients Revenue (USD Million) By Country (2021-2032)
Figure 14. Spain Food Fortification Ingredients Revenue (USD Million) By Country (2021-2032)
Figure 15. Italy Food Fortification Ingredients Revenue (USD Million) By Country (2021-2032)
Figure 16. Russia Food Fortification Ingredients Revenue (USD Million) By Country (2021-2032)
Figure 17. Rest of Europe Food Fortification Ingredients Revenue (USD Million) By Country (2021-2032)
Figure 11. Asia Pacific Food Fortification Ingredients Revenue (USD Million) By Country (2021-2032)
Figure 12. China Food Fortification Ingredients Revenue (USD Million) By Country (2021-2032)
Figure 13. Japan Food Fortification Ingredients Revenue (USD Million) By Country (2021-2032)
Figure 14. India Food Fortification Ingredients Revenue (USD Million) By Country (2021-2032)
Figure 15. South Korea Food Fortification Ingredients Revenue (USD Million) By Country (2021-2032)
Figure 16. Australia Food Fortification Ingredients Revenue (USD Million) By Country (2021-2032)
Figure 17. South East Asia Food Fortification Ingredients Revenue (USD Million) By Country (2021-2032)
Figure 18. South America Food Fortification Ingredients Revenue (USD Million) By Country (2021-2032)
Figure 19. Brazil Food Fortification Ingredients Revenue (USD Million) By Country (2021-2032)
Figure 20. Argentina Food Fortification Ingredients Revenue (USD Million) By Country (2021-2032)
Figure 21. Rest of Asia Pacific Food Fortification Ingredients Revenue (USD Million) By Country (2021-2032)
Figure 22. Middle East and Africa Food Fortification Ingredients Revenue (USD Million) By Region (2021-2032)
Figure 23. Saudi Arabia Food Fortification Ingredients Revenue (USD Million) By Region (2021-2032)
Figure 24. The UAE Food Fortification Ingredients Revenue (USD Million) By Region (2021-2032)
Figure 25. Rest of Middle East Food Fortification Ingredients Revenue (USD Million) By Region (2021-2032)
Figure 26. South Africa Food Fortification Ingredients Revenue (USD Million) By Region (2021-2032)
Figure 27. Africa Food Fortification Ingredients Revenue (USD Million) By Region (2021-2032)
Figure 28. North America Food Fortification Ingredients Revenue (USD Million) By Type (2021-2032)
Figure 29. North America Food Fortification Ingredients Revenue (USD Million) By Application (2021-2032)
Figure 30. North America Food Fortification Ingredients Revenue (USD Million) By Product (2021-2032)
Figure 31. Europe Food Fortification Ingredients Revenue (USD Million) By Type (2021-2032)
Figure 32. Europe Food Fortification Ingredients Revenue (USD Million) By Application (2021-2032)
Figure 33. Europe Food Fortification Ingredients Revenue (USD Million) By Product (2021-2032)
Figure 34. Asia Pacific Food Fortification Ingredients Revenue (USD Million) By Type (2021-2032)
Figure 35. Asia Pacific Food Fortification Ingredients Revenue (USD Million) By Application (2021-2032)
Figure 36. Asia Pacific Food Fortification Ingredients Revenue (USD Million) By Product (2021-2032)
Figure 37. South America Food Fortification Ingredients Revenue (USD Million) By Type (2021-2032)
Figure 38. South America Food Fortification Ingredients Revenue (USD Million) By Application (2021-2032)
Figure 39. South America Food Fortification Ingredients Revenue (USD Million) By Product (2021-2032)
Figure 40. Middle East and Africa Food Fortification Ingredients Revenue (USD Million) By Type (2021-2032)
Figure 41. Middle East and Africa Food Fortification Ingredients Revenue (USD Million) By Application (2021-2032)
Figure 42. Middle East and Africa Food Fortification Ingredients Revenue (USD Million) By Product (2021-2032)
By Type
Minerals
Vitamins
Probiotics
Others
By Application
Dairy Products
Beverages
Cereal & Cereal Products
Confectionery
Dietary Supplements
Others
Countries Analyzed
North America (US, Canada, Mexico)
Europe (Germany, UK, France, Spain, Italy, Russia, Rest of Europe)
Asia Pacific (China, India, Japan, South Korea, Australia, South East Asia, Rest of Asia)
South America (Brazil, Argentina, Rest of South America)
Middle East and Africa (Saudi Arabia, UAE, Rest of Middle East, South Africa, Egypt, Rest of Africa)
