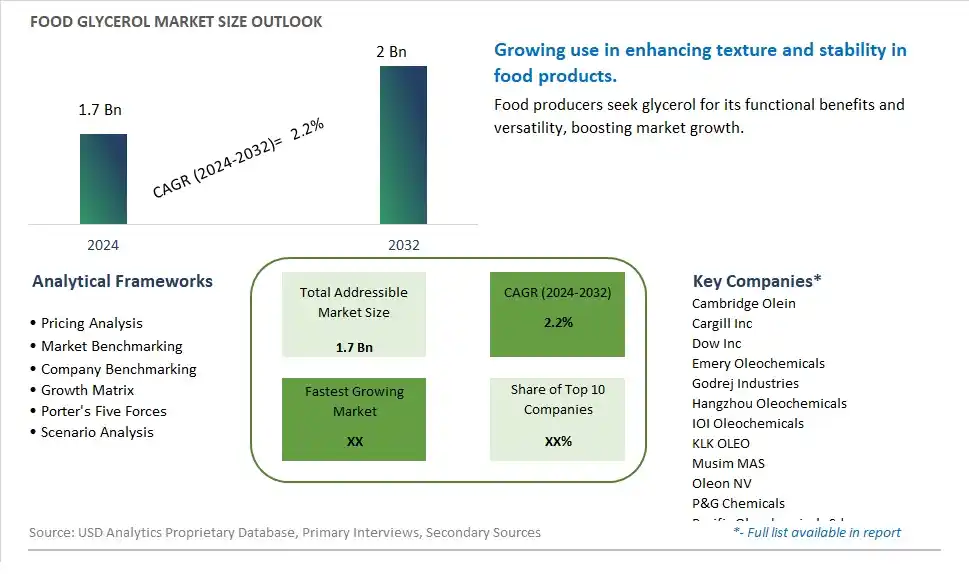
Global Food Glycerol Market Size is valued at $1.7 Billion in 2024 and is forecast to register a growth rate (CAGR) of 2.2% to reach $2 Billion by 2032.
The global Food Glycerol Market Comprehensive Study analyzes and forecasts the market size across 6 regions and 24 countries for diverse segments -By Type (Food Grade, Feed Grade), By Application (Juice, Wine, Meat Product, Pet Food, Others)
An Introduction to Food Glycerol Market
In 2024, the Food Glycerol market is thriving, fueled by the increasing demand for safe and effective humectants and sweeteners in various food applications. Food-grade glycerol, known for its moisturizing properties and ability to retain moisture, is widely used in confectioneries, baked goods, and beverages. The market benefits from advancements in glycerol extraction and purification technologies, the growing trend of health-conscious and natural products, and the expansion of the functional food sector. Additionally, the rising awareness of the benefits of glycerol for texture and shelf life enhancement is driving market growth.
Food Glycerol Competitive Landscape
The market report analyses the leading companies in the industry including Cambridge Olein, Cargill Inc, Dow Inc, Emery Oleochemicals, Godrej Industries, Hangzhou Oleochemicals, IOI Oleochemicals, KLK OLEO, Musim MAS, Oleon NV, P&G Chemicals, Pacific Oleochemicals Sdn, PT SOCI MAS, Qingyuan Futai, Shuangma Chemical, Vance Bioenergy, Vantage Oleochemicals, Wilmar International Ltd, and Others.
Food Glycerol Market Dynamics
Food Glycerol Market Trend: Demand for Low-Calorie and Sugar-Free Alternatives
One prominent trend in the food glycerol market is the increasing demand for low-calorie and sugar-free alternatives in food and beverage products. With rising health consciousness and concerns about sugar intake, consumers are seeking healthier options without compromising on taste. Glycerol, also known as glycerin, serves as a low-calorie sweetener and humectant, making it an attractive ingredient for manufacturers looking to create reduced-sugar and calorie-conscious formulations. This trend is driven by consumer preferences for healthier lifestyles, dietary restrictions, and regulatory pressures encouraging the reduction of added sugars in food products.
Food Glycerol Market Driver: Functional Properties and Versatility in Food Applications
A key driver propelling the food glycerol market is the functional properties and versatility of glycerol in food applications. Glycerol acts as a humectant, stabilizer, and sweetening agent in various food and beverage formulations, contributing to texture enhancement, moisture retention, and overall product quality. Its ability to replace sugar while providing sweetness and functional benefits makes it a valuable ingredient for manufacturers looking to create healthier and more appealing products. The driver behind this trend is the need for functional ingredients that offer multiple benefits and align with consumer preferences for reduced-sugar and lower-calorie food options.
Food Glycerol Market Opportunity: Innovation in Glycerol-Based Sweeteners and Functional Ingredients
A significant opportunity in the food glycerol market lies in innovation in glycerol-based sweeteners and functional ingredients that cater to the growing demand for healthier and functional food products. Companies can capitalize on this opportunity by developing glycerol-based sweeteners, syrups, and blends with enhanced sweetness profiles, improved solubility, and reduced cooling effects compared to traditional sugar alcohols. Additionally, there's potential for creating glycerol-based functional ingredients such as emulsifiers, thickeners, and texturizers that improve product stability, texture, and sensory attributes. By focusing on innovation and offering glycerol-based solutions that meet consumer preferences and industry trends, companies can tap into new market segments, differentiate their products, and contribute to the development of healthier and more functional food formulations.
Food Glycerol Market Share Analysis: Food Grade Glycerol segment generated the highest revenue share in the industry
In the Food Glycerol Market, the Food Grade Glycerol segment emerges as the largest category. Food grade glycerol, also known as glycerin, is widely utilized across various food applications due to its multifunctional properties. It serves as a humectant, solvent, sweetener, and preservative in food products, contributing to moisture retention, texture enhancement, and prolonged shelf life. Food grade glycerol is extensively used in confectionery, baked goods, dairy products, beverages, and processed foods to maintain freshness and quality. Its non-toxic nature and GRAS (Generally Recognized as Safe) status by regulatory bodies globally make it a preferred ingredient in the food industry. Further, increasing consumer awareness and demand for natural and clean-label ingredients further drive the growth of the food grade glycerol market. Manufacturers are innovating with glycerol to meet diverse consumer preferences, including sugar reduction and healthier food formulations, thereby propelling its dominance in the market.
Food Glycerol Market Share Analysis: Pet Food is the fastest growing segment over the forecast period to 2032
In the Food Glycerol Market, the Pet Food segment stands out as the fastest-growing application to 2032. Glycerol, or glycerin, is increasingly being incorporated into pet food formulations due to its beneficial properties and functional benefits. As pet owners prioritize the health and well-being of their pets, demand for nutritious and high-quality pet food products is on the rise. Glycerol serves several purposes in pet food, including as a binder, humectant, and palatability enhancer. It helps to maintain moisture content, improve texture, and enhance the taste of pet food products. Further, glycerol's natural origin and safety profile make it a preferred ingredient in pet food, aligning with the growing consumer preference for natural and clean-label pet products. The pet food industry's expansion, driven by increasing pet ownership and humanization trends, further accelerates the adoption of glycerol in pet food formulations. This trend underscores glycerol's pivotal role in meeting the evolving nutritional needs and preferences of pets worldwide.
Food Glycerol Market Segmentation
By Type
Food Grade
Feed Grade
By Application
Juice
Wine
Meat Product
Pet Food
Others
Countries Analyzed
North America (US, Canada, Mexico)
Europe (Germany, UK, France, Spain, Italy, Russia, Rest of Europe)
Asia Pacific (China, India, Japan, South Korea, Australia, South East Asia, Rest of Asia)
South America (Brazil, Argentina, Rest of South America)
Middle East and Africa (Saudi Arabia, UAE, Rest of Middle East, South Africa, Egypt, Rest of Africa)
Food Glycerol Companies Profiled in the Study
Cambridge Olein
Cargill Inc
Dow Inc
Emery Oleochemicals
Godrej Industries
Hangzhou Oleochemicals
IOI Oleochemicals
KLK OLEO
Musim MAS
Oleon NV
P&G Chemicals
Pacific Oleochemicals Sdn
PT SOCI MAS
Qingyuan Futai
Shuangma Chemical
Vance Bioenergy
Vantage Oleochemicals
Wilmar International Ltd
*- List Not Exhaustive
Chapter 1. TABLE OF CONTENTS
Chapter 2. Introduction to Food Glycerol Market
2.1. Market Overview
2.2. Key Statistics and Report Highlights
2.3. Scope of the Comprehensive Study
2.3.1. Market Definition
2.3.2 Countries and Regions Covered
2.3.3 Research Objective
2.3.4 Units, Currency, and Conversions
2.3.5 Industry Value Chain
2.4. Key Market Segments
2.5. Key Companies
2.6. Study Period
Chapter 3. Strategic Analysis Review
3.1. Food Glycerol Pricing Analysis and Forecast
3.2. Porter’s Five Forces
3.3. Market Ecosystem
3.4. SWOT Analysis
3.5. Regulatory Scenario
3.3. Effects of Inflation, Russia-Ukraine War, moderating economic growth, and other macroeconomic factors
Chapter 4. Competitive Landscape
4.1. Market Share Analysis
4.1.1. Global Food Glycerol Market Share by Company, 2023
4.1.2. Product Offerings of Leading Food Glycerol Companies
4.2. Market Entropy
4.2.1. New Product Launches in the Industry
4.2.2. Mergers, Acquisitions, Joint ventures, and Partnerships
4.3. Key Strategies and Best Practices
Chapter 5. Global Market Projections: Best, Reference, and Low Case Scenarios
5.1. Growth Analysis- Case Scenario Definitions
5.2. Low Growth Case Scenario Forecasts
5.3. Reference Growth Case Scenario Forecasts
5.4. High Growth Case Scenario Forecasts
Chapter 6. Market Dynamics
6.1. Food Glycerol Market Drivers
6.2. Food Glycerol Market Challenges
6.6. Food Glycerol Market Opportunities
6.4. Food Glycerol Market Trends
Chapter 7. Global Food Glycerol Market Outlook Trends
7.1. Global Food Glycerol Revenue (USD Million) and CAGR (%) by Type (2021-2032)
7.2. Global Food Glycerol Revenue (USD Million) and CAGR (%) by Application (2021-2032)
7.3. Global Food Glycerol Revenue (USD Million) and CAGR (%) by Product (2021-2032)
By Type
Food Grade
Feed Grade
By Application
Juice
Wine
Meat Product
Pet Food
Others
Chapter 8. Global Food Glycerol Regional Analysis and Outlook
8.1. Global Food Glycerol Revenue (USD Million) By Regions (2021- 2032)
8.2. North America Food Glycerol Revenue (USD Million) by Country (2021-2032)
8.2.1. United States Food Glycerol Regional Analysis and Outlook
8.2.2. Canada Food Glycerol Regional Analysis and Outlook
8.2.3. Mexico Food Glycerol Regional Analysis and Outlook
8.3. Europe Food Glycerol Revenue (USD Million), by Country (2021-2032)
8.3.1. Germany Food Glycerol Regional Analysis and Outlook
8.3.2. France Food Glycerol Regional Analysis and Outlook
8.3.3. United Kingdom Food Glycerol Regional Analysis and Outlook
8.3.4. Spain Food Glycerol Regional Analysis and Outlook
8.3.5. Italy Food Glycerol Regional Analysis and Outlook
8.3.6. Russia Food Glycerol Regional Analysis and Outlook
8.3.7. Rest of Europe Food Glycerol Regional Analysis and Outlook
8.4. Asia Pacific Food Glycerol Revenue (USD Million) by Country (2021-2032)
8.4.1. China Food Glycerol Regional Analysis and Outlook
8.4.2. Japan Food Glycerol Regional Analysis and Outlook
8.4.3. India Food Glycerol Regional Analysis and Outlook
8.4.4. South Korea Food Glycerol Regional Analysis and Outlook
8.4.5. Australia Food Glycerol Regional Analysis and Outlook
8.4.6. South East Asia Food Glycerol Regional Analysis and Outlook
8.4.7. Rest of Asia Pacific Food Glycerol Regional Analysis and Outlook
8.5. South America Food Glycerol Revenue (USD Million), by Country (2021-2032)
8.5.1. Brazil Food Glycerol Regional Analysis and Outlook
8.5.2. Argentina Food Glycerol Regional Analysis and Outlook
8.5.3. Rest of South America Food Glycerol Regional Analysis and Outlook
8.6. Middle East and Africa Food Glycerol Revenue (USD Million) by Country (2021-2032)
8.6.1. Middle East Food Glycerol Regional Analysis and Outlook
8.6.2. Africa Food Glycerol Regional Analysis and Outlook
Chapter 9. North America Food Glycerol Analysis and Outlook
9.1. North America Food Glycerol Revenue (USD Million) by Segments (2021-2032)
9.1.1. North America Food Glycerol Revenue (USD Million) by Type (2021-2032)
9.1.2. North America Food Glycerol Revenue (USD Million) by Application (2021-2032)
9.1.3. North America Food Glycerol Revenue (USD Million) by Product (2021-2032)
By Type
Food Grade
Feed Grade
By Application
Juice
Wine
Meat Product
Pet Food
Others
Chapter 10. Europe Food Glycerol Analysis and Outlook
10.1. Europe Food Glycerol Revenue (USD Million), by Segments (USD Million) (2021-2032)
10.1.1. Europe Food Glycerol Revenue (USD Million) by Type (2021-2032)
10.1.2. Europe Food Glycerol Revenue (USD Million) by Application (2021-2032)
10.1.3. Europe Food Glycerol Revenue (USD Million) by Product (2021-2032)
By Type
Food Grade
Feed Grade
By Application
Juice
Wine
Meat Product
Pet Food
Others
Chapter 11. Asia Pacific Food Glycerol Analysis and Outlook
11.1. Asia Pacific Food Glycerol Revenue (USD Million), and Revenue (USD Million) by Segments (2021-2032)
11.1.1. Asia Pacific Food Glycerol Revenue (USD Million) by Type (2021-2032)
11.1.2. Asia Pacific Food Glycerol Revenue (USD Million) by Application (2021-2032)
11.1.3. Asia Pacific Food Glycerol Revenue (USD Million) by Product (2021-2032)
By Type
Food Grade
Feed Grade
By Application
Juice
Wine
Meat Product
Pet Food
Others
Chapter 12. South America Food Glycerol Analysis and Outlook
12.1. South America Food Glycerol Revenue (USD Million), by Segments (2021-2032)
12.1.1. South America Food Glycerol Revenue (USD Million) by Type (2021-2032)
12.1.2. South America Food Glycerol Revenue (USD Million) by Application (2021-2032)
12.1.3. South America Food Glycerol Revenue (USD Million) by Product (2021-2032)
By Type
Food Grade
Feed Grade
By Application
Juice
Wine
Meat Product
Pet Food
Others
Chapter 13. Middle East and Africa Food Glycerol Analysis and Outlook
13.1. Middle East and Africa Food Glycerol Revenue (USD Million), by Segments (2021-2032)
13.1.1. Middle East and Africa Food Glycerol Revenue (USD Million) by Type (2021-2032)
13.1.2. Middle East and Africa Food Glycerol Revenue (USD Million) by Application (2021-2032)
13.1.3. Middle East and Africa Food Glycerol Revenue (USD Million) by Product (2021-2032)
By Type
Food Grade
Feed Grade
By Application
Juice
Wine
Meat Product
Pet Food
Others
Chapter 14. Food Glycerol Company Profiles
14.1 Business Overview
14.2 Product Profiles
14.3 SWOT Profiles
14.5 Recent Developments
14.6 Financial Profile
List of Companies
Cambridge Olein
Cargill Inc
Dow Inc
Emery Oleochemicals
Godrej Industries
Hangzhou Oleochemicals
IOI Oleochemicals
KLK OLEO
Musim MAS
Oleon NV
P&G Chemicals
Pacific Oleochemicals Sdn
PT SOCI MAS
Qingyuan Futai
Shuangma Chemical
Vance Bioenergy
Vantage Oleochemicals
Wilmar International Ltd
15. Methodology and Data Sources
15.1 Customization Offerings
15.2 Subscription Services
15.3 Related Reports
15.4 Publisher Expertise
LIST OF TABLES
Table 1 Market Segmentation Analysis
Table 2 Global Food Glycerol Market Share of Leading Companies, 2023
Table 3 Product Offerings of Leading Companies
Table 4 Low Growth Scenario Forecasts
Table 5 Reference Case Growth Scenario
Table 6 High Growth Case Scenario
Table 7 Global Food Glycerol Revenue (USD Million) And CAGR (%) By Type (2021-2032)
Table 8 Global Food Glycerol Revenue (USD Million) And CAGR (%) By Application (2021-2032)
Table 9 Global Food Glycerol Revenue (USD Million) And CAGR (%) By Product (2021-2032)
Table 10 Global Food Glycerol Market Revenue (USD Million) By Regions (2021-2032)
Table 11 Global Food Glycerol Market Share (%) By Regions (2021-2032)
Table 12 North America Food Glycerol Revenue (USD Million) By Country (2021-2032)
Table 13 Europe Food Glycerol Revenue (USD Million) By Country (2021-2032)
Table 14 Asia Pacific Food Glycerol Revenue (USD Million) By Country (2021-2032)
Table 15 South America Food Glycerol Revenue (USD Million) By Country (2021-2032)
Table 16 Middle East and Africa Food Glycerol Revenue (USD Million) By Region (2021-2032)
Table 17 North America Food Glycerol Revenue (USD Million) By Type (2021-2032)
Table 18 North America Food Glycerol Revenue (USD Million) By Application (2021-2032)
Table 19 North America Food Glycerol Revenue (USD Million) By Product (2021-2032)
Table 20 Europe Food Glycerol Revenue (USD Million) By Type (2021-2032)
Table 21 Europe Food Glycerol Revenue (USD Million) By Application (2021-2032)
Table 22 Europe Food Glycerol Revenue (USD Million) By Product (2021-2032)
Table 23 Asia Pacific Food Glycerol Revenue (USD Million) By Type (2021-2032)
Table 24 Asia Pacific Food Glycerol Revenue (USD Million) By Application (2021-2032)
Table 25 Asia Pacific Food Glycerol Revenue (USD Million) By Product (2021-2032)
Table 26 South America Food Glycerol Revenue (USD Million) By Type (2021-2032)
Table 27 South America Food Glycerol Revenue (USD Million) By Application (2021-2032)
Table 28 South America Food Glycerol Revenue (USD Million) By Product (2021-2032)
Table 29 Middle East and Africa Food Glycerol Revenue (USD Million) By Type (2021-2032)
Table 30 Middle East and Africa Food Glycerol Revenue (USD Million) By Application (2021-2032)
Table 31 Middle East and Africa Food Glycerol Revenue (USD Million) By Product (2021-2032)
LIST OF FIGURES
Figure 1. Market Scope
Figure 2. Pricing Forecasts Per Unit, 2023- 2032
Figure 3. Porter’s Five Forces
Figure 4. Global Food Glycerol Market Revenue (USD Million) By Regions (2021-2032)
Figure 5. Global Food Glycerol Market Share (%) By Regions (2023)
Figure 6. North America Food Glycerol Revenue (USD Million) By Country (2021-2032)
Figure 7. United States Food Glycerol Revenue (USD Million) By Country (2021-2032)
Figure 8. Canada Food Glycerol Revenue (USD Million) By Country (2021-2032)
Figure 9. Mexico Food Glycerol Revenue (USD Million) By Country (2021-2032)
Figure 10. Europe Food Glycerol Revenue (USD Million) By Country (2021-2032)
Figure 11. Germany Food Glycerol Revenue (USD Million) By Country (2021-2032)
Figure 12. France Food Glycerol Revenue (USD Million) By Country (2021-2032)
Figure 13. United Kingdom Food Glycerol Revenue (USD Million) By Country (2021-2032)
Figure 14. Spain Food Glycerol Revenue (USD Million) By Country (2021-2032)
Figure 15. Italy Food Glycerol Revenue (USD Million) By Country (2021-2032)
Figure 16. Russia Food Glycerol Revenue (USD Million) By Country (2021-2032)
Figure 17. Rest of Europe Food Glycerol Revenue (USD Million) By Country (2021-2032)
Figure 11. Asia Pacific Food Glycerol Revenue (USD Million) By Country (2021-2032)
Figure 12. China Food Glycerol Revenue (USD Million) By Country (2021-2032)
Figure 13. Japan Food Glycerol Revenue (USD Million) By Country (2021-2032)
Figure 14. India Food Glycerol Revenue (USD Million) By Country (2021-2032)
Figure 15. South Korea Food Glycerol Revenue (USD Million) By Country (2021-2032)
Figure 16. Australia Food Glycerol Revenue (USD Million) By Country (2021-2032)
Figure 17. South East Asia Food Glycerol Revenue (USD Million) By Country (2021-2032)
Figure 18. South America Food Glycerol Revenue (USD Million) By Country (2021-2032)
Figure 19. Brazil Food Glycerol Revenue (USD Million) By Country (2021-2032)
Figure 20. Argentina Food Glycerol Revenue (USD Million) By Country (2021-2032)
Figure 21. Rest of Asia Pacific Food Glycerol Revenue (USD Million) By Country (2021-2032)
Figure 22. Middle East and Africa Food Glycerol Revenue (USD Million) By Region (2021-2032)
Figure 23. Saudi Arabia Food Glycerol Revenue (USD Million) By Region (2021-2032)
Figure 24. The UAE Food Glycerol Revenue (USD Million) By Region (2021-2032)
Figure 25. Rest of Middle East Food Glycerol Revenue (USD Million) By Region (2021-2032)
Figure 26. South Africa Food Glycerol Revenue (USD Million) By Region (2021-2032)
Figure 27. Africa Food Glycerol Revenue (USD Million) By Region (2021-2032)
Figure 28. North America Food Glycerol Revenue (USD Million) By Type (2021-2032)
Figure 29. North America Food Glycerol Revenue (USD Million) By Application (2021-2032)
Figure 30. North America Food Glycerol Revenue (USD Million) By Product (2021-2032)
Figure 31. Europe Food Glycerol Revenue (USD Million) By Type (2021-2032)
Figure 32. Europe Food Glycerol Revenue (USD Million) By Application (2021-2032)
Figure 33. Europe Food Glycerol Revenue (USD Million) By Product (2021-2032)
Figure 34. Asia Pacific Food Glycerol Revenue (USD Million) By Type (2021-2032)
Figure 35. Asia Pacific Food Glycerol Revenue (USD Million) By Application (2021-2032)
Figure 36. Asia Pacific Food Glycerol Revenue (USD Million) By Product (2021-2032)
Figure 37. South America Food Glycerol Revenue (USD Million) By Type (2021-2032)
Figure 38. South America Food Glycerol Revenue (USD Million) By Application (2021-2032)
Figure 39. South America Food Glycerol Revenue (USD Million) By Product (2021-2032)
Figure 40. Middle East and Africa Food Glycerol Revenue (USD Million) By Type (2021-2032)
Figure 41. Middle East and Africa Food Glycerol Revenue (USD Million) By Application (2021-2032)
Figure 42. Middle East and Africa Food Glycerol Revenue (USD Million) By Product (2021-2032)
By Type
Food Grade
Feed Grade
By Application
Juice
Wine
Meat Product
Pet Food
Others
Countries Analyzed
North America (US, Canada, Mexico)
Europe (Germany, UK, France, Spain, Italy, Russia, Rest of Europe)
Asia Pacific (China, India, Japan, South Korea, Australia, South East Asia, Rest of Asia)
South America (Brazil, Argentina, Rest of South America)
Middle East and Africa (Saudi Arabia, UAE, Rest of Middle East, South Africa, Egypt, Rest of Africa)
