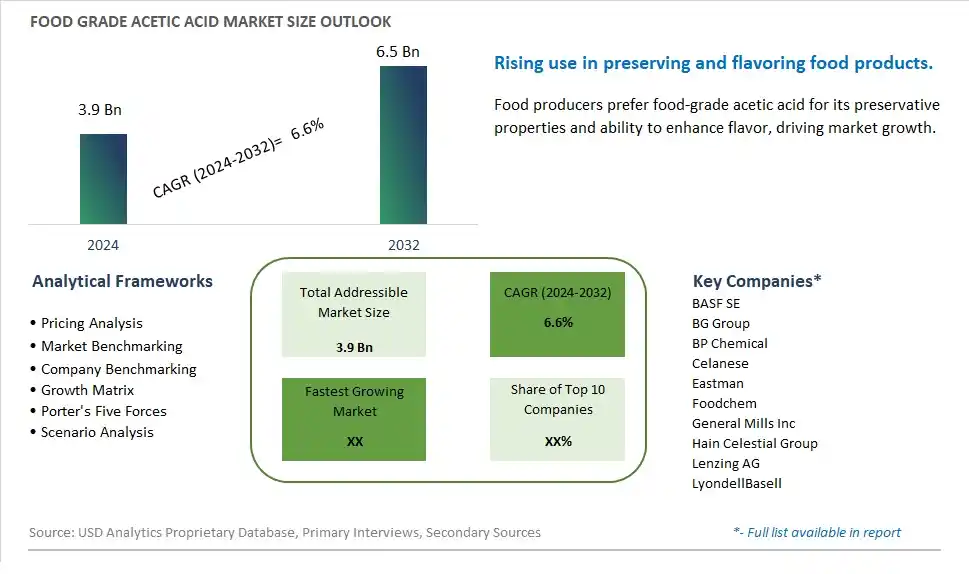
Global Food Grade Acetic Acid Market Size is valued at $3.9 Billion in 2024 and is forecast to register a growth rate (CAGR) of 6.6% to reach $6.5 Billion by 2032.
The global Food Grade Acetic Acid Market Comprehensive Study analyzes and forecasts the market size across 6 regions and 24 countries for diverse segments -By Form (Dry, Liquid), By Application (Bakery and Confectionery, Dairy and Frozen Desserts, Sweet and Savory Snacks, Sauces and Dressings, Others)
An Introduction to Food Grade Acetic Acid Market
The Food Grade Acetic Acid market in 2024 is experiencing significant growth, driven by the increasing demand for natural preservatives and acidity regulators in the food industry. Food-grade acetic acid, primarily used in vinegar production, is also an important ingredient in pickling, sauces, and condiments. The market benefits from advancements in fermentation and production technologies, the growing trend of clean label and organic foods, and the expansion of the global food processing sector. Additionally, the rising awareness of the health benefits and culinary versatility of acetic acid is contributing to market growth.
Food Grade Acetic Acid Competitive Landscape
The market report analyses the leading companies in the industry including BASF SE, BG Group, BP Chemical, Celanese, Eastman, Foodchem, General Mills Inc, Hain Celestial Group, Lenzing AG, LyondellBasell, and Others.
Food Grade Acetic Acid Market Dynamics
Food Grade Acetic Acid Market Trend: Increasing Demand for Natural Food Preservatives
One prominent trend in the food grade acetic acid market is the increasing demand for natural food preservatives. With growing concerns about food safety, shelf-life extension, and clean label ingredients, consumers are seeking food products preserved with natural and familiar compounds. Acetic acid, derived from natural fermentation processes, serves as an effective and environmentally friendly preservative, antimicrobial agent, and pH regulator in food applications. This trend is driven by consumer preferences for clean label foods, minimal processing, and safer preservation methods, prompting food manufacturers to incorporate food grade acetic acid into various products to meet market demands for natural and sustainable food preservation solutions.
Food Grade Acetic Acid Market Driver: Regulatory Approval and Safety Compliance
A key driver propelling the food grade acetic acid market is regulatory approval and safety compliance. Acetic acid is recognized as Generally Recognized as Safe (GRAS) by regulatory authorities such as the U.S. Food and Drug Administration (FDA) and the European Food Safety Authority (EFSA) when used within specified limits and in accordance with good manufacturing practices. The driver behind this trend is the need for safe and approved food additives that meet regulatory standards, ensure food safety, and address consumer concerns about chemical additives and synthetic preservatives. Food grade acetic acid's approval and compliance with regulatory requirements drive its adoption and use in food preservation and processing.
Food Grade Acetic Acid Market Opportunity: Expansion into Clean Label and Natural Food Preservation
A significant opportunity in the food grade acetic acid market lies in the expansion into clean label and natural food preservation solutions that align with consumer preferences and market trends. Companies can capitalize on this opportunity by developing acetic acid-based preservatives, vinegar concentrates, and vinegar-based blends that offer effective microbial control, shelf-life extension, and flavor enhancement while maintaining clean label status. Additionally, there's potential for offering acetic acid solutions with enhanced functionalities, such as reduced odor, improved solubility, and customized pH levels, to meet the diverse needs of food manufacturers across different product categories. By focusing on clean label and natural preservation solutions, companies can differentiate their offerings, address market demands for safer and sustainable food additives, and contribute to the development of cleaner and healthier food products.
Food Grade Acetic Acid Market Share Analysis: Liquid segment generated the highest revenue share in the industry
In the Food Grade Acetic Acid Market, the Liquid form emerges as the largest segment. Liquid food grade acetic acid is widely used across various food processing applications due to its versatility and ease of integration into production processes. Acetic acid in liquid form is primarily utilized as a food preservative, flavor enhancer, and acidulant in numerous food products such as sauces, condiments, pickles, and dressings. Its role extends beyond preservation to influencing taste profiles, enhancing shelf life, and maintaining food safety standards. Liquid acetic acid's ability to inhibit the growth of bacteria and mold makes it indispensable in food manufacturing, ensuring product quality and extending the freshness of perishable foods. Further, its liquid form allows for precise dosage and application flexibility in different food processing environments. As food manufacturers increasingly prioritize food safety and quality, the demand for liquid food grade acetic acid continues to grow steadily, driven by its essential role in maintaining the integrity and appeal of a wide range of food products.
Food Grade Acetic Acid Market Share Analysis: Sauces and Dressings is the fastest growing segment over the forecast period to 2032
Among the various applications in the Food Grade Acetic Acid Market, Sauces and Dressings stand out as the fastest growing segment projected to 2032. The increasing consumer demand for diverse and convenient food options has significantly boosted the consumption of sauces and dressings globally. Acetic acid plays a crucial role in this segment by serving as a key ingredient in the production of vinegar-based sauces, salad dressings, and marinades. Its acidic properties not only impart tanginess and flavor complexity but also act as natural preservatives, enhancing shelf life and maintaining product quality. As consumer preferences continue to favor healthier and natural food choices, manufacturers are increasingly opting for acetic acid as a clean-label ingredient in sauces and dressings, replacing synthetic additives. Further, the versatility of acetic acid allows for innovation in flavor profiles and product formulations, catering to evolving culinary trends and dietary preferences. This growth trend underscores the pivotal role of acetic acid in enhancing both the taste and safety of sauces and dressings, driving its rapid adoption across the food industry.
Food Grade Acetic Acid Market Segmentation
By Form
Dry
Liquid
By Application
Bakery and Confectionery
Dairy and Frozen Desserts
Sweet and Savory Snacks
Sauces and Dressings
Others
Countries Analyzed
North America (US, Canada, Mexico)
Europe (Germany, UK, France, Spain, Italy, Russia, Rest of Europe)
Asia Pacific (China, India, Japan, South Korea, Australia, South East Asia, Rest of Asia)
South America (Brazil, Argentina, Rest of South America)
Middle East and Africa (Saudi Arabia, UAE, Rest of Middle East, South Africa, Egypt, Rest of Africa)
Food Grade Acetic Acid Companies Profiled in the Study
BASF SE
BG Group
BP Chemical
Celanese
Eastman
Foodchem
General Mills Inc
Hain Celestial Group
Lenzing AG
LyondellBasell
*- List Not Exhaustive
Chapter 1. TABLE OF CONTENTS
Chapter 2. Introduction to Food Grade Acetic Acid Market
2.1. Market Overview
2.2. Key Statistics and Report Highlights
2.3. Scope of the Comprehensive Study
2.3.1. Market Definition
2.3.2 Countries and Regions Covered
2.3.3 Research Objective
2.3.4 Units, Currency, and Conversions
2.3.5 Industry Value Chain
2.4. Key Market Segments
2.5. Key Companies
2.6. Study Period
Chapter 3. Strategic Analysis Review
3.1. Food Grade Acetic Acid Pricing Analysis and Forecast
3.2. Porter’s Five Forces
3.3. Market Ecosystem
3.4. SWOT Analysis
3.5. Regulatory Scenario
3.3. Effects of Inflation, Russia-Ukraine War, moderating economic growth, and other macroeconomic factors
Chapter 4. Competitive Landscape
4.1. Market Share Analysis
4.1.1. Global Food Grade Acetic Acid Market Share by Company, 2023
4.1.2. Product Offerings of Leading Food Grade Acetic Acid Companies
4.2. Market Entropy
4.2.1. New Product Launches in the Industry
4.2.2. Mergers, Acquisitions, Joint ventures, and Partnerships
4.3. Key Strategies and Best Practices
Chapter 5. Global Market Projections: Best, Reference, and Low Case Scenarios
5.1. Growth Analysis- Case Scenario Definitions
5.2. Low Growth Case Scenario Forecasts
5.3. Reference Growth Case Scenario Forecasts
5.4. High Growth Case Scenario Forecasts
Chapter 6. Market Dynamics
6.1. Food Grade Acetic Acid Market Drivers
6.2. Food Grade Acetic Acid Market Challenges
6.6. Food Grade Acetic Acid Market Opportunities
6.4. Food Grade Acetic Acid Market Trends
Chapter 7. Global Food Grade Acetic Acid Market Outlook Trends
7.1. Global Food Grade Acetic Acid Revenue (USD Million) and CAGR (%) by Type (2021-2032)
7.2. Global Food Grade Acetic Acid Revenue (USD Million) and CAGR (%) by Application (2021-2032)
7.3. Global Food Grade Acetic Acid Revenue (USD Million) and CAGR (%) by Product (2021-2032)
By Form
Dry
Liquid
By Application
Bakery and Confectionery
Dairy and Frozen Desserts
Sweet and Savory Snacks
Sauces and Dressings
Others
Chapter 8. Global Food Grade Acetic Acid Regional Analysis and Outlook
8.1. Global Food Grade Acetic Acid Revenue (USD Million) By Regions (2021- 2032)
8.2. North America Food Grade Acetic Acid Revenue (USD Million) by Country (2021-2032)
8.2.1. United States Food Grade Acetic Acid Regional Analysis and Outlook
8.2.2. Canada Food Grade Acetic Acid Regional Analysis and Outlook
8.2.3. Mexico Food Grade Acetic Acid Regional Analysis and Outlook
8.3. Europe Food Grade Acetic Acid Revenue (USD Million), by Country (2021-2032)
8.3.1. Germany Food Grade Acetic Acid Regional Analysis and Outlook
8.3.2. France Food Grade Acetic Acid Regional Analysis and Outlook
8.3.3. United Kingdom Food Grade Acetic Acid Regional Analysis and Outlook
8.3.4. Spain Food Grade Acetic Acid Regional Analysis and Outlook
8.3.5. Italy Food Grade Acetic Acid Regional Analysis and Outlook
8.3.6. Russia Food Grade Acetic Acid Regional Analysis and Outlook
8.3.7. Rest of Europe Food Grade Acetic Acid Regional Analysis and Outlook
8.4. Asia Pacific Food Grade Acetic Acid Revenue (USD Million) by Country (2021-2032)
8.4.1. China Food Grade Acetic Acid Regional Analysis and Outlook
8.4.2. Japan Food Grade Acetic Acid Regional Analysis and Outlook
8.4.3. India Food Grade Acetic Acid Regional Analysis and Outlook
8.4.4. South Korea Food Grade Acetic Acid Regional Analysis and Outlook
8.4.5. Australia Food Grade Acetic Acid Regional Analysis and Outlook
8.4.6. South East Asia Food Grade Acetic Acid Regional Analysis and Outlook
8.4.7. Rest of Asia Pacific Food Grade Acetic Acid Regional Analysis and Outlook
8.5. South America Food Grade Acetic Acid Revenue (USD Million), by Country (2021-2032)
8.5.1. Brazil Food Grade Acetic Acid Regional Analysis and Outlook
8.5.2. Argentina Food Grade Acetic Acid Regional Analysis and Outlook
8.5.3. Rest of South America Food Grade Acetic Acid Regional Analysis and Outlook
8.6. Middle East and Africa Food Grade Acetic Acid Revenue (USD Million) by Country (2021-2032)
8.6.1. Middle East Food Grade Acetic Acid Regional Analysis and Outlook
8.6.2. Africa Food Grade Acetic Acid Regional Analysis and Outlook
Chapter 9. North America Food Grade Acetic Acid Analysis and Outlook
9.1. North America Food Grade Acetic Acid Revenue (USD Million) by Segments (2021-2032)
9.1.1. North America Food Grade Acetic Acid Revenue (USD Million) by Type (2021-2032)
9.1.2. North America Food Grade Acetic Acid Revenue (USD Million) by Application (2021-2032)
9.1.3. North America Food Grade Acetic Acid Revenue (USD Million) by Product (2021-2032)
By Form
Dry
Liquid
By Application
Bakery and Confectionery
Dairy and Frozen Desserts
Sweet and Savory Snacks
Sauces and Dressings
Others
Chapter 10. Europe Food Grade Acetic Acid Analysis and Outlook
10.1. Europe Food Grade Acetic Acid Revenue (USD Million), by Segments (USD Million) (2021-2032)
10.1.1. Europe Food Grade Acetic Acid Revenue (USD Million) by Type (2021-2032)
10.1.2. Europe Food Grade Acetic Acid Revenue (USD Million) by Application (2021-2032)
10.1.3. Europe Food Grade Acetic Acid Revenue (USD Million) by Product (2021-2032)
By Form
Dry
Liquid
By Application
Bakery and Confectionery
Dairy and Frozen Desserts
Sweet and Savory Snacks
Sauces and Dressings
Others
Chapter 11. Asia Pacific Food Grade Acetic Acid Analysis and Outlook
11.1. Asia Pacific Food Grade Acetic Acid Revenue (USD Million), and Revenue (USD Million) by Segments (2021-2032)
11.1.1. Asia Pacific Food Grade Acetic Acid Revenue (USD Million) by Type (2021-2032)
11.1.2. Asia Pacific Food Grade Acetic Acid Revenue (USD Million) by Application (2021-2032)
11.1.3. Asia Pacific Food Grade Acetic Acid Revenue (USD Million) by Product (2021-2032)
By Form
Dry
Liquid
By Application
Bakery and Confectionery
Dairy and Frozen Desserts
Sweet and Savory Snacks
Sauces and Dressings
Others
Chapter 12. South America Food Grade Acetic Acid Analysis and Outlook
12.1. South America Food Grade Acetic Acid Revenue (USD Million), by Segments (2021-2032)
12.1.1. South America Food Grade Acetic Acid Revenue (USD Million) by Type (2021-2032)
12.1.2. South America Food Grade Acetic Acid Revenue (USD Million) by Application (2021-2032)
12.1.3. South America Food Grade Acetic Acid Revenue (USD Million) by Product (2021-2032)
By Form
Dry
Liquid
By Application
Bakery and Confectionery
Dairy and Frozen Desserts
Sweet and Savory Snacks
Sauces and Dressings
Others
Chapter 13. Middle East and Africa Food Grade Acetic Acid Analysis and Outlook
13.1. Middle East and Africa Food Grade Acetic Acid Revenue (USD Million), by Segments (2021-2032)
13.1.1. Middle East and Africa Food Grade Acetic Acid Revenue (USD Million) by Type (2021-2032)
13.1.2. Middle East and Africa Food Grade Acetic Acid Revenue (USD Million) by Application (2021-2032)
13.1.3. Middle East and Africa Food Grade Acetic Acid Revenue (USD Million) by Product (2021-2032)
By Form
Dry
Liquid
By Application
Bakery and Confectionery
Dairy and Frozen Desserts
Sweet and Savory Snacks
Sauces and Dressings
Others
Chapter 14. Food Grade Acetic Acid Company Profiles
14.1 Business Overview
14.2 Product Profiles
14.3 SWOT Profiles
14.5 Recent Developments
14.6 Financial Profile
List of Companies
BASF SE
BG Group
BP Chemical
Celanese
Eastman
Foodchem
General Mills Inc
Hain Celestial Group
Lenzing AG
LyondellBasell
15. Methodology and Data Sources
15.1 Customization Offerings
15.2 Subscription Services
15.3 Related Reports
15.4 Publisher Expertise
LIST OF TABLES
Table 1 Market Segmentation Analysis
Table 2 Global Food Grade Acetic Acid Market Share of Leading Companies, 2023
Table 3 Product Offerings of Leading Companies
Table 4 Low Growth Scenario Forecasts
Table 5 Reference Case Growth Scenario
Table 6 High Growth Case Scenario
Table 7 Global Food Grade Acetic Acid Revenue (USD Million) And CAGR (%) By Type (2021-2032)
Table 8 Global Food Grade Acetic Acid Revenue (USD Million) And CAGR (%) By Application (2021-2032)
Table 9 Global Food Grade Acetic Acid Revenue (USD Million) And CAGR (%) By Product (2021-2032)
Table 10 Global Food Grade Acetic Acid Market Revenue (USD Million) By Regions (2021-2032)
Table 11 Global Food Grade Acetic Acid Market Share (%) By Regions (2021-2032)
Table 12 North America Food Grade Acetic Acid Revenue (USD Million) By Country (2021-2032)
Table 13 Europe Food Grade Acetic Acid Revenue (USD Million) By Country (2021-2032)
Table 14 Asia Pacific Food Grade Acetic Acid Revenue (USD Million) By Country (2021-2032)
Table 15 South America Food Grade Acetic Acid Revenue (USD Million) By Country (2021-2032)
Table 16 Middle East and Africa Food Grade Acetic Acid Revenue (USD Million) By Region (2021-2032)
Table 17 North America Food Grade Acetic Acid Revenue (USD Million) By Type (2021-2032)
Table 18 North America Food Grade Acetic Acid Revenue (USD Million) By Application (2021-2032)
Table 19 North America Food Grade Acetic Acid Revenue (USD Million) By Product (2021-2032)
Table 20 Europe Food Grade Acetic Acid Revenue (USD Million) By Type (2021-2032)
Table 21 Europe Food Grade Acetic Acid Revenue (USD Million) By Application (2021-2032)
Table 22 Europe Food Grade Acetic Acid Revenue (USD Million) By Product (2021-2032)
Table 23 Asia Pacific Food Grade Acetic Acid Revenue (USD Million) By Type (2021-2032)
Table 24 Asia Pacific Food Grade Acetic Acid Revenue (USD Million) By Application (2021-2032)
Table 25 Asia Pacific Food Grade Acetic Acid Revenue (USD Million) By Product (2021-2032)
Table 26 South America Food Grade Acetic Acid Revenue (USD Million) By Type (2021-2032)
Table 27 South America Food Grade Acetic Acid Revenue (USD Million) By Application (2021-2032)
Table 28 South America Food Grade Acetic Acid Revenue (USD Million) By Product (2021-2032)
Table 29 Middle East and Africa Food Grade Acetic Acid Revenue (USD Million) By Type (2021-2032)
Table 30 Middle East and Africa Food Grade Acetic Acid Revenue (USD Million) By Application (2021-2032)
Table 31 Middle East and Africa Food Grade Acetic Acid Revenue (USD Million) By Product (2021-2032)
LIST OF FIGURES
Figure 1. Market Scope
Figure 2. Pricing Forecasts Per Unit, 2023- 2032
Figure 3. Porter’s Five Forces
Figure 4. Global Food Grade Acetic Acid Market Revenue (USD Million) By Regions (2021-2032)
Figure 5. Global Food Grade Acetic Acid Market Share (%) By Regions (2023)
Figure 6. North America Food Grade Acetic Acid Revenue (USD Million) By Country (2021-2032)
Figure 7. United States Food Grade Acetic Acid Revenue (USD Million) By Country (2021-2032)
Figure 8. Canada Food Grade Acetic Acid Revenue (USD Million) By Country (2021-2032)
Figure 9. Mexico Food Grade Acetic Acid Revenue (USD Million) By Country (2021-2032)
Figure 10. Europe Food Grade Acetic Acid Revenue (USD Million) By Country (2021-2032)
Figure 11. Germany Food Grade Acetic Acid Revenue (USD Million) By Country (2021-2032)
Figure 12. France Food Grade Acetic Acid Revenue (USD Million) By Country (2021-2032)
Figure 13. United Kingdom Food Grade Acetic Acid Revenue (USD Million) By Country (2021-2032)
Figure 14. Spain Food Grade Acetic Acid Revenue (USD Million) By Country (2021-2032)
Figure 15. Italy Food Grade Acetic Acid Revenue (USD Million) By Country (2021-2032)
Figure 16. Russia Food Grade Acetic Acid Revenue (USD Million) By Country (2021-2032)
Figure 17. Rest of Europe Food Grade Acetic Acid Revenue (USD Million) By Country (2021-2032)
Figure 11. Asia Pacific Food Grade Acetic Acid Revenue (USD Million) By Country (2021-2032)
Figure 12. China Food Grade Acetic Acid Revenue (USD Million) By Country (2021-2032)
Figure 13. Japan Food Grade Acetic Acid Revenue (USD Million) By Country (2021-2032)
Figure 14. India Food Grade Acetic Acid Revenue (USD Million) By Country (2021-2032)
Figure 15. South Korea Food Grade Acetic Acid Revenue (USD Million) By Country (2021-2032)
Figure 16. Australia Food Grade Acetic Acid Revenue (USD Million) By Country (2021-2032)
Figure 17. South East Asia Food Grade Acetic Acid Revenue (USD Million) By Country (2021-2032)
Figure 18. South America Food Grade Acetic Acid Revenue (USD Million) By Country (2021-2032)
Figure 19. Brazil Food Grade Acetic Acid Revenue (USD Million) By Country (2021-2032)
Figure 20. Argentina Food Grade Acetic Acid Revenue (USD Million) By Country (2021-2032)
Figure 21. Rest of Asia Pacific Food Grade Acetic Acid Revenue (USD Million) By Country (2021-2032)
Figure 22. Middle East and Africa Food Grade Acetic Acid Revenue (USD Million) By Region (2021-2032)
Figure 23. Saudi Arabia Food Grade Acetic Acid Revenue (USD Million) By Region (2021-2032)
Figure 24. The UAE Food Grade Acetic Acid Revenue (USD Million) By Region (2021-2032)
Figure 25. Rest of Middle East Food Grade Acetic Acid Revenue (USD Million) By Region (2021-2032)
Figure 26. South Africa Food Grade Acetic Acid Revenue (USD Million) By Region (2021-2032)
Figure 27. Africa Food Grade Acetic Acid Revenue (USD Million) By Region (2021-2032)
Figure 28. North America Food Grade Acetic Acid Revenue (USD Million) By Type (2021-2032)
Figure 29. North America Food Grade Acetic Acid Revenue (USD Million) By Application (2021-2032)
Figure 30. North America Food Grade Acetic Acid Revenue (USD Million) By Product (2021-2032)
Figure 31. Europe Food Grade Acetic Acid Revenue (USD Million) By Type (2021-2032)
Figure 32. Europe Food Grade Acetic Acid Revenue (USD Million) By Application (2021-2032)
Figure 33. Europe Food Grade Acetic Acid Revenue (USD Million) By Product (2021-2032)
Figure 34. Asia Pacific Food Grade Acetic Acid Revenue (USD Million) By Type (2021-2032)
Figure 35. Asia Pacific Food Grade Acetic Acid Revenue (USD Million) By Application (2021-2032)
Figure 36. Asia Pacific Food Grade Acetic Acid Revenue (USD Million) By Product (2021-2032)
Figure 37. South America Food Grade Acetic Acid Revenue (USD Million) By Type (2021-2032)
Figure 38. South America Food Grade Acetic Acid Revenue (USD Million) By Application (2021-2032)
Figure 39. South America Food Grade Acetic Acid Revenue (USD Million) By Product (2021-2032)
Figure 40. Middle East and Africa Food Grade Acetic Acid Revenue (USD Million) By Type (2021-2032)
Figure 41. Middle East and Africa Food Grade Acetic Acid Revenue (USD Million) By Application (2021-2032)
Figure 42. Middle East and Africa Food Grade Acetic Acid Revenue (USD Million) By Product (2021-2032)
By Form
Dry
Liquid
By Application
Bakery and Confectionery
Dairy and Frozen Desserts
Sweet and Savory Snacks
Sauces and Dressings
Others
Countries Analyzed
North America (US, Canada, Mexico)
Europe (Germany, UK, France, Spain, Italy, Russia, Rest of Europe)
Asia Pacific (China, India, Japan, South Korea, Australia, South East Asia, Rest of Asia)
South America (Brazil, Argentina, Rest of South America)
Middle East and Africa (Saudi Arabia, UAE, Rest of Middle East, South Africa, Egypt, Rest of Africa)
