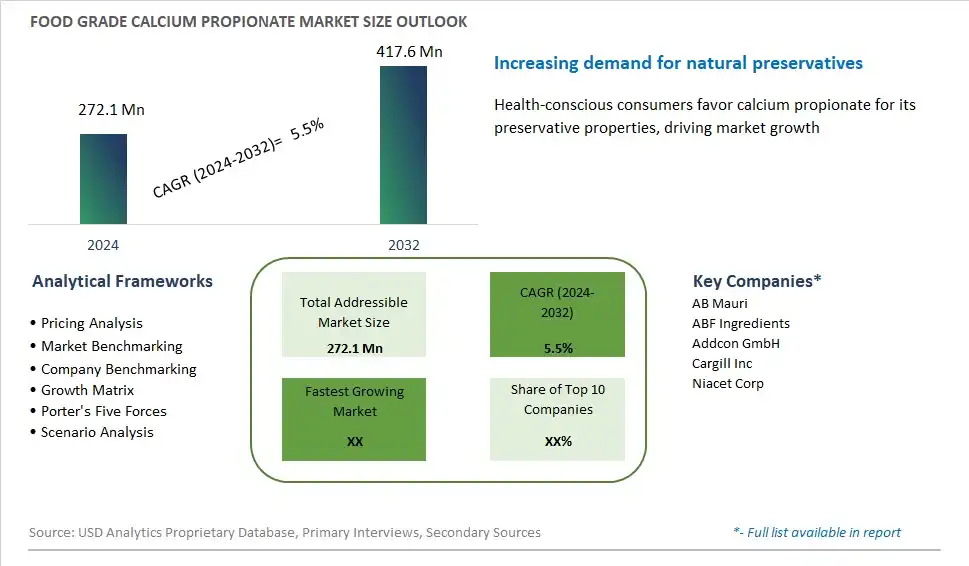
Global Food Grade Calcium Propionate Market Size is valued at $272.1 Million in 2024 and is forecast to register a growth rate (CAGR) of 5.5% to reach $417.6 Million by 2032.
The global Food Grade Calcium Propionate Market Comprehensive Study analyzes and forecasts the market size across 6 regions and 24 countries for diverse segments -By End-User (Food and Beverage, Animal Feed), By Application (Bread, Bakery Products, Dairy Products, Meat and Poultry, Feed, Others), By Form (Powder, Liquid)
An Introduction to Food Grade Calcium Propionate Market
The food grade calcium propionate market in 2024 is thriving, driven by its critical role as a preservative in extending the shelf life of various food products. Calcium propionate is widely used in bakery products to prevent mold and bacterial growth, ensuring product safety and longevity. The market is supported by the increasing demand for fresh and longer-lasting baked goods, coupled with the growing trend towards natural preservatives. Regulatory approvals and the push for clean-label ingredients have further enhanced the adoption of calcium propionate, as it is considered safe and effective. Innovations in formulation techniques are also contributing to improved efficacy and consumer acceptance. As the food industry continues to prioritize food safety and shelf stability, the demand for food grade calcium propionate is set to rise, driving market growth and development.
Food Grade Calcium Propionate Competitive Landscape
The market report analyses the leading companies in the industry including AB Mauri, ABF Ingredients, Addcon GmbH, Cargill Inc, Niacet Corp, and Others.
Food Grade Calcium Propionate Market Dynamics
Food Grade Calcium Propionate Market Trend: Rising Demand for Clean Label Ingredients
A prominent trend in the food grade calcium propionate market is the increasing demand for clean label ingredients. With consumers becoming more health-conscious and mindful of ingredient lists, there's a growing preference for additives and preservatives that are perceived as natural and safe. Calcium propionate, a calcium salt of propionic acid, is gaining traction as a food preservative due to its ability to inhibit mold and bacterial growth while being perceived as a clean label ingredient. This trend is driven by regulatory pressure, consumer awareness campaigns, and the food industry's efforts to respond to changing consumer preferences. As manufacturers strive to formulate products with simpler and more recognizable ingredients, the demand for food grade calcium propionate is expected to witness steady growth.
Market Driver: Extending Shelf Life and Improving Food Safety
An essential driver fueling the food grade calcium propionate market is its role in extending shelf life and improving food safety. In an era where food waste and foodborne illnesses are significant concerns, there's a growing need for preservatives that can prolong the freshness and stability of food products. Calcium propionate acts as an effective antimicrobial agent, preventing the growth of mold and certain bacteria in bakery products, dairy items, and other perishable goods. The ability of calcium propionate to inhibit microbial spoilage while remaining safe for consumption makes it a valuable asset for food manufacturers seeking to enhance product quality, reduce waste, and meet stringent food safety standards. As food producers prioritize food safety and shelf-life extension strategies, the demand for food grade calcium propionate is poised to increase.
Market Opportunity: Expansion into Emerging Food Segments and Geographical Markets
A significant opportunity within the food grade calcium propionate market lies in expanding into emerging food segments and geographical markets. While traditionally used in bakery products like bread and cakes, calcium propionate has the potential to penetrate other food categories such as processed meats, snacks, and convenience foods. By showcasing its efficacy in inhibiting spoilage and maintaining product freshness across a broader range of applications, manufacturers can capitalize on new revenue streams and diversify their product portfolios. Furthermore, there is untapped potential for market expansion in regions with evolving food processing industries and increasing consumer demand for packaged and convenience foods. By leveraging strategic partnerships, product innovation, and targeted marketing efforts, companies operating in the food grade calcium propionate market can seize opportunities for growth and establish a stronger presence in both established and emerging markets.
Food Grade Calcium Propionate Market Share Analysis: Food and Beverage held the dominant market share in 2024
In the Food Grade Calcium Propionate Market, the Food and Beverage segment is the largest, owing to its extensive application across a wide range of food products. Calcium propionate serves as a highly effective preservative, inhibiting the growth of mold and extending the shelf life of baked goods, dairy products, meat, and various other food items. Its ability to prevent spoilage and maintain product freshness makes it a vital ingredient in the food industry, ensuring food safety and reducing food waste. Further, as consumers increasingly prioritize convenience and demand products with longer shelf lives, the usage of calcium propionate in food and beverage applications continues to expand. Additionally, regulatory approvals and widespread acceptance of calcium propionate as a safe food additive further drive its dominance in the Food Grade Calcium Propionate Market. With the food and beverage industry's ongoing focus on quality, safety, and consumer satisfaction, the demand for calcium propionate in this segment is expected to remain robust, solidifying its position as the largest segment in the market.
Food Grade Calcium Propionate Market Share Analysis: Bread market is poised to register the fastest growth rae over the forecast period to 2032
In the Food Grade Calcium Propionate Market, the Bread segment is the fastest-growing, driven by the rising demand for packaged and convenience foods, coupled with increasing consumer preferences for clean-label and preservative-free bread options. Calcium propionate's effectiveness in inhibiting mold growth and extending the shelf life of bread products makes it a crucial additive for bread manufacturers seeking to meet stringent food safety standards while ensuring product freshness and quality. Further, as the consumption of bread remains a dietary staple globally, the adoption of calcium propionate in bread production is experiencing rapid growth. Additionally, the growing popularity of artisanal and specialty bread varieties further fuels the demand for calcium propionate as bakeries seek to maintain product integrity and freshness without compromising on taste or texture. With consumers increasingly seeking healthier and longer-lasting bread options, the Bread segment in the Food Grade Calcium Propionate Market is poised for continued expansion in the foreseeable future.
Food Grade Calcium Propionate Market Share Analysis: Powder held the dominant market share in 2024
In the Food Grade Calcium Propionate Market, the Powder segment is the largest, driven by its versatility, ease of handling, and wide-ranging applications across various food and beverage products. Powdered calcium propionate offers convenience in storage, transportation, and dosage control, making it the preferred form for manufacturers in the food industry. Its fine particulate size ensures uniform dispersion and effective distribution within food matrices, enhancing its efficacy as a preservative. Further, powdered calcium propionate can be seamlessly incorporated into dry mixes, doughs, and powders during food processing, contributing to its widespread usage in bakery products, dairy items, and animal feed. Additionally, the stability and extended shelf life of powdered formulations further bolster their popularity among food manufacturers. With its practical advantages and compatibility with diverse food formulations, the Powder segment maintains its dominance in the Food Grade Calcium Propionate Market.
Food Grade Calcium Propionate Market Segmentation
By End-User
Food and Beverage
Animal Feed
By Application
Bread
Bakery Products
Dairy Products
Meat and Poultry
Feed
Others
By Form
Powder
Liquid
Countries Analyzed
North America (US, Canada, Mexico)
Europe (Germany, UK, France, Spain, Italy, Russia, Rest of Europe)
Asia Pacific (China, India, Japan, South Korea, Australia, South East Asia, Rest of Asia)
South America (Brazil, Argentina, Rest of South America)
Middle East and Africa (Saudi Arabia, UAE, Rest of Middle East, South Africa, Egypt, Rest of Africa)
Food Grade Calcium Propionate Companies Profiled in the Study
AB Mauri
ABF Ingredients
Addcon GmbH
Cargill Inc
Niacet Corp
*- List Not Exhaustive
Chapter 1. TABLE OF CONTENTS
Chapter 2. Introduction to Food Grade Calcium Propionate Market
2.1. Market Overview
2.2. Key Statistics and Report Highlights
2.3. Scope of the Comprehensive Study
2.3.1. Market Definition
2.3.2 Countries and Regions Covered
2.3.3 Research Objective
2.3.4 Units, Currency, and Conversions
2.3.5 Industry Value Chain
2.4. Key Market Segments
2.5. Key Companies
2.6. Study Period
Chapter 3. Strategic Analysis Review
3.1. Food Grade Calcium Propionate Pricing Analysis and Forecast
3.2. Porter’s Five Forces
3.3. Market Ecosystem
3.4. SWOT Analysis
3.5. Regulatory Scenario
3.3. Effects of Inflation, Russia-Ukraine War, moderating economic growth, and other macroeconomic factors
Chapter 4. Competitive Landscape
4.1. Market Share Analysis
4.1.1. Global Food Grade Calcium Propionate Market Share by Company, 2023
4.1.2. Product Offerings of Leading Food Grade Calcium Propionate Companies
4.2. Market Entropy
4.2.1. New Product Launches in the Industry
4.2.2. Mergers, Acquisitions, Joint ventures, and Partnerships
4.3. Key Strategies and Best Practices
Chapter 5. Global Market Projections: Best, Reference, and Low Case Scenarios
5.1. Growth Analysis- Case Scenario Definitions
5.2. Low Growth Case Scenario Forecasts
5.3. Reference Growth Case Scenario Forecasts
5.4. High Growth Case Scenario Forecasts
Chapter 6. Market Dynamics
6.1. Food Grade Calcium Propionate Market Drivers
6.2. Food Grade Calcium Propionate Market Challenges
6.6. Food Grade Calcium Propionate Market Opportunities
6.4. Food Grade Calcium Propionate Market Trends
Chapter 7. Global Food Grade Calcium Propionate Market Outlook Trends
7.1. Global Food Grade Calcium Propionate Revenue (USD Million) and CAGR (%) by Type (2021-2032)
7.2. Global Food Grade Calcium Propionate Revenue (USD Million) and CAGR (%) by Application (2021-2032)
7.3. Global Food Grade Calcium Propionate Revenue (USD Million) and CAGR (%) by Product (2021-2032)
By End-User
Food and Beverage
Animal Feed
By Application
Bread
Bakery Products
Dairy Products
Meat and Poultry
Feed
Others
By Form
Powder
Liquid
Chapter 8. Global Food Grade Calcium Propionate Regional Analysis and Outlook
8.1. Global Food Grade Calcium Propionate Revenue (USD Million) By Regions (2021- 2032)
8.2. North America Food Grade Calcium Propionate Revenue (USD Million) by Country (2021-2032)
8.2.1. United States Food Grade Calcium Propionate Regional Analysis and Outlook
8.2.2. Canada Food Grade Calcium Propionate Regional Analysis and Outlook
8.2.3. Mexico Food Grade Calcium Propionate Regional Analysis and Outlook
8.3. Europe Food Grade Calcium Propionate Revenue (USD Million), by Country (2021-2032)
8.3.1. Germany Food Grade Calcium Propionate Regional Analysis and Outlook
8.3.2. France Food Grade Calcium Propionate Regional Analysis and Outlook
8.3.3. United Kingdom Food Grade Calcium Propionate Regional Analysis and Outlook
8.3.4. Spain Food Grade Calcium Propionate Regional Analysis and Outlook
8.3.5. Italy Food Grade Calcium Propionate Regional Analysis and Outlook
8.3.6. Russia Food Grade Calcium Propionate Regional Analysis and Outlook
8.3.7. Rest of Europe Food Grade Calcium Propionate Regional Analysis and Outlook
8.4. Asia Pacific Food Grade Calcium Propionate Revenue (USD Million) by Country (2021-2032)
8.4.1. China Food Grade Calcium Propionate Regional Analysis and Outlook
8.4.2. Japan Food Grade Calcium Propionate Regional Analysis and Outlook
8.4.3. India Food Grade Calcium Propionate Regional Analysis and Outlook
8.4.4. South Korea Food Grade Calcium Propionate Regional Analysis and Outlook
8.4.5. Australia Food Grade Calcium Propionate Regional Analysis and Outlook
8.4.6. South East Asia Food Grade Calcium Propionate Regional Analysis and Outlook
8.4.7. Rest of Asia Pacific Food Grade Calcium Propionate Regional Analysis and Outlook
8.5. South America Food Grade Calcium Propionate Revenue (USD Million), by Country (2021-2032)
8.5.1. Brazil Food Grade Calcium Propionate Regional Analysis and Outlook
8.5.2. Argentina Food Grade Calcium Propionate Regional Analysis and Outlook
8.5.3. Rest of South America Food Grade Calcium Propionate Regional Analysis and Outlook
8.6. Middle East and Africa Food Grade Calcium Propionate Revenue (USD Million) by Country (2021-2032)
8.6.1. Middle East Food Grade Calcium Propionate Regional Analysis and Outlook
8.6.2. Africa Food Grade Calcium Propionate Regional Analysis and Outlook
Chapter 9. North America Food Grade Calcium Propionate Analysis and Outlook
9.1. North America Food Grade Calcium Propionate Revenue (USD Million) by Segments (2021-2032)
9.1.1. North America Food Grade Calcium Propionate Revenue (USD Million) by Type (2021-2032)
9.1.2. North America Food Grade Calcium Propionate Revenue (USD Million) by Application (2021-2032)
9.1.3. North America Food Grade Calcium Propionate Revenue (USD Million) by Product (2021-2032)
By End-User
Food and Beverage
Animal Feed
By Application
Bread
Bakery Products
Dairy Products
Meat and Poultry
Feed
Others
By Form
Powder
Liquid
Chapter 10. Europe Food Grade Calcium Propionate Analysis and Outlook
10.1. Europe Food Grade Calcium Propionate Revenue (USD Million), by Segments (USD Million) (2021-2032)
10.1.1. Europe Food Grade Calcium Propionate Revenue (USD Million) by Type (2021-2032)
10.1.2. Europe Food Grade Calcium Propionate Revenue (USD Million) by Application (2021-2032)
10.1.3. Europe Food Grade Calcium Propionate Revenue (USD Million) by Product (2021-2032)
By End-User
Food and Beverage
Animal Feed
By Application
Bread
Bakery Products
Dairy Products
Meat and Poultry
Feed
Others
By Form
Powder
Liquid
Chapter 11. Asia Pacific Food Grade Calcium Propionate Analysis and Outlook
11.1. Asia Pacific Food Grade Calcium Propionate Revenue (USD Million), and Revenue (USD Million) by Segments (2021-2032)
11.1.1. Asia Pacific Food Grade Calcium Propionate Revenue (USD Million) by Type (2021-2032)
11.1.2. Asia Pacific Food Grade Calcium Propionate Revenue (USD Million) by Application (2021-2032)
11.1.3. Asia Pacific Food Grade Calcium Propionate Revenue (USD Million) by Product (2021-2032)
By End-User
Food and Beverage
Animal Feed
By Application
Bread
Bakery Products
Dairy Products
Meat and Poultry
Feed
Others
By Form
Powder
Liquid
Chapter 12. South America Food Grade Calcium Propionate Analysis and Outlook
12.1. South America Food Grade Calcium Propionate Revenue (USD Million), by Segments (2021-2032)
12.1.1. South America Food Grade Calcium Propionate Revenue (USD Million) by Type (2021-2032)
12.1.2. South America Food Grade Calcium Propionate Revenue (USD Million) by Application (2021-2032)
12.1.3. South America Food Grade Calcium Propionate Revenue (USD Million) by Product (2021-2032)
By End-User
Food and Beverage
Animal Feed
By Application
Bread
Bakery Products
Dairy Products
Meat and Poultry
Feed
Others
By Form
Powder
Liquid
Chapter 13. Middle East and Africa Food Grade Calcium Propionate Analysis and Outlook
13.1. Middle East and Africa Food Grade Calcium Propionate Revenue (USD Million), by Segments (2021-2032)
13.1.1. Middle East and Africa Food Grade Calcium Propionate Revenue (USD Million) by Type (2021-2032)
13.1.2. Middle East and Africa Food Grade Calcium Propionate Revenue (USD Million) by Application (2021-2032)
13.1.3. Middle East and Africa Food Grade Calcium Propionate Revenue (USD Million) by Product (2021-2032)
By End-User
Food and Beverage
Animal Feed
By Application
Bread
Bakery Products
Dairy Products
Meat and Poultry
Feed
Others
By Form
Powder
Liquid
Chapter 14. Food Grade Calcium Propionate Company Profiles
14.1 Business Overview
14.2 Product Profiles
14.3 SWOT Profiles
14.5 Recent Developments
14.6 Financial Profile
List of Companies
AB Mauri
ABF Ingredients
Addcon GmbH
Cargill Inc
Niacet Corp
15. Methodology and Data Sources
15.1 Customization Offerings
15.2 Subscription Services
15.3 Related Reports
15.4 Publisher Expertise
LIST OF TABLES
Table 1 Market Segmentation Analysis
Table 2 Global Food Grade Calcium Propionate Market Share of Leading Companies, 2023
Table 3 Product Offerings of Leading Companies
Table 4 Low Growth Scenario Forecasts
Table 5 Reference Case Growth Scenario
Table 6 High Growth Case Scenario
Table 7 Global Food Grade Calcium Propionate Revenue (USD Million) And CAGR (%) By Type (2021-2032)
Table 8 Global Food Grade Calcium Propionate Revenue (USD Million) And CAGR (%) By Application (2021-2032)
Table 9 Global Food Grade Calcium Propionate Revenue (USD Million) And CAGR (%) By Product (2021-2032)
Table 10 Global Food Grade Calcium Propionate Market Revenue (USD Million) By Regions (2021-2032)
Table 11 Global Food Grade Calcium Propionate Market Share (%) By Regions (2021-2032)
Table 12 North America Food Grade Calcium Propionate Revenue (USD Million) By Country (2021-2032)
Table 13 Europe Food Grade Calcium Propionate Revenue (USD Million) By Country (2021-2032)
Table 14 Asia Pacific Food Grade Calcium Propionate Revenue (USD Million) By Country (2021-2032)
Table 15 South America Food Grade Calcium Propionate Revenue (USD Million) By Country (2021-2032)
Table 16 Middle East and Africa Food Grade Calcium Propionate Revenue (USD Million) By Region (2021-2032)
Table 17 North America Food Grade Calcium Propionate Revenue (USD Million) By Type (2021-2032)
Table 18 North America Food Grade Calcium Propionate Revenue (USD Million) By Application (2021-2032)
Table 19 North America Food Grade Calcium Propionate Revenue (USD Million) By Product (2021-2032)
Table 20 Europe Food Grade Calcium Propionate Revenue (USD Million) By Type (2021-2032)
Table 21 Europe Food Grade Calcium Propionate Revenue (USD Million) By Application (2021-2032)
Table 22 Europe Food Grade Calcium Propionate Revenue (USD Million) By Product (2021-2032)
Table 23 Asia Pacific Food Grade Calcium Propionate Revenue (USD Million) By Type (2021-2032)
Table 24 Asia Pacific Food Grade Calcium Propionate Revenue (USD Million) By Application (2021-2032)
Table 25 Asia Pacific Food Grade Calcium Propionate Revenue (USD Million) By Product (2021-2032)
Table 26 South America Food Grade Calcium Propionate Revenue (USD Million) By Type (2021-2032)
Table 27 South America Food Grade Calcium Propionate Revenue (USD Million) By Application (2021-2032)
Table 28 South America Food Grade Calcium Propionate Revenue (USD Million) By Product (2021-2032)
Table 29 Middle East and Africa Food Grade Calcium Propionate Revenue (USD Million) By Type (2021-2032)
Table 30 Middle East and Africa Food Grade Calcium Propionate Revenue (USD Million) By Application (2021-2032)
Table 31 Middle East and Africa Food Grade Calcium Propionate Revenue (USD Million) By Product (2021-2032)
LIST OF FIGURES
Figure 1. Market Scope
Figure 2. Pricing Forecasts Per Unit, 2023- 2032
Figure 3. Porter’s Five Forces
Figure 4. Global Food Grade Calcium Propionate Market Revenue (USD Million) By Regions (2021-2032)
Figure 5. Global Food Grade Calcium Propionate Market Share (%) By Regions (2023)
Figure 6. North America Food Grade Calcium Propionate Revenue (USD Million) By Country (2021-2032)
Figure 7. United States Food Grade Calcium Propionate Revenue (USD Million) By Country (2021-2032)
Figure 8. Canada Food Grade Calcium Propionate Revenue (USD Million) By Country (2021-2032)
Figure 9. Mexico Food Grade Calcium Propionate Revenue (USD Million) By Country (2021-2032)
Figure 10. Europe Food Grade Calcium Propionate Revenue (USD Million) By Country (2021-2032)
Figure 11. Germany Food Grade Calcium Propionate Revenue (USD Million) By Country (2021-2032)
Figure 12. France Food Grade Calcium Propionate Revenue (USD Million) By Country (2021-2032)
Figure 13. United Kingdom Food Grade Calcium Propionate Revenue (USD Million) By Country (2021-2032)
Figure 14. Spain Food Grade Calcium Propionate Revenue (USD Million) By Country (2021-2032)
Figure 15. Italy Food Grade Calcium Propionate Revenue (USD Million) By Country (2021-2032)
Figure 16. Russia Food Grade Calcium Propionate Revenue (USD Million) By Country (2021-2032)
Figure 17. Rest of Europe Food Grade Calcium Propionate Revenue (USD Million) By Country (2021-2032)
Figure 11. Asia Pacific Food Grade Calcium Propionate Revenue (USD Million) By Country (2021-2032)
Figure 12. China Food Grade Calcium Propionate Revenue (USD Million) By Country (2021-2032)
Figure 13. Japan Food Grade Calcium Propionate Revenue (USD Million) By Country (2021-2032)
Figure 14. India Food Grade Calcium Propionate Revenue (USD Million) By Country (2021-2032)
Figure 15. South Korea Food Grade Calcium Propionate Revenue (USD Million) By Country (2021-2032)
Figure 16. Australia Food Grade Calcium Propionate Revenue (USD Million) By Country (2021-2032)
Figure 17. South East Asia Food Grade Calcium Propionate Revenue (USD Million) By Country (2021-2032)
Figure 18. South America Food Grade Calcium Propionate Revenue (USD Million) By Country (2021-2032)
Figure 19. Brazil Food Grade Calcium Propionate Revenue (USD Million) By Country (2021-2032)
Figure 20. Argentina Food Grade Calcium Propionate Revenue (USD Million) By Country (2021-2032)
Figure 21. Rest of Asia Pacific Food Grade Calcium Propionate Revenue (USD Million) By Country (2021-2032)
Figure 22. Middle East and Africa Food Grade Calcium Propionate Revenue (USD Million) By Region (2021-2032)
Figure 23. Saudi Arabia Food Grade Calcium Propionate Revenue (USD Million) By Region (2021-2032)
Figure 24. The UAE Food Grade Calcium Propionate Revenue (USD Million) By Region (2021-2032)
Figure 25. Rest of Middle East Food Grade Calcium Propionate Revenue (USD Million) By Region (2021-2032)
Figure 26. South Africa Food Grade Calcium Propionate Revenue (USD Million) By Region (2021-2032)
Figure 27. Africa Food Grade Calcium Propionate Revenue (USD Million) By Region (2021-2032)
Figure 28. North America Food Grade Calcium Propionate Revenue (USD Million) By Type (2021-2032)
Figure 29. North America Food Grade Calcium Propionate Revenue (USD Million) By Application (2021-2032)
Figure 30. North America Food Grade Calcium Propionate Revenue (USD Million) By Product (2021-2032)
Figure 31. Europe Food Grade Calcium Propionate Revenue (USD Million) By Type (2021-2032)
Figure 32. Europe Food Grade Calcium Propionate Revenue (USD Million) By Application (2021-2032)
Figure 33. Europe Food Grade Calcium Propionate Revenue (USD Million) By Product (2021-2032)
Figure 34. Asia Pacific Food Grade Calcium Propionate Revenue (USD Million) By Type (2021-2032)
Figure 35. Asia Pacific Food Grade Calcium Propionate Revenue (USD Million) By Application (2021-2032)
Figure 36. Asia Pacific Food Grade Calcium Propionate Revenue (USD Million) By Product (2021-2032)
Figure 37. South America Food Grade Calcium Propionate Revenue (USD Million) By Type (2021-2032)
Figure 38. South America Food Grade Calcium Propionate Revenue (USD Million) By Application (2021-2032)
Figure 39. South America Food Grade Calcium Propionate Revenue (USD Million) By Product (2021-2032)
Figure 40. Middle East and Africa Food Grade Calcium Propionate Revenue (USD Million) By Type (2021-2032)
Figure 41. Middle East and Africa Food Grade Calcium Propionate Revenue (USD Million) By Application (2021-2032)
Figure 42. Middle East and Africa Food Grade Calcium Propionate Revenue (USD Million) By Product (2021-2032)
By End-User
Food and Beverage
Animal Feed
By Application
Bread
Bakery Products
Dairy Products
Meat and Poultry
Feed
Others
By Form
Powder
Liquid
Countries Analyzed
North America (US, Canada, Mexico)
Europe (Germany, UK, France, Spain, Italy, Russia, Rest of Europe)
Asia Pacific (China, India, Japan, South Korea, Australia, South East Asia, Rest of Asia)
South America (Brazil, Argentina, Rest of South America)
Middle East and Africa (Saudi Arabia, UAE, Rest of Middle East, South Africa, Egypt, Rest of Africa)
