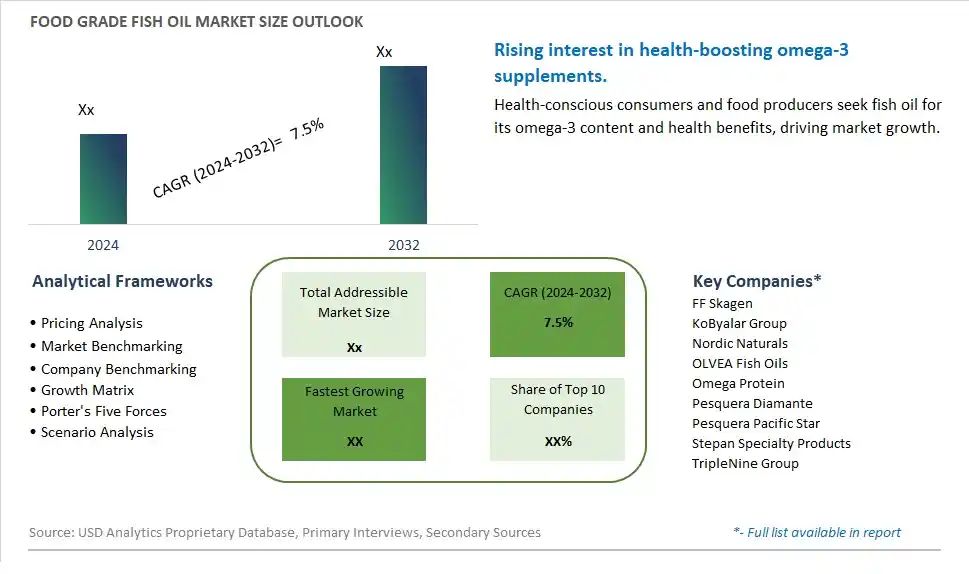
Global Food Grade Fish Oil Market Size is valued at $XX Million in 2024 and is forecast to register a growth rate (CAGR) of 7.5% to reach $XX Million by 2032.
The global Food Grade Fish Oil Market Comprehensive Study analyzes and forecasts the market size across 6 regions and 24 countries for diverse segments -By Type (Salmon and Trout, Marine Fish, Carps, Tilapias, Others), By Application (Animal Feed and Nutrition, Food and Beverage, Nutraceutical, Others)
An Introduction to Food Grade Fish Oil Market
The Food Grade Fish Oil market in 2024 is thriving, fueled by the rising demand for omega-3-rich ingredients in dietary supplements and functional foods. Food-grade fish oil, rich in EPA and DHA, is popular for its cardiovascular, cognitive, and anti-inflammatory benefits. The market benefits from advancements in fish oil extraction and purification technologies, the growing trend of health and wellness, and the expansion of the nutraceutical sector. Additionally, the increasing focus on sustainable and high-quality sources of fish oil is driving market growth.
Food Grade Fish Oil Competitive Landscape
The market report analyses the leading companies in the industry including FF Skagen, KoByalar Group, Nordic Naturals, OLVEA Fish Oils, Omega Protein, Pesquera Diamante, Pesquera Pacific Star, Stepan Specialty Products, TripleNine Group, and Others.
Food Grade Fish Oil Market Dynamics
Food Grade Fish Oil Market Trend: Growing Demand for Omega-3 Fatty Acids in Functional Foods
One prominent trend in the food grade fish oil market is the growing demand for omega-3 fatty acids in functional foods. Consumers are increasingly aware of the health benefits associated with omega-3s, such as cardiovascular support, brain health, and anti-inflammatory properties. Fish oil, rich in EPA (eicosapentaenoic acid) and DHA (docosahexaenoic acid), is a valuable source of omega-3s and is being incorporated into a variety of functional food products, including fortified beverages, snacks, and supplements. This trend is driven by consumer interest in health-promoting ingredients and dietary supplements that offer additional nutritional benefits beyond basic nutrition, leading to the integration of food grade fish oil into innovative food formulations.
Food Grade Fish Oil Market Driver: Wellness and Nutritional Awareness Among Consumers
A key driver propelling the food grade fish oil market is the increasing wellness and nutritional awareness among consumers. As individuals prioritize health and well-being, they are actively seeking out foods and supplements that support their nutritional needs and promote overall wellness. Fish oil's reputation as a source of essential omega-3 fatty acids, coupled with scientific research highlighting its health benefits, drives consumer demand for products containing food grade fish oil. The driver behind this trend is the desire for functional ingredients that contribute to a balanced diet, address specific health concerns, and align with consumers' proactive approach to maintaining good health through dietary choices.
Food Grade Fish Oil Market Opportunity: Development of Omega-3 Enriched Functional Foods
A significant opportunity in the food grade fish oil market lies in the development of omega-3 enriched functional foods that cater to the growing demand for health-focused products. Companies can capitalize on this opportunity by fortifying a wide range of food categories, such as dairy products, baked goods, cereals, and beverages, with food grade fish oil to boost their omega-3 content. Additionally, there's potential for creating customized fish oil blends with improved taste, odor, and stability profiles, making them more palatable and appealing to consumers. By focusing on innovation and offering omega-3 enriched functional foods, companies can differentiate their products, meet consumer expectations for health-enhancing ingredients, and contribute to the expansion of the market for nutritious and functional food options.
Food Grade Fish Oil Market Share Analysis: Salmon and Trout segment generated the highest revenue share in the industry
The Salmon and Trout segment emerges as the largest in the Food Grade Fish Oil market, driven by several compelling factors. Salmon and trout are renowned for their high omega-3 fatty acid content, particularly EPA (eicosapentaenoic acid) and DHA (docosahexaenoic acid), which are essential for heart health and cognitive function. These fish species are predominantly sourced from cold-water regions, where environmental conditions promote optimal omega-3 accumulation. As consumer awareness of the health benefits associated with omega-3 fatty acids continues to rise, demand for salmon and trout-derived fish oil has surged in dietary supplements, functional foods, and pharmaceutical applications. Additionally, technological advancements in fish oil extraction methods have enhanced the purity and bioavailability of omega-3 fatty acids from salmon and trout, further bolstering their popularity. With increasing adoption of healthy lifestyles and dietary habits worldwide, the Salmon and Trout segment is poised for sustained growth, supported by its nutritional profile and versatile applications across various consumer segments.
Food Grade Fish Oil Market Share Analysis: Nutraceutical is the fastest growing segment over the forecast period to 2032
The Nutraceutical segment is expected to be the fastest-growing application segment in the Food Grade Fish Oil market through 2032. This growth is driven by increasing consumer awareness and demand for dietary supplements enriched with omega-3 fatty acids, particularly EPA (eicosapentaenoic acid) and DHA (docosahexaenoic acid), which are abundant in fish oil. Omega-3 fatty acids offer various health benefits, including cardiovascular health, cognitive function support, and anti-inflammatory properties, making them highly sought after in the nutraceutical industry. Further, ongoing research highlighting the importance of omega-3s in promoting overall well-being and preventing chronic diseases like heart disease and arthritis further propels market growth. Regulatory initiatives promoting the use of omega-3 enriched supplements and functional foods also contribute to the segment's expansion. As consumers increasingly prioritize preventive healthcare and wellness trends, the Nutraceutical segment presents significant opportunities for market players investing in Food Grade Fish Oil, driven by its role in enhancing dietary health and promoting longevity.
Food Grade Fish Oil Market Segmentation
By Type
Salmon and Trout
Marine Fish
Carps
Tilapias
Others
By Application
Animal Feed and Nutrition
Food and Beverage
Nutraceutical
Others
Countries Analyzed
North America (US, Canada, Mexico)
Europe (Germany, UK, France, Spain, Italy, Russia, Rest of Europe)
Asia Pacific (China, India, Japan, South Korea, Australia, South East Asia, Rest of Asia)
South America (Brazil, Argentina, Rest of South America)
Middle East and Africa (Saudi Arabia, UAE, Rest of Middle East, South Africa, Egypt, Rest of Africa)
Food Grade Fish Oil Companies Profiled in the Study
FF Skagen
KoByalar Group
Nordic Naturals
OLVEA Fish Oils
Omega Protein
Pesquera Diamante
Pesquera Pacific Star
Stepan Specialty Products
TripleNine Group
*- List Not Exhaustive
Chapter 1. TABLE OF CONTENTS
Chapter 2. Introduction to Food Grade Fish Oil Market
2.1. Market Overview
2.2. Key Statistics and Report Highlights
2.3. Scope of the Comprehensive Study
2.3.1. Market Definition
2.3.2 Countries and Regions Covered
2.3.3 Research Objective
2.3.4 Units, Currency, and Conversions
2.3.5 Industry Value Chain
2.4. Key Market Segments
2.5. Key Companies
2.6. Study Period
Chapter 3. Strategic Analysis Review
3.1. Food Grade Fish Oil Pricing Analysis and Forecast
3.2. Porter’s Five Forces
3.3. Market Ecosystem
3.4. SWOT Analysis
3.5. Regulatory Scenario
3.3. Effects of Inflation, Russia-Ukraine War, moderating economic growth, and other macroeconomic factors
Chapter 4. Competitive Landscape
4.1. Market Share Analysis
4.1.1. Global Food Grade Fish Oil Market Share by Company, 2023
4.1.2. Product Offerings of Leading Food Grade Fish Oil Companies
4.2. Market Entropy
4.2.1. New Product Launches in the Industry
4.2.2. Mergers, Acquisitions, Joint ventures, and Partnerships
4.3. Key Strategies and Best Practices
Chapter 5. Global Market Projections: Best, Reference, and Low Case Scenarios
5.1. Growth Analysis- Case Scenario Definitions
5.2. Low Growth Case Scenario Forecasts
5.3. Reference Growth Case Scenario Forecasts
5.4. High Growth Case Scenario Forecasts
Chapter 6. Market Dynamics
6.1. Food Grade Fish Oil Market Drivers
6.2. Food Grade Fish Oil Market Challenges
6.6. Food Grade Fish Oil Market Opportunities
6.4. Food Grade Fish Oil Market Trends
Chapter 7. Global Food Grade Fish Oil Market Outlook Trends
7.1. Global Food Grade Fish Oil Revenue (USD Million) and CAGR (%) by Type (2021-2032)
7.2. Global Food Grade Fish Oil Revenue (USD Million) and CAGR (%) by Application (2021-2032)
7.3. Global Food Grade Fish Oil Revenue (USD Million) and CAGR (%) by Product (2021-2032)
By Type
Salmon and Trout
Marine Fish
Carps
Tilapias
Others
By Application
Animal Feed and Nutrition
Food and Beverage
Nutraceutical
Others
Chapter 8. Global Food Grade Fish Oil Regional Analysis and Outlook
8.1. Global Food Grade Fish Oil Revenue (USD Million) By Regions (2021- 2032)
8.2. North America Food Grade Fish Oil Revenue (USD Million) by Country (2021-2032)
8.2.1. United States Food Grade Fish Oil Regional Analysis and Outlook
8.2.2. Canada Food Grade Fish Oil Regional Analysis and Outlook
8.2.3. Mexico Food Grade Fish Oil Regional Analysis and Outlook
8.3. Europe Food Grade Fish Oil Revenue (USD Million), by Country (2021-2032)
8.3.1. Germany Food Grade Fish Oil Regional Analysis and Outlook
8.3.2. France Food Grade Fish Oil Regional Analysis and Outlook
8.3.3. United Kingdom Food Grade Fish Oil Regional Analysis and Outlook
8.3.4. Spain Food Grade Fish Oil Regional Analysis and Outlook
8.3.5. Italy Food Grade Fish Oil Regional Analysis and Outlook
8.3.6. Russia Food Grade Fish Oil Regional Analysis and Outlook
8.3.7. Rest of Europe Food Grade Fish Oil Regional Analysis and Outlook
8.4. Asia Pacific Food Grade Fish Oil Revenue (USD Million) by Country (2021-2032)
8.4.1. China Food Grade Fish Oil Regional Analysis and Outlook
8.4.2. Japan Food Grade Fish Oil Regional Analysis and Outlook
8.4.3. India Food Grade Fish Oil Regional Analysis and Outlook
8.4.4. South Korea Food Grade Fish Oil Regional Analysis and Outlook
8.4.5. Australia Food Grade Fish Oil Regional Analysis and Outlook
8.4.6. South East Asia Food Grade Fish Oil Regional Analysis and Outlook
8.4.7. Rest of Asia Pacific Food Grade Fish Oil Regional Analysis and Outlook
8.5. South America Food Grade Fish Oil Revenue (USD Million), by Country (2021-2032)
8.5.1. Brazil Food Grade Fish Oil Regional Analysis and Outlook
8.5.2. Argentina Food Grade Fish Oil Regional Analysis and Outlook
8.5.3. Rest of South America Food Grade Fish Oil Regional Analysis and Outlook
8.6. Middle East and Africa Food Grade Fish Oil Revenue (USD Million) by Country (2021-2032)
8.6.1. Middle East Food Grade Fish Oil Regional Analysis and Outlook
8.6.2. Africa Food Grade Fish Oil Regional Analysis and Outlook
Chapter 9. North America Food Grade Fish Oil Analysis and Outlook
9.1. North America Food Grade Fish Oil Revenue (USD Million) by Segments (2021-2032)
9.1.1. North America Food Grade Fish Oil Revenue (USD Million) by Type (2021-2032)
9.1.2. North America Food Grade Fish Oil Revenue (USD Million) by Application (2021-2032)
9.1.3. North America Food Grade Fish Oil Revenue (USD Million) by Product (2021-2032)
By Type
Salmon and Trout
Marine Fish
Carps
Tilapias
Others
By Application
Animal Feed and Nutrition
Food and Beverage
Nutraceutical
Others
Chapter 10. Europe Food Grade Fish Oil Analysis and Outlook
10.1. Europe Food Grade Fish Oil Revenue (USD Million), by Segments (USD Million) (2021-2032)
10.1.1. Europe Food Grade Fish Oil Revenue (USD Million) by Type (2021-2032)
10.1.2. Europe Food Grade Fish Oil Revenue (USD Million) by Application (2021-2032)
10.1.3. Europe Food Grade Fish Oil Revenue (USD Million) by Product (2021-2032)
By Type
Salmon and Trout
Marine Fish
Carps
Tilapias
Others
By Application
Animal Feed and Nutrition
Food and Beverage
Nutraceutical
Others
Chapter 11. Asia Pacific Food Grade Fish Oil Analysis and Outlook
11.1. Asia Pacific Food Grade Fish Oil Revenue (USD Million), and Revenue (USD Million) by Segments (2021-2032)
11.1.1. Asia Pacific Food Grade Fish Oil Revenue (USD Million) by Type (2021-2032)
11.1.2. Asia Pacific Food Grade Fish Oil Revenue (USD Million) by Application (2021-2032)
11.1.3. Asia Pacific Food Grade Fish Oil Revenue (USD Million) by Product (2021-2032)
By Type
Salmon and Trout
Marine Fish
Carps
Tilapias
Others
By Application
Animal Feed and Nutrition
Food and Beverage
Nutraceutical
Others
Chapter 12. South America Food Grade Fish Oil Analysis and Outlook
12.1. South America Food Grade Fish Oil Revenue (USD Million), by Segments (2021-2032)
12.1.1. South America Food Grade Fish Oil Revenue (USD Million) by Type (2021-2032)
12.1.2. South America Food Grade Fish Oil Revenue (USD Million) by Application (2021-2032)
12.1.3. South America Food Grade Fish Oil Revenue (USD Million) by Product (2021-2032)
By Type
Salmon and Trout
Marine Fish
Carps
Tilapias
Others
By Application
Animal Feed and Nutrition
Food and Beverage
Nutraceutical
Others
Chapter 13. Middle East and Africa Food Grade Fish Oil Analysis and Outlook
13.1. Middle East and Africa Food Grade Fish Oil Revenue (USD Million), by Segments (2021-2032)
13.1.1. Middle East and Africa Food Grade Fish Oil Revenue (USD Million) by Type (2021-2032)
13.1.2. Middle East and Africa Food Grade Fish Oil Revenue (USD Million) by Application (2021-2032)
13.1.3. Middle East and Africa Food Grade Fish Oil Revenue (USD Million) by Product (2021-2032)
By Type
Salmon and Trout
Marine Fish
Carps
Tilapias
Others
By Application
Animal Feed and Nutrition
Food and Beverage
Nutraceutical
Others
Chapter 14. Food Grade Fish Oil Company Profiles
14.1 Business Overview
14.2 Product Profiles
14.3 SWOT Profiles
14.5 Recent Developments
14.6 Financial Profile
List of Companies
FF Skagen
KoByalar Group
Nordic Naturals
OLVEA Fish Oils
Omega Protein
Pesquera Diamante
Pesquera Pacific Star
Stepan Specialty Products
TripleNine Group
15. Methodology and Data Sources
15.1 Customization Offerings
15.2 Subscription Services
15.3 Related Reports
15.4 Publisher Expertise
LIST OF TABLES
Table 1 Market Segmentation Analysis
Table 2 Global Food Grade Fish Oil Market Share of Leading Companies, 2023
Table 3 Product Offerings of Leading Companies
Table 4 Low Growth Scenario Forecasts
Table 5 Reference Case Growth Scenario
Table 6 High Growth Case Scenario
Table 7 Global Food Grade Fish Oil Revenue (USD Million) And CAGR (%) By Type (2021-2032)
Table 8 Global Food Grade Fish Oil Revenue (USD Million) And CAGR (%) By Application (2021-2032)
Table 9 Global Food Grade Fish Oil Revenue (USD Million) And CAGR (%) By Product (2021-2032)
Table 10 Global Food Grade Fish Oil Market Revenue (USD Million) By Regions (2021-2032)
Table 11 Global Food Grade Fish Oil Market Share (%) By Regions (2021-2032)
Table 12 North America Food Grade Fish Oil Revenue (USD Million) By Country (2021-2032)
Table 13 Europe Food Grade Fish Oil Revenue (USD Million) By Country (2021-2032)
Table 14 Asia Pacific Food Grade Fish Oil Revenue (USD Million) By Country (2021-2032)
Table 15 South America Food Grade Fish Oil Revenue (USD Million) By Country (2021-2032)
Table 16 Middle East and Africa Food Grade Fish Oil Revenue (USD Million) By Region (2021-2032)
Table 17 North America Food Grade Fish Oil Revenue (USD Million) By Type (2021-2032)
Table 18 North America Food Grade Fish Oil Revenue (USD Million) By Application (2021-2032)
Table 19 North America Food Grade Fish Oil Revenue (USD Million) By Product (2021-2032)
Table 20 Europe Food Grade Fish Oil Revenue (USD Million) By Type (2021-2032)
Table 21 Europe Food Grade Fish Oil Revenue (USD Million) By Application (2021-2032)
Table 22 Europe Food Grade Fish Oil Revenue (USD Million) By Product (2021-2032)
Table 23 Asia Pacific Food Grade Fish Oil Revenue (USD Million) By Type (2021-2032)
Table 24 Asia Pacific Food Grade Fish Oil Revenue (USD Million) By Application (2021-2032)
Table 25 Asia Pacific Food Grade Fish Oil Revenue (USD Million) By Product (2021-2032)
Table 26 South America Food Grade Fish Oil Revenue (USD Million) By Type (2021-2032)
Table 27 South America Food Grade Fish Oil Revenue (USD Million) By Application (2021-2032)
Table 28 South America Food Grade Fish Oil Revenue (USD Million) By Product (2021-2032)
Table 29 Middle East and Africa Food Grade Fish Oil Revenue (USD Million) By Type (2021-2032)
Table 30 Middle East and Africa Food Grade Fish Oil Revenue (USD Million) By Application (2021-2032)
Table 31 Middle East and Africa Food Grade Fish Oil Revenue (USD Million) By Product (2021-2032)
LIST OF FIGURES
Figure 1. Market Scope
Figure 2. Pricing Forecasts Per Unit, 2023- 2032
Figure 3. Porter’s Five Forces
Figure 4. Global Food Grade Fish Oil Market Revenue (USD Million) By Regions (2021-2032)
Figure 5. Global Food Grade Fish Oil Market Share (%) By Regions (2023)
Figure 6. North America Food Grade Fish Oil Revenue (USD Million) By Country (2021-2032)
Figure 7. United States Food Grade Fish Oil Revenue (USD Million) By Country (2021-2032)
Figure 8. Canada Food Grade Fish Oil Revenue (USD Million) By Country (2021-2032)
Figure 9. Mexico Food Grade Fish Oil Revenue (USD Million) By Country (2021-2032)
Figure 10. Europe Food Grade Fish Oil Revenue (USD Million) By Country (2021-2032)
Figure 11. Germany Food Grade Fish Oil Revenue (USD Million) By Country (2021-2032)
Figure 12. France Food Grade Fish Oil Revenue (USD Million) By Country (2021-2032)
Figure 13. United Kingdom Food Grade Fish Oil Revenue (USD Million) By Country (2021-2032)
Figure 14. Spain Food Grade Fish Oil Revenue (USD Million) By Country (2021-2032)
Figure 15. Italy Food Grade Fish Oil Revenue (USD Million) By Country (2021-2032)
Figure 16. Russia Food Grade Fish Oil Revenue (USD Million) By Country (2021-2032)
Figure 17. Rest of Europe Food Grade Fish Oil Revenue (USD Million) By Country (2021-2032)
Figure 11. Asia Pacific Food Grade Fish Oil Revenue (USD Million) By Country (2021-2032)
Figure 12. China Food Grade Fish Oil Revenue (USD Million) By Country (2021-2032)
Figure 13. Japan Food Grade Fish Oil Revenue (USD Million) By Country (2021-2032)
Figure 14. India Food Grade Fish Oil Revenue (USD Million) By Country (2021-2032)
Figure 15. South Korea Food Grade Fish Oil Revenue (USD Million) By Country (2021-2032)
Figure 16. Australia Food Grade Fish Oil Revenue (USD Million) By Country (2021-2032)
Figure 17. South East Asia Food Grade Fish Oil Revenue (USD Million) By Country (2021-2032)
Figure 18. South America Food Grade Fish Oil Revenue (USD Million) By Country (2021-2032)
Figure 19. Brazil Food Grade Fish Oil Revenue (USD Million) By Country (2021-2032)
Figure 20. Argentina Food Grade Fish Oil Revenue (USD Million) By Country (2021-2032)
Figure 21. Rest of Asia Pacific Food Grade Fish Oil Revenue (USD Million) By Country (2021-2032)
Figure 22. Middle East and Africa Food Grade Fish Oil Revenue (USD Million) By Region (2021-2032)
Figure 23. Saudi Arabia Food Grade Fish Oil Revenue (USD Million) By Region (2021-2032)
Figure 24. The UAE Food Grade Fish Oil Revenue (USD Million) By Region (2021-2032)
Figure 25. Rest of Middle East Food Grade Fish Oil Revenue (USD Million) By Region (2021-2032)
Figure 26. South Africa Food Grade Fish Oil Revenue (USD Million) By Region (2021-2032)
Figure 27. Africa Food Grade Fish Oil Revenue (USD Million) By Region (2021-2032)
Figure 28. North America Food Grade Fish Oil Revenue (USD Million) By Type (2021-2032)
Figure 29. North America Food Grade Fish Oil Revenue (USD Million) By Application (2021-2032)
Figure 30. North America Food Grade Fish Oil Revenue (USD Million) By Product (2021-2032)
Figure 31. Europe Food Grade Fish Oil Revenue (USD Million) By Type (2021-2032)
Figure 32. Europe Food Grade Fish Oil Revenue (USD Million) By Application (2021-2032)
Figure 33. Europe Food Grade Fish Oil Revenue (USD Million) By Product (2021-2032)
Figure 34. Asia Pacific Food Grade Fish Oil Revenue (USD Million) By Type (2021-2032)
Figure 35. Asia Pacific Food Grade Fish Oil Revenue (USD Million) By Application (2021-2032)
Figure 36. Asia Pacific Food Grade Fish Oil Revenue (USD Million) By Product (2021-2032)
Figure 37. South America Food Grade Fish Oil Revenue (USD Million) By Type (2021-2032)
Figure 38. South America Food Grade Fish Oil Revenue (USD Million) By Application (2021-2032)
Figure 39. South America Food Grade Fish Oil Revenue (USD Million) By Product (2021-2032)
Figure 40. Middle East and Africa Food Grade Fish Oil Revenue (USD Million) By Type (2021-2032)
Figure 41. Middle East and Africa Food Grade Fish Oil Revenue (USD Million) By Application (2021-2032)
Figure 42. Middle East and Africa Food Grade Fish Oil Revenue (USD Million) By Product (2021-2032)
By Type
Salmon and Trout
Marine Fish
Carps
Tilapias
Others
By Application
Animal Feed and Nutrition
Food and Beverage
Nutraceutical
Others
Countries Analyzed
North America (US, Canada, Mexico)
Europe (Germany, UK, France, Spain, Italy, Russia, Rest of Europe)
Asia Pacific (China, India, Japan, South Korea, Australia, South East Asia, Rest of Asia)
South America (Brazil, Argentina, Rest of South America)
Middle East and Africa (Saudi Arabia, UAE, Rest of Middle East, South Africa, Egypt, Rest of Africa)
