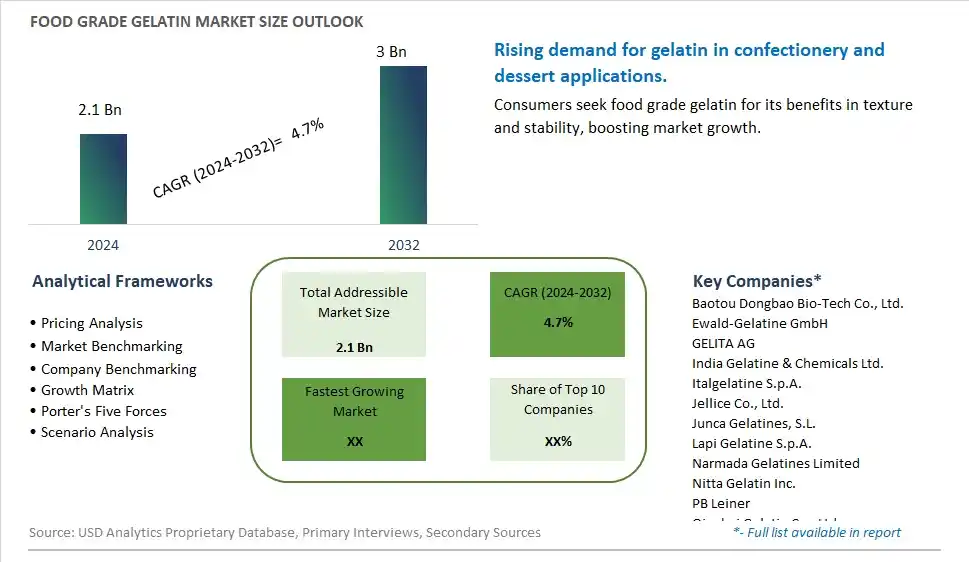
Global Food grade Gelatin Market Size is valued at $2.1 Billion in 2024 and is forecast to register a growth rate (CAGR) of 4.7% to reach $3 Billion by 2032.
The global Food grade Gelatin Market Comprehensive Study analyzes and forecasts the market size across 6 regions and 24 countries for diverse segments -By Source (Animal, Marine), By Application (Bakery and Confectionery, Meat Products, Dairy and Desserts, Beverages, Others), By Type (Skin Gelatin, Bone Gelatin, Halal Gelatin)
An Introduction to Food grade Gelatin Market
The food grade gelatin market in 2024 is expanding rapidly, driven by the demand for versatile and functional ingredients used in food and beverage applications. Food grade gelatin, derived from animal collagen, offers excellent gelling, thickening, and stabilizing properties. The market benefits from innovations in gelatin extraction and processing technologies that enhance purity and performance. The trend towards clean label and natural ingredients is influencing product development. Increasing consumer interest in functional foods and the popularity of gelatin-based products, such as gummies and marshmallows, are further propelling market growth.
Food grade Gelatin Competitive Landscape
The market report analyses the leading companies in the industry including Baotou Dongbao Bio-Tech Co., Ltd., Ewald-Gelatine GmbH, GELITA AG, India Gelatine & Chemicals Ltd., Italgelatine S.p.A., Jellice Co., Ltd., Junca Gelatines, S.L., Lapi Gelatine S.p.A., Narmada Gelatines Limited, Nitta Gelatin Inc., PB Leiner, Qinghai Gelatin Co., Ltd., Qunli Gelatin Chemical Co., Ltd., Rousselot B.V., Sam Mi Industrial Co., Ltd., Sterling Biotech Limited, Trobas Gelatine B.V., Weishardt Group, Yasin Gelatin Co., Ltd., and Others.
Food grade Gelatin Market Dynamics
Food Grade Gelatin Market Trend: Increasing Use in Nutraceutical and Functional Foods
The most prominent trend in the Food Grade Gelatin Market is the increasing use in nutraceutical and functional foods. Food grade gelatin, known for its gelling, thickening, and stabilizing properties, is being incorporated into a variety of health products, driven by the demand for ingredients that enhance texture and offer health benefits. This trend is fueled by the growing interest in functional foods that support overall wellness.
Food Grade Gelatin Market Driver: Health Consciousness and Demand for Natural Ingredients
A key driver in the Food Grade Gelatin Market is health consciousness and the demand for natural ingredients. As more individuals focus on consuming products free from synthetic additives and rich in natural nutrients, there is a rising demand for food grade gelatin that provides essential amino acids and supports joint and skin health. This demand supports market growth as consumers seek natural and health-enhancing food ingredients.
Food Grade Gelatin Market Opportunity: Innovation in High-Protein and Low-Calorie Products
One significant opportunity in the Food Grade Gelatin Market lies in innovation in high-protein and low-calorie products. Companies can develop new food products that utilize gelatin to create healthy snacks, protein bars, and low-calorie desserts, catering to health-conscious consumers. By offering diverse and health-focused gelatin options, manufacturers can attract a broader consumer base and drive market growth.
Food Grade Gelatin Market Share Analysis- Largest Segment by Source
In the Food Grade Gelatin Market, the Animal source segment is the largest. This dominance is primarily due to the widespread availability and cost-effectiveness of gelatin derived from animal sources, such as pork and beef. Animal-based gelatin is commonly used in a variety of food products, including confectioneries, dairy products, and desserts, due to its excellent gelling, thickening, and stabilizing properties. The established infrastructure for sourcing and processing animal-based gelatin and its long-standing use in the food industry contribute to its position as the largest segment.
Food Grade Gelatin Market Share Analysis- Poised to Grow Fastest Over the Next Five Years by Application
The Bakery and Confectionery application segment in the Food Grade Gelatin Market is poised to grow the fastest over the next five years. This growth is fueled by the increasing demand for innovative and high-quality baked goods and confectionery products. Gelatin is widely used in these applications to improve texture, mouthfeel, and stability. As the bakery and confectionery industry evolves with new product formulations and consumer preferences for premium and artisanal products, the demand for food grade gelatin to meet these needs is expected to rise rapidly.
Food Grade Gelatin Market Share Analysis- Largest Segment by Type
In the Food Grade Gelatin Market, Skin Gelatin is the largest segment. This type of gelatin is derived primarily from pigskin and is widely used due to its high quality and versatility. Skin gelatin is used in a range of food products including desserts, candies, and marshmallows, where its superior gelling properties are required. The high availability of skin as a raw material and its established use in various food products support its position as the largest segment in the market.
Food grade Gelatin Market Segmentation
By Source
Animal
Marine
By Application
Bakery and Confectionery
Meat Products
Dairy and Desserts
Beverages
Others
By Type
Skin Gelatin
Bone Gelatin
Halal Gelatin
Countries Analyzed
North America (US, Canada, Mexico)
Europe (Germany, UK, France, Spain, Italy, Russia, Rest of Europe)
Asia Pacific (China, India, Japan, South Korea, Australia, South East Asia, Rest of Asia)
South America (Brazil, Argentina, Rest of South America)
Middle East and Africa (Saudi Arabia, UAE, Rest of Middle East, South Africa, Egypt, Rest of Africa)
Food grade Gelatin Companies Profiled in the Study
Baotou Dongbao Bio-Tech Co., Ltd.
Ewald-Gelatine GmbH
GELITA AG
India Gelatine & Chemicals Ltd.
Italgelatine S.p.A.
Jellice Co., Ltd.
Junca Gelatines, S.L.
Lapi Gelatine S.p.A.
Narmada Gelatines Limited
Nitta Gelatin Inc.
PB Leiner
Qinghai Gelatin Co., Ltd.
Qunli Gelatin Chemical Co., Ltd.
Rousselot B.V.
Sam Mi Industrial Co., Ltd.
Sterling Biotech Limited
Trobas Gelatine B.V.
Weishardt Group
Yasin Gelatin Co., Ltd.
*- List Not Exhaustive
Chapter 1. TABLE OF CONTENTS
Chapter 2. Introduction to Food grade Gelatin Market
2.1. Market Overview
2.2. Key Statistics and Report Highlights
2.3. Scope of the Comprehensive Study
2.3.1. Market Definition
2.3.2 Countries and Regions Covered
2.3.3 Research Objective
2.3.4 Units, Currency, and Conversions
2.3.5 Industry Value Chain
2.4. Key Market Segments
2.5. Key Companies
2.6. Study Period
Chapter 3. Strategic Analysis Review
3.1. Food grade Gelatin Pricing Analysis and Forecast
3.2. Porter’s Five Forces
3.3. Market Ecosystem
3.4. SWOT Analysis
3.5. Regulatory Scenario
3.3. Effects of Inflation, Russia-Ukraine War, moderating economic growth, and other macroeconomic factors
Chapter 4. Competitive Landscape
4.1. Market Share Analysis
4.1.1. Global Food grade Gelatin Market Share by Company, 2023
4.1.2. Product Offerings of Leading Food grade Gelatin Companies
4.2. Market Entropy
4.2.1. New Product Launches in the Industry
4.2.2. Mergers, Acquisitions, Joint ventures, and Partnerships
4.3. Key Strategies and Best Practices
Chapter 5. Global Market Projections: Best, Reference, and Low Case Scenarios
5.1. Growth Analysis- Case Scenario Definitions
5.2. Low Growth Case Scenario Forecasts
5.3. Reference Growth Case Scenario Forecasts
5.4. High Growth Case Scenario Forecasts
Chapter 6. Market Dynamics
6.1. Food grade Gelatin Market Drivers
6.2. Food grade Gelatin Market Challenges
6.6. Food grade Gelatin Market Opportunities
6.4. Food grade Gelatin Market Trends
Chapter 7. Global Food grade Gelatin Market Outlook Trends
7.1. Global Food grade Gelatin Revenue (USD Million) and CAGR (%) by Type (2021-2032)
7.2. Global Food grade Gelatin Revenue (USD Million) and CAGR (%) by Application (2021-2032)
7.3. Global Food grade Gelatin Revenue (USD Million) and CAGR (%) by Product (2021-2032)
By Source
Animal
Marine
By Application
Bakery and Confectionery
Meat Products
Dairy and Desserts
Beverages
Others
By Type
Skin Gelatin
Bone Gelatin
Halal Gelatin
Chapter 8. Global Food grade Gelatin Regional Analysis and Outlook
8.1. Global Food grade Gelatin Revenue (USD Million) By Regions (2021- 2032)
8.2. North America Food grade Gelatin Revenue (USD Million) by Country (2021-2032)
8.2.1. United States Food grade Gelatin Regional Analysis and Outlook
8.2.2. Canada Food grade Gelatin Regional Analysis and Outlook
8.2.3. Mexico Food grade Gelatin Regional Analysis and Outlook
8.3. Europe Food grade Gelatin Revenue (USD Million), by Country (2021-2032)
8.3.1. Germany Food grade Gelatin Regional Analysis and Outlook
8.3.2. France Food grade Gelatin Regional Analysis and Outlook
8.3.3. United Kingdom Food grade Gelatin Regional Analysis and Outlook
8.3.4. Spain Food grade Gelatin Regional Analysis and Outlook
8.3.5. Italy Food grade Gelatin Regional Analysis and Outlook
8.3.6. Russia Food grade Gelatin Regional Analysis and Outlook
8.3.7. Rest of Europe Food grade Gelatin Regional Analysis and Outlook
8.4. Asia Pacific Food grade Gelatin Revenue (USD Million) by Country (2021-2032)
8.4.1. China Food grade Gelatin Regional Analysis and Outlook
8.4.2. Japan Food grade Gelatin Regional Analysis and Outlook
8.4.3. India Food grade Gelatin Regional Analysis and Outlook
8.4.4. South Korea Food grade Gelatin Regional Analysis and Outlook
8.4.5. Australia Food grade Gelatin Regional Analysis and Outlook
8.4.6. South East Asia Food grade Gelatin Regional Analysis and Outlook
8.4.7. Rest of Asia Pacific Food grade Gelatin Regional Analysis and Outlook
8.5. South America Food grade Gelatin Revenue (USD Million), by Country (2021-2032)
8.5.1. Brazil Food grade Gelatin Regional Analysis and Outlook
8.5.2. Argentina Food grade Gelatin Regional Analysis and Outlook
8.5.3. Rest of South America Food grade Gelatin Regional Analysis and Outlook
8.6. Middle East and Africa Food grade Gelatin Revenue (USD Million) by Country (2021-2032)
8.6.1. Middle East Food grade Gelatin Regional Analysis and Outlook
8.6.2. Africa Food grade Gelatin Regional Analysis and Outlook
Chapter 9. North America Food grade Gelatin Analysis and Outlook
9.1. North America Food grade Gelatin Revenue (USD Million) by Segments (2021-2032)
9.1.1. North America Food grade Gelatin Revenue (USD Million) by Type (2021-2032)
9.1.2. North America Food grade Gelatin Revenue (USD Million) by Application (2021-2032)
9.1.3. North America Food grade Gelatin Revenue (USD Million) by Product (2021-2032)
By Source
Animal
Marine
By Application
Bakery and Confectionery
Meat Products
Dairy and Desserts
Beverages
Others
By Type
Skin Gelatin
Bone Gelatin
Halal Gelatin
Chapter 10. Europe Food grade Gelatin Analysis and Outlook
10.1. Europe Food grade Gelatin Revenue (USD Million), by Segments (USD Million) (2021-2032)
10.1.1. Europe Food grade Gelatin Revenue (USD Million) by Type (2021-2032)
10.1.2. Europe Food grade Gelatin Revenue (USD Million) by Application (2021-2032)
10.1.3. Europe Food grade Gelatin Revenue (USD Million) by Product (2021-2032)
By Source
Animal
Marine
By Application
Bakery and Confectionery
Meat Products
Dairy and Desserts
Beverages
Others
By Type
Skin Gelatin
Bone Gelatin
Halal Gelatin
Chapter 11. Asia Pacific Food grade Gelatin Analysis and Outlook
11.1. Asia Pacific Food grade Gelatin Revenue (USD Million), and Revenue (USD Million) by Segments (2021-2032)
11.1.1. Asia Pacific Food grade Gelatin Revenue (USD Million) by Type (2021-2032)
11.1.2. Asia Pacific Food grade Gelatin Revenue (USD Million) by Application (2021-2032)
11.1.3. Asia Pacific Food grade Gelatin Revenue (USD Million) by Product (2021-2032)
By Source
Animal
Marine
By Application
Bakery and Confectionery
Meat Products
Dairy and Desserts
Beverages
Others
By Type
Skin Gelatin
Bone Gelatin
Halal Gelatin
Chapter 12. South America Food grade Gelatin Analysis and Outlook
12.1. South America Food grade Gelatin Revenue (USD Million), by Segments (2021-2032)
12.1.1. South America Food grade Gelatin Revenue (USD Million) by Type (2021-2032)
12.1.2. South America Food grade Gelatin Revenue (USD Million) by Application (2021-2032)
12.1.3. South America Food grade Gelatin Revenue (USD Million) by Product (2021-2032)
By Source
Animal
Marine
By Application
Bakery and Confectionery
Meat Products
Dairy and Desserts
Beverages
Others
By Type
Skin Gelatin
Bone Gelatin
Halal Gelatin
Chapter 13. Middle East and Africa Food grade Gelatin Analysis and Outlook
13.1. Middle East and Africa Food grade Gelatin Revenue (USD Million), by Segments (2021-2032)
13.1.1. Middle East and Africa Food grade Gelatin Revenue (USD Million) by Type (2021-2032)
13.1.2. Middle East and Africa Food grade Gelatin Revenue (USD Million) by Application (2021-2032)
13.1.3. Middle East and Africa Food grade Gelatin Revenue (USD Million) by Product (2021-2032)
By Source
Animal
Marine
By Application
Bakery and Confectionery
Meat Products
Dairy and Desserts
Beverages
Others
By Type
Skin Gelatin
Bone Gelatin
Halal Gelatin
Chapter 14. Food grade Gelatin Company Profiles
14.1 Business Overview
14.2 Product Profiles
14.3 SWOT Profiles
14.5 Recent Developments
14.6 Financial Profile
List of Companies
Baotou Dongbao Bio-Tech Co., Ltd.
Ewald-Gelatine GmbH
GELITA AG
India Gelatine & Chemicals Ltd.
Italgelatine S.p.A.
Jellice Co., Ltd.
Junca Gelatines, S.L.
Lapi Gelatine S.p.A.
Narmada Gelatines Limited
Nitta Gelatin Inc.
PB Leiner
Qinghai Gelatin Co., Ltd.
Qunli Gelatin Chemical Co., Ltd.
Rousselot B.V.
Sam Mi Industrial Co., Ltd.
Sterling Biotech Limited
Trobas Gelatine B.V.
Weishardt Group
Yasin Gelatin Co., Ltd.
15. Methodology and Data Sources
15.1 Customization Offerings
15.2 Subscription Services
15.3 Related Reports
15.4 Publisher Expertise
LIST OF TABLES
Table 1 Market Segmentation Analysis
Table 2 Global Food grade Gelatin Market Share of Leading Companies, 2023
Table 3 Product Offerings of Leading Companies
Table 4 Low Growth Scenario Forecasts
Table 5 Reference Case Growth Scenario
Table 6 High Growth Case Scenario
Table 7 Global Food grade Gelatin Revenue (USD Million) And CAGR (%) By Type (2021-2032)
Table 8 Global Food grade Gelatin Revenue (USD Million) And CAGR (%) By Application (2021-2032)
Table 9 Global Food grade Gelatin Revenue (USD Million) And CAGR (%) By Product (2021-2032)
Table 10 Global Food grade Gelatin Market Revenue (USD Million) By Regions (2021-2032)
Table 11 Global Food grade Gelatin Market Share (%) By Regions (2021-2032)
Table 12 North America Food grade Gelatin Revenue (USD Million) By Country (2021-2032)
Table 13 Europe Food grade Gelatin Revenue (USD Million) By Country (2021-2032)
Table 14 Asia Pacific Food grade Gelatin Revenue (USD Million) By Country (2021-2032)
Table 15 South America Food grade Gelatin Revenue (USD Million) By Country (2021-2032)
Table 16 Middle East and Africa Food grade Gelatin Revenue (USD Million) By Region (2021-2032)
Table 17 North America Food grade Gelatin Revenue (USD Million) By Type (2021-2032)
Table 18 North America Food grade Gelatin Revenue (USD Million) By Application (2021-2032)
Table 19 North America Food grade Gelatin Revenue (USD Million) By Product (2021-2032)
Table 20 Europe Food grade Gelatin Revenue (USD Million) By Type (2021-2032)
Table 21 Europe Food grade Gelatin Revenue (USD Million) By Application (2021-2032)
Table 22 Europe Food grade Gelatin Revenue (USD Million) By Product (2021-2032)
Table 23 Asia Pacific Food grade Gelatin Revenue (USD Million) By Type (2021-2032)
Table 24 Asia Pacific Food grade Gelatin Revenue (USD Million) By Application (2021-2032)
Table 25 Asia Pacific Food grade Gelatin Revenue (USD Million) By Product (2021-2032)
Table 26 South America Food grade Gelatin Revenue (USD Million) By Type (2021-2032)
Table 27 South America Food grade Gelatin Revenue (USD Million) By Application (2021-2032)
Table 28 South America Food grade Gelatin Revenue (USD Million) By Product (2021-2032)
Table 29 Middle East and Africa Food grade Gelatin Revenue (USD Million) By Type (2021-2032)
Table 30 Middle East and Africa Food grade Gelatin Revenue (USD Million) By Application (2021-2032)
Table 31 Middle East and Africa Food grade Gelatin Revenue (USD Million) By Product (2021-2032)
LIST OF FIGURES
Figure 1. Market Scope
Figure 2. Pricing Forecasts Per Unit, 2023- 2032
Figure 3. Porter’s Five Forces
Figure 4. Global Food grade Gelatin Market Revenue (USD Million) By Regions (2021-2032)
Figure 5. Global Food grade Gelatin Market Share (%) By Regions (2023)
Figure 6. North America Food grade Gelatin Revenue (USD Million) By Country (2021-2032)
Figure 7. United States Food grade Gelatin Revenue (USD Million) By Country (2021-2032)
Figure 8. Canada Food grade Gelatin Revenue (USD Million) By Country (2021-2032)
Figure 9. Mexico Food grade Gelatin Revenue (USD Million) By Country (2021-2032)
Figure 10. Europe Food grade Gelatin Revenue (USD Million) By Country (2021-2032)
Figure 11. Germany Food grade Gelatin Revenue (USD Million) By Country (2021-2032)
Figure 12. France Food grade Gelatin Revenue (USD Million) By Country (2021-2032)
Figure 13. United Kingdom Food grade Gelatin Revenue (USD Million) By Country (2021-2032)
Figure 14. Spain Food grade Gelatin Revenue (USD Million) By Country (2021-2032)
Figure 15. Italy Food grade Gelatin Revenue (USD Million) By Country (2021-2032)
Figure 16. Russia Food grade Gelatin Revenue (USD Million) By Country (2021-2032)
Figure 17. Rest of Europe Food grade Gelatin Revenue (USD Million) By Country (2021-2032)
Figure 11. Asia Pacific Food grade Gelatin Revenue (USD Million) By Country (2021-2032)
Figure 12. China Food grade Gelatin Revenue (USD Million) By Country (2021-2032)
Figure 13. Japan Food grade Gelatin Revenue (USD Million) By Country (2021-2032)
Figure 14. India Food grade Gelatin Revenue (USD Million) By Country (2021-2032)
Figure 15. South Korea Food grade Gelatin Revenue (USD Million) By Country (2021-2032)
Figure 16. Australia Food grade Gelatin Revenue (USD Million) By Country (2021-2032)
Figure 17. South East Asia Food grade Gelatin Revenue (USD Million) By Country (2021-2032)
Figure 18. South America Food grade Gelatin Revenue (USD Million) By Country (2021-2032)
Figure 19. Brazil Food grade Gelatin Revenue (USD Million) By Country (2021-2032)
Figure 20. Argentina Food grade Gelatin Revenue (USD Million) By Country (2021-2032)
Figure 21. Rest of Asia Pacific Food grade Gelatin Revenue (USD Million) By Country (2021-2032)
Figure 22. Middle East and Africa Food grade Gelatin Revenue (USD Million) By Region (2021-2032)
Figure 23. Saudi Arabia Food grade Gelatin Revenue (USD Million) By Region (2021-2032)
Figure 24. The UAE Food grade Gelatin Revenue (USD Million) By Region (2021-2032)
Figure 25. Rest of Middle East Food grade Gelatin Revenue (USD Million) By Region (2021-2032)
Figure 26. South Africa Food grade Gelatin Revenue (USD Million) By Region (2021-2032)
Figure 27. Africa Food grade Gelatin Revenue (USD Million) By Region (2021-2032)
Figure 28. North America Food grade Gelatin Revenue (USD Million) By Type (2021-2032)
Figure 29. North America Food grade Gelatin Revenue (USD Million) By Application (2021-2032)
Figure 30. North America Food grade Gelatin Revenue (USD Million) By Product (2021-2032)
Figure 31. Europe Food grade Gelatin Revenue (USD Million) By Type (2021-2032)
Figure 32. Europe Food grade Gelatin Revenue (USD Million) By Application (2021-2032)
Figure 33. Europe Food grade Gelatin Revenue (USD Million) By Product (2021-2032)
Figure 34. Asia Pacific Food grade Gelatin Revenue (USD Million) By Type (2021-2032)
Figure 35. Asia Pacific Food grade Gelatin Revenue (USD Million) By Application (2021-2032)
Figure 36. Asia Pacific Food grade Gelatin Revenue (USD Million) By Product (2021-2032)
Figure 37. South America Food grade Gelatin Revenue (USD Million) By Type (2021-2032)
Figure 38. South America Food grade Gelatin Revenue (USD Million) By Application (2021-2032)
Figure 39. South America Food grade Gelatin Revenue (USD Million) By Product (2021-2032)
Figure 40. Middle East and Africa Food grade Gelatin Revenue (USD Million) By Type (2021-2032)
Figure 41. Middle East and Africa Food grade Gelatin Revenue (USD Million) By Application (2021-2032)
Figure 42. Middle East and Africa Food grade Gelatin Revenue (USD Million) By Product (2021-2032)
By Source
Animal
Marine
By Application
Bakery and Confectionery
Meat Products
Dairy and Desserts
Beverages
Others
By Type
Skin Gelatin
Bone Gelatin
Halal Gelatin
Countries Analyzed
North America (US, Canada, Mexico)
Europe (Germany, UK, France, Spain, Italy, Russia, Rest of Europe)
Asia Pacific (China, India, Japan, South Korea, Australia, South East Asia, Rest of Asia)
South America (Brazil, Argentina, Rest of South America)
Middle East and Africa (Saudi Arabia, UAE, Rest of Middle East, South Africa, Egypt, Rest of Africa)
