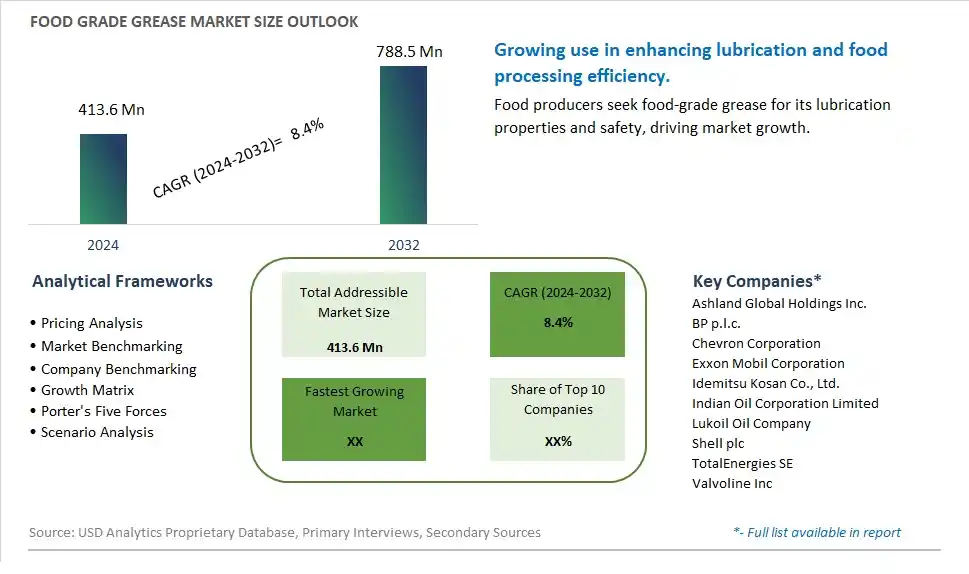
Global Food Grade Grease Market Size is valued at $413.6 Million in 2024 and is forecast to register a growth rate (CAGR) of 8.4% to reach $788.5 Million by 2032.
The global Food Grade Grease Market Comprehensive Study analyzes and forecasts the market size across 6 regions and 24 countries for diverse segments -By Type (H1 Lubricants, H2 Lubricants, 3H (Releasing Agents), H3 (Soluble Oils), Others), By Application (Food, Beverages, Pharmaceuticals & Cosmetics, Others)
An Introduction to Food Grade Grease Market
The Food Grade Grease market in 2024 is experiencing significant growth, driven by the increasing demand for lubricants that ensure food safety and machinery performance in food processing. Food-grade grease, formulated to meet stringent safety standards, is used in equipment maintenance to prevent contamination. The market benefits from advancements in lubricant formulation and application technologies, the growing trend of automation in food processing, and the expansion of the global food manufacturing sector. Additionally, the rising focus on food safety and regulatory compliance is contributing to market growth.
Food Grade Grease Competitive Landscape
The market report analyses the leading companies in the industry including Ashland Global Holdings Inc., BP p.l.c., Chevron Corporation, Exxon Mobil Corporation, Idemitsu Kosan Co., Ltd., Indian Oil Corporation Limited, Lukoil Oil Company, Shell plc, TotalEnergies SE, Valvoline Inc, and Others.
Food Grade Grease Market Dynamics
Food Grade Grease Market Trend: Demand for Food Safety and Equipment Performance
One prominent trend in the food grade grease market is the increasing demand for food safety and equipment performance in the food processing industry. As food safety regulations become stricter, there is a growing emphasis on using food grade greases that meet stringent safety standards and ensure equipment reliability and performance. Food grade greases are specifically formulated to prevent contamination, resist high temperatures, and maintain lubrication integrity in food processing machinery, such as conveyors, mixers, ovens, and packaging equipment. This trend is driven by the need for food manufacturers to comply with regulatory requirements, maintain hygienic production environments, and prevent equipment failures that could compromise food quality and safety.
Food Grade Grease Market Driver: Regulatory Compliance and Industry Standards
A key driver propelling the food grade grease market is regulatory compliance and adherence to industry standards. Regulatory bodies and food safety agencies mandate the use of food grade lubricants and greases in food processing equipment to prevent food contamination and ensure product safety. Manufacturers and operators in the food industry are required to use lubricants that are NSF H1 certified and comply with FDA regulations for incidental food contact. The driver behind this trend is the need for reliable and approved lubrication solutions that meet regulatory requirements, mitigate contamination risks, and maintain equipment performance in food processing facilities, driving the demand for food grade greases among food manufacturers and equipment suppliers.
Food Grade Grease Market Opportunity: Development of Specialized Grease Formulations
A significant opportunity in the food grade grease market lies in the development of specialized grease formulations tailored to specific food processing applications and equipment requirements. Companies can capitalize on this opportunity by formulating greases with enhanced properties such as high temperature resistance, water resistance, corrosion protection, and compatibility with different materials commonly found in food processing machinery. Additionally, there's potential for offering biodegradable and environmentally friendly grease options that align with sustainable practices and support green initiatives in the food industry. By focusing on innovation and offering specialized grease formulations, companies can address diverse customer needs, penetrate niche market segments, and strengthen their position in the food grade grease market.
Food Grade Grease Market Share Analysis: H1 Lubricants segment generated the highest revenue share in the industry
Among the types listed, H1 Lubricants emerge as the largest segment in the Food Grade Grease market. H1 Lubricants are specifically formulated for incidental food contact applications, where there is a possibility of lubricant contact with food products during processing. These lubricants are designed to meet stringent regulatory requirements and safety standards, ensuring they do not pose any health risks when in contact with food. H1 Lubricants find extensive use in food processing equipment such as mixers, conveyors, and packaging machines, where maintaining hygiene and preventing contamination are critical priorities. The demand for H1 Lubricants is driven by strict food safety regulations and industry standards that mandate the use of food-grade lubricants to prevent potential foodborne hazards. As food processing operations expand globally and regulatory scrutiny intensifies, the adoption of H1 Lubricants is expected to continue growing. Manufacturers are increasingly investing in research and development to enhance the performance, sustainability, and compatibility of H1 Lubricants with various food processing applications, thereby reinforcing their dominance in the Food Grade Grease market.
Food Grade Grease Market Share Analysis: Pharmaceuticals & Cosmetics is the fastest growing segment over the forecast period to 2032
The Pharmaceuticals & Cosmetics segment is anticipated to be the fastest-growing application segment in the Food Grade Grease market through 2032. This growth is driven by increasing demand for specialized greases that meet stringent regulatory requirements for use in pharmaceutical manufacturing and cosmetic production. Food Grade Greases used in pharmaceutical applications must adhere to strict guidelines to ensure product purity and safety, particularly in formulations where incidental contact with drugs or active ingredients can occur. Similarly, in the cosmetics industry, greases play a crucial role in the production of skincare products, makeup, and personal care items, where they provide lubrication, emolliency, and stability to formulations. As consumer awareness grows regarding the importance of ingredient safety and regulatory compliance in pharmaceuticals and cosmetics, the demand for Food Grade Greases tailored for these sectors is expected to rise. Manufacturers are focusing on developing greases that not only meet the technical requirements of pharmaceutical and cosmetic applications but also align with sustainability and ethical sourcing practices. Thus, the Pharmaceuticals & Cosmetics segment presents significant growth opportunities in the Food Grade Grease market, driven by its critical role in ensuring product integrity and compliance with stringent industry standards.
Food Grade Grease Market Segmentation
By Type
H1 Lubricants
H2 Lubricants
3H (Releasing Agents)
H3 (Soluble Oils)
Others
By Application
Food
Beverages
Pharmaceuticals & Cosmetics
Others
Countries Analyzed
North America (US, Canada, Mexico)
Europe (Germany, UK, France, Spain, Italy, Russia, Rest of Europe)
Asia Pacific (China, India, Japan, South Korea, Australia, South East Asia, Rest of Asia)
South America (Brazil, Argentina, Rest of South America)
Middle East and Africa (Saudi Arabia, UAE, Rest of Middle East, South Africa, Egypt, Rest of Africa)
Food Grade Grease Companies Profiled in the Study
Ashland Global Holdings Inc.
BP p.l.c.
Chevron Corporation
Exxon Mobil Corporation
Idemitsu Kosan Co., Ltd.
Indian Oil Corporation Limited
Lukoil Oil Company
Shell plc
TotalEnergies SE
Valvoline Inc
*- List Not Exhaustive
Chapter 1. TABLE OF CONTENTS
Chapter 2. Introduction to Food Grade Grease Market
2.1. Market Overview
2.2. Key Statistics and Report Highlights
2.3. Scope of the Comprehensive Study
2.3.1. Market Definition
2.3.2 Countries and Regions Covered
2.3.3 Research Objective
2.3.4 Units, Currency, and Conversions
2.3.5 Industry Value Chain
2.4. Key Market Segments
2.5. Key Companies
2.6. Study Period
Chapter 3. Strategic Analysis Review
3.1. Food Grade Grease Pricing Analysis and Forecast
3.2. Porter’s Five Forces
3.3. Market Ecosystem
3.4. SWOT Analysis
3.5. Regulatory Scenario
3.3. Effects of Inflation, Russia-Ukraine War, moderating economic growth, and other macroeconomic factors
Chapter 4. Competitive Landscape
4.1. Market Share Analysis
4.1.1. Global Food Grade Grease Market Share by Company, 2023
4.1.2. Product Offerings of Leading Food Grade Grease Companies
4.2. Market Entropy
4.2.1. New Product Launches in the Industry
4.2.2. Mergers, Acquisitions, Joint ventures, and Partnerships
4.3. Key Strategies and Best Practices
Chapter 5. Global Market Projections: Best, Reference, and Low Case Scenarios
5.1. Growth Analysis- Case Scenario Definitions
5.2. Low Growth Case Scenario Forecasts
5.3. Reference Growth Case Scenario Forecasts
5.4. High Growth Case Scenario Forecasts
Chapter 6. Market Dynamics
6.1. Food Grade Grease Market Drivers
6.2. Food Grade Grease Market Challenges
6.6. Food Grade Grease Market Opportunities
6.4. Food Grade Grease Market Trends
Chapter 7. Global Food Grade Grease Market Outlook Trends
7.1. Global Food Grade Grease Revenue (USD Million) and CAGR (%) by Type (2021-2032)
7.2. Global Food Grade Grease Revenue (USD Million) and CAGR (%) by Application (2021-2032)
7.3. Global Food Grade Grease Revenue (USD Million) and CAGR (%) by Product (2021-2032)
By Type
H1 Lubricants
H2 Lubricants
3H (Releasing Agents)
H3 (Soluble Oils)
Others
By Application
Food
Beverages
Pharmaceuticals & Cosmetics
Others
Chapter 8. Global Food Grade Grease Regional Analysis and Outlook
8.1. Global Food Grade Grease Revenue (USD Million) By Regions (2021- 2032)
8.2. North America Food Grade Grease Revenue (USD Million) by Country (2021-2032)
8.2.1. United States Food Grade Grease Regional Analysis and Outlook
8.2.2. Canada Food Grade Grease Regional Analysis and Outlook
8.2.3. Mexico Food Grade Grease Regional Analysis and Outlook
8.3. Europe Food Grade Grease Revenue (USD Million), by Country (2021-2032)
8.3.1. Germany Food Grade Grease Regional Analysis and Outlook
8.3.2. France Food Grade Grease Regional Analysis and Outlook
8.3.3. United Kingdom Food Grade Grease Regional Analysis and Outlook
8.3.4. Spain Food Grade Grease Regional Analysis and Outlook
8.3.5. Italy Food Grade Grease Regional Analysis and Outlook
8.3.6. Russia Food Grade Grease Regional Analysis and Outlook
8.3.7. Rest of Europe Food Grade Grease Regional Analysis and Outlook
8.4. Asia Pacific Food Grade Grease Revenue (USD Million) by Country (2021-2032)
8.4.1. China Food Grade Grease Regional Analysis and Outlook
8.4.2. Japan Food Grade Grease Regional Analysis and Outlook
8.4.3. India Food Grade Grease Regional Analysis and Outlook
8.4.4. South Korea Food Grade Grease Regional Analysis and Outlook
8.4.5. Australia Food Grade Grease Regional Analysis and Outlook
8.4.6. South East Asia Food Grade Grease Regional Analysis and Outlook
8.4.7. Rest of Asia Pacific Food Grade Grease Regional Analysis and Outlook
8.5. South America Food Grade Grease Revenue (USD Million), by Country (2021-2032)
8.5.1. Brazil Food Grade Grease Regional Analysis and Outlook
8.5.2. Argentina Food Grade Grease Regional Analysis and Outlook
8.5.3. Rest of South America Food Grade Grease Regional Analysis and Outlook
8.6. Middle East and Africa Food Grade Grease Revenue (USD Million) by Country (2021-2032)
8.6.1. Middle East Food Grade Grease Regional Analysis and Outlook
8.6.2. Africa Food Grade Grease Regional Analysis and Outlook
Chapter 9. North America Food Grade Grease Analysis and Outlook
9.1. North America Food Grade Grease Revenue (USD Million) by Segments (2021-2032)
9.1.1. North America Food Grade Grease Revenue (USD Million) by Type (2021-2032)
9.1.2. North America Food Grade Grease Revenue (USD Million) by Application (2021-2032)
9.1.3. North America Food Grade Grease Revenue (USD Million) by Product (2021-2032)
By Type
H1 Lubricants
H2 Lubricants
3H (Releasing Agents)
H3 (Soluble Oils)
Others
By Application
Food
Beverages
Pharmaceuticals & Cosmetics
Others
Chapter 10. Europe Food Grade Grease Analysis and Outlook
10.1. Europe Food Grade Grease Revenue (USD Million), by Segments (USD Million) (2021-2032)
10.1.1. Europe Food Grade Grease Revenue (USD Million) by Type (2021-2032)
10.1.2. Europe Food Grade Grease Revenue (USD Million) by Application (2021-2032)
10.1.3. Europe Food Grade Grease Revenue (USD Million) by Product (2021-2032)
By Type
H1 Lubricants
H2 Lubricants
3H (Releasing Agents)
H3 (Soluble Oils)
Others
By Application
Food
Beverages
Pharmaceuticals & Cosmetics
Others
Chapter 11. Asia Pacific Food Grade Grease Analysis and Outlook
11.1. Asia Pacific Food Grade Grease Revenue (USD Million), and Revenue (USD Million) by Segments (2021-2032)
11.1.1. Asia Pacific Food Grade Grease Revenue (USD Million) by Type (2021-2032)
11.1.2. Asia Pacific Food Grade Grease Revenue (USD Million) by Application (2021-2032)
11.1.3. Asia Pacific Food Grade Grease Revenue (USD Million) by Product (2021-2032)
By Type
H1 Lubricants
H2 Lubricants
3H (Releasing Agents)
H3 (Soluble Oils)
Others
By Application
Food
Beverages
Pharmaceuticals & Cosmetics
Others
Chapter 12. South America Food Grade Grease Analysis and Outlook
12.1. South America Food Grade Grease Revenue (USD Million), by Segments (2021-2032)
12.1.1. South America Food Grade Grease Revenue (USD Million) by Type (2021-2032)
12.1.2. South America Food Grade Grease Revenue (USD Million) by Application (2021-2032)
12.1.3. South America Food Grade Grease Revenue (USD Million) by Product (2021-2032)
By Type
H1 Lubricants
H2 Lubricants
3H (Releasing Agents)
H3 (Soluble Oils)
Others
By Application
Food
Beverages
Pharmaceuticals & Cosmetics
Others
Chapter 13. Middle East and Africa Food Grade Grease Analysis and Outlook
13.1. Middle East and Africa Food Grade Grease Revenue (USD Million), by Segments (2021-2032)
13.1.1. Middle East and Africa Food Grade Grease Revenue (USD Million) by Type (2021-2032)
13.1.2. Middle East and Africa Food Grade Grease Revenue (USD Million) by Application (2021-2032)
13.1.3. Middle East and Africa Food Grade Grease Revenue (USD Million) by Product (2021-2032)
By Type
H1 Lubricants
H2 Lubricants
3H (Releasing Agents)
H3 (Soluble Oils)
Others
By Application
Food
Beverages
Pharmaceuticals & Cosmetics
Others
Chapter 14. Food Grade Grease Company Profiles
14.1 Business Overview
14.2 Product Profiles
14.3 SWOT Profiles
14.5 Recent Developments
14.6 Financial Profile
List of Companies
Ashland Global Holdings Inc.
BP p.l.c.
Chevron Corporation
Exxon Mobil Corporation
Idemitsu Kosan Co., Ltd.
Indian Oil Corporation Limited
Lukoil Oil Company
Shell plc
TotalEnergies SE
Valvoline Inc
15. Methodology and Data Sources
15.1 Customization Offerings
15.2 Subscription Services
15.3 Related Reports
15.4 Publisher Expertise
LIST OF TABLES
Table 1 Market Segmentation Analysis
Table 2 Global Food Grade Grease Market Share of Leading Companies, 2023
Table 3 Product Offerings of Leading Companies
Table 4 Low Growth Scenario Forecasts
Table 5 Reference Case Growth Scenario
Table 6 High Growth Case Scenario
Table 7 Global Food Grade Grease Revenue (USD Million) And CAGR (%) By Type (2021-2032)
Table 8 Global Food Grade Grease Revenue (USD Million) And CAGR (%) By Application (2021-2032)
Table 9 Global Food Grade Grease Revenue (USD Million) And CAGR (%) By Product (2021-2032)
Table 10 Global Food Grade Grease Market Revenue (USD Million) By Regions (2021-2032)
Table 11 Global Food Grade Grease Market Share (%) By Regions (2021-2032)
Table 12 North America Food Grade Grease Revenue (USD Million) By Country (2021-2032)
Table 13 Europe Food Grade Grease Revenue (USD Million) By Country (2021-2032)
Table 14 Asia Pacific Food Grade Grease Revenue (USD Million) By Country (2021-2032)
Table 15 South America Food Grade Grease Revenue (USD Million) By Country (2021-2032)
Table 16 Middle East and Africa Food Grade Grease Revenue (USD Million) By Region (2021-2032)
Table 17 North America Food Grade Grease Revenue (USD Million) By Type (2021-2032)
Table 18 North America Food Grade Grease Revenue (USD Million) By Application (2021-2032)
Table 19 North America Food Grade Grease Revenue (USD Million) By Product (2021-2032)
Table 20 Europe Food Grade Grease Revenue (USD Million) By Type (2021-2032)
Table 21 Europe Food Grade Grease Revenue (USD Million) By Application (2021-2032)
Table 22 Europe Food Grade Grease Revenue (USD Million) By Product (2021-2032)
Table 23 Asia Pacific Food Grade Grease Revenue (USD Million) By Type (2021-2032)
Table 24 Asia Pacific Food Grade Grease Revenue (USD Million) By Application (2021-2032)
Table 25 Asia Pacific Food Grade Grease Revenue (USD Million) By Product (2021-2032)
Table 26 South America Food Grade Grease Revenue (USD Million) By Type (2021-2032)
Table 27 South America Food Grade Grease Revenue (USD Million) By Application (2021-2032)
Table 28 South America Food Grade Grease Revenue (USD Million) By Product (2021-2032)
Table 29 Middle East and Africa Food Grade Grease Revenue (USD Million) By Type (2021-2032)
Table 30 Middle East and Africa Food Grade Grease Revenue (USD Million) By Application (2021-2032)
Table 31 Middle East and Africa Food Grade Grease Revenue (USD Million) By Product (2021-2032)
LIST OF FIGURES
Figure 1. Market Scope
Figure 2. Pricing Forecasts Per Unit, 2023- 2032
Figure 3. Porter’s Five Forces
Figure 4. Global Food Grade Grease Market Revenue (USD Million) By Regions (2021-2032)
Figure 5. Global Food Grade Grease Market Share (%) By Regions (2023)
Figure 6. North America Food Grade Grease Revenue (USD Million) By Country (2021-2032)
Figure 7. United States Food Grade Grease Revenue (USD Million) By Country (2021-2032)
Figure 8. Canada Food Grade Grease Revenue (USD Million) By Country (2021-2032)
Figure 9. Mexico Food Grade Grease Revenue (USD Million) By Country (2021-2032)
Figure 10. Europe Food Grade Grease Revenue (USD Million) By Country (2021-2032)
Figure 11. Germany Food Grade Grease Revenue (USD Million) By Country (2021-2032)
Figure 12. France Food Grade Grease Revenue (USD Million) By Country (2021-2032)
Figure 13. United Kingdom Food Grade Grease Revenue (USD Million) By Country (2021-2032)
Figure 14. Spain Food Grade Grease Revenue (USD Million) By Country (2021-2032)
Figure 15. Italy Food Grade Grease Revenue (USD Million) By Country (2021-2032)
Figure 16. Russia Food Grade Grease Revenue (USD Million) By Country (2021-2032)
Figure 17. Rest of Europe Food Grade Grease Revenue (USD Million) By Country (2021-2032)
Figure 11. Asia Pacific Food Grade Grease Revenue (USD Million) By Country (2021-2032)
Figure 12. China Food Grade Grease Revenue (USD Million) By Country (2021-2032)
Figure 13. Japan Food Grade Grease Revenue (USD Million) By Country (2021-2032)
Figure 14. India Food Grade Grease Revenue (USD Million) By Country (2021-2032)
Figure 15. South Korea Food Grade Grease Revenue (USD Million) By Country (2021-2032)
Figure 16. Australia Food Grade Grease Revenue (USD Million) By Country (2021-2032)
Figure 17. South East Asia Food Grade Grease Revenue (USD Million) By Country (2021-2032)
Figure 18. South America Food Grade Grease Revenue (USD Million) By Country (2021-2032)
Figure 19. Brazil Food Grade Grease Revenue (USD Million) By Country (2021-2032)
Figure 20. Argentina Food Grade Grease Revenue (USD Million) By Country (2021-2032)
Figure 21. Rest of Asia Pacific Food Grade Grease Revenue (USD Million) By Country (2021-2032)
Figure 22. Middle East and Africa Food Grade Grease Revenue (USD Million) By Region (2021-2032)
Figure 23. Saudi Arabia Food Grade Grease Revenue (USD Million) By Region (2021-2032)
Figure 24. The UAE Food Grade Grease Revenue (USD Million) By Region (2021-2032)
Figure 25. Rest of Middle East Food Grade Grease Revenue (USD Million) By Region (2021-2032)
Figure 26. South Africa Food Grade Grease Revenue (USD Million) By Region (2021-2032)
Figure 27. Africa Food Grade Grease Revenue (USD Million) By Region (2021-2032)
Figure 28. North America Food Grade Grease Revenue (USD Million) By Type (2021-2032)
Figure 29. North America Food Grade Grease Revenue (USD Million) By Application (2021-2032)
Figure 30. North America Food Grade Grease Revenue (USD Million) By Product (2021-2032)
Figure 31. Europe Food Grade Grease Revenue (USD Million) By Type (2021-2032)
Figure 32. Europe Food Grade Grease Revenue (USD Million) By Application (2021-2032)
Figure 33. Europe Food Grade Grease Revenue (USD Million) By Product (2021-2032)
Figure 34. Asia Pacific Food Grade Grease Revenue (USD Million) By Type (2021-2032)
Figure 35. Asia Pacific Food Grade Grease Revenue (USD Million) By Application (2021-2032)
Figure 36. Asia Pacific Food Grade Grease Revenue (USD Million) By Product (2021-2032)
Figure 37. South America Food Grade Grease Revenue (USD Million) By Type (2021-2032)
Figure 38. South America Food Grade Grease Revenue (USD Million) By Application (2021-2032)
Figure 39. South America Food Grade Grease Revenue (USD Million) By Product (2021-2032)
Figure 40. Middle East and Africa Food Grade Grease Revenue (USD Million) By Type (2021-2032)
Figure 41. Middle East and Africa Food Grade Grease Revenue (USD Million) By Application (2021-2032)
Figure 42. Middle East and Africa Food Grade Grease Revenue (USD Million) By Product (2021-2032)
By Type
H1 Lubricants
H2 Lubricants
3H (Releasing Agents)
H3 (Soluble Oils)
Others
By Application
Food
Beverages
Pharmaceuticals & Cosmetics
Others
Countries Analyzed
North America (US, Canada, Mexico)
Europe (Germany, UK, France, Spain, Italy, Russia, Rest of Europe)
Asia Pacific (China, India, Japan, South Korea, Australia, South East Asia, Rest of Asia)
South America (Brazil, Argentina, Rest of South America)
Middle East and Africa (Saudi Arabia, UAE, Rest of Middle East, South Africa, Egypt, Rest of Africa)
