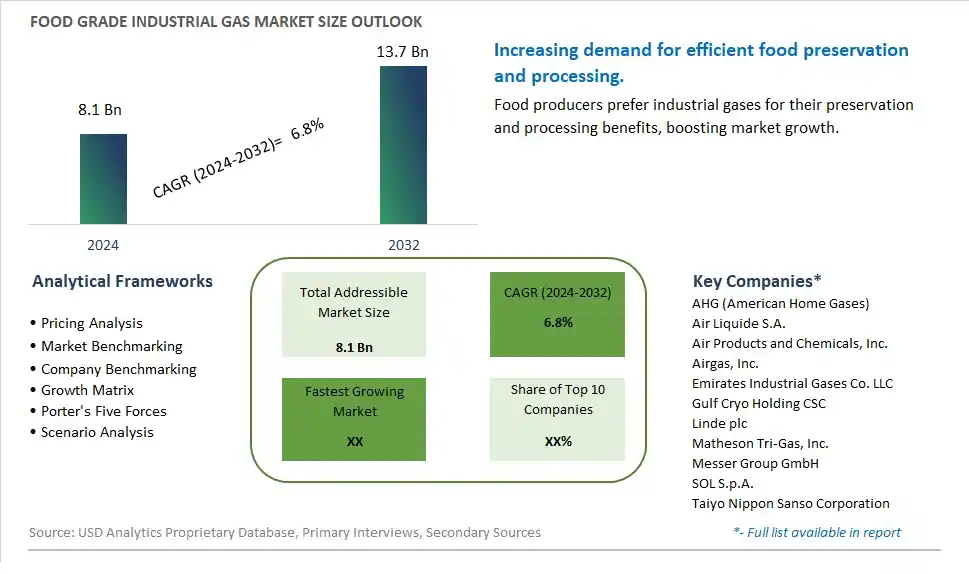
Global Food Grade Industrial Gas Market Size is valued at $8.1 Billion in 2024 and is forecast to register a growth rate (CAGR) of 6.8% to reach $13.7 Billion by 2032.
The global Food Grade Industrial Gas Market Comprehensive Study analyzes and forecasts the market size across 6 regions and 24 countries for diverse segments -By Type (Carbon Dioxide, Nitrogen, Oxygen), By Application (Freezing and Chilling, Packaging and Carbonation), By Product (Meat, Fish & Seafood, Dairy & Frozen Products, Beverages, Fruits & Vegetables, Convenience Foods, Bakery & Confectionery)
An Introduction to Food Grade Industrial Gas Market
In 2024, the Food Grade Industrial Gas market is witnessing robust growth, driven by the increasing demand for gases that enhance food processing and preservation. Food-grade industrial gases, including nitrogen, carbon dioxide, and oxygen, are used in packaging, freezing, and carbonation. The market benefits from advancements in gas production and application technologies, the growing trend of convenience and ready-to-eat foods, and the expansion of the global food and beverage sector. Additionally, the rising focus on food safety and quality assurance is contributing to market growth.
Food Grade Industrial Gas Competitive Landscape
The market report analyses the leading companies in the industry including AHG (American Home Gases), Air Liquide S.A., Air Products and Chemicals, Inc., Airgas, Inc., Emirates Industrial Gases Co. LLC, Gulf Cryo Holding CSC, Linde plc, Matheson Tri-Gas, Inc., Messer Group GmbH, SOL S.p.A., Taiyo Nippon Sanso Corporation, and Others.
Food Grade Industrial Gas Market Dynamics
Food Grade Industrial Gas Market Trend: Adoption of Cryogenic Technology in Food Processing
One prominent trend in the food grade industrial gas market is the increasing adoption of cryogenic technology in food processing. Cryogenic gases, such as nitrogen and carbon dioxide, are used in food-grade form to freeze, chill, and preserve food products during processing and storage. This trend is driven by the need for efficient and rapid cooling methods that maintain food quality, extend shelf life, and meet stringent food safety standards. Food manufacturers are leveraging cryogenic gases for quick freezing of seafood, meat, fruits, and vegetables, as well as for creating frozen desserts and specialty products with superior texture and taste.
Food Grade Industrial Gas Market Driver: Demand for Extended Shelf Life and Food Safety
A key driver propelling the food grade industrial gas market is the demand for extended shelf life and enhanced food safety in the food industry. Cryogenic gases play a vital role in preserving food freshness, inhibiting microbial growth, and reducing the risk of foodborne pathogens. With consumers prioritizing food safety and quality, food manufacturers are investing in cryogenic systems and gases to maintain product integrity, minimize food waste, and comply with regulatory requirements. The driver behind this trend is the emphasis on maintaining food safety throughout the supply chain, from processing to distribution, ensuring that food products reach consumers in optimal condition.
Food Grade Industrial Gas Market Opportunity: Expansion into Novel Food Processing Techniques
A significant opportunity in the food grade industrial gas market lies in the expansion into novel food processing techniques that leverage the unique properties of industrial gases. Companies can capitalize on this opportunity by developing innovative cryogenic solutions for food texturization, preservation, and ingredient modification. For example, using cryogenic gases to create foams, emulsions, and aerated products, as well as for controlled atmosphere packaging and modified atmosphere storage, can offer new avenues for product differentiation and culinary creativity. By exploring novel applications and partnering with food manufacturers to implement advanced cryogenic technologies, companies can unlock growth opportunities and drive innovation in the food processing industry.
Food Grade Industrial Gas Market Share Analysis: Nitrogen segment generated the highest revenue share in the industry
Among the types listed, Nitrogen emerges as the largest segment in the Food Grade Industrial Gas market. Nitrogen is widely used in various food processing and packaging applications due to its inert properties and ability to displace oxygen, thereby extending the shelf life of perishable food products. It is essential in modified atmosphere packaging (MAP) systems where controlled atmospheres help maintain product freshness and quality by reducing oxidative reactions and microbial growth. Nitrogen is also utilized in beverage production, such as in carbonated drinks and beer, to prevent oxidation and maintain product stability. The demand for food-grade nitrogen continues to grow as food safety regulations become more stringent, prompting manufacturers to adopt technologies that enhance food preservation and minimize contamination risks. Additionally, advancements in gas purification and delivery systems ensure the purity and reliability of nitrogen used in food applications, further supporting its dominance in the Food Grade Industrial Gas market. As the global food industry expands and consumer preferences shift towards fresher, safer, and longer-lasting food products, the Nitrogen segment is poised to maintain its leadership position, driven by its critical role in food preservation and packaging technologies.
Food Grade Industrial Gas Market Share Analysis: Packaging and Carbonation is the fastest growing segment over the forecast period to 2032
The Packaging and Carbonation segment is projected to be the fastest-growing application segment in the Food Grade Industrial Gas market through 2032. This growth is driven by increasing demand for enhanced food packaging solutions that ensure product safety, extend shelf life, and maintain quality. Food-grade industrial gases like carbon dioxide (CO2) are crucial in carbonation processes for beverages, where they impart desired fizziness and preserve flavor integrity. In packaging applications, gases such as nitrogen and CO2 are used in modified atmosphere packaging (MAP) systems to displace oxygen and create a controlled atmosphere that inhibits microbial growth and oxidative reactions, thereby extending the freshness of perishable foods. The rise of convenience foods and ready-to-eat meals further amplifies the need for effective packaging solutions that can maintain food quality from production to consumption. Technological advancements in gas handling and application methods continue to enhance the efficiency and sustainability of industrial gases in food packaging and carbonation processes. As food safety regulations become more stringent globally, the Packaging and Carbonation segment presents significant growth opportunities in the Food Grade Industrial Gas market, driven by its essential role in ensuring product quality and consumer satisfaction across various food and beverage sectors.
Food Grade Industrial Gas Market Share Analysis: Beverages segment generated the highest revenue share in the industry
Among the products listed, Beverages emerge as the largest segment in the Food Grade Industrial Gas market. Industrial gases such as carbon dioxide (CO2) play a pivotal role in the beverage industry, particularly in carbonation processes for soft drinks, beer, and sparkling water. CO2 is essential for imparting carbonation and desired effervescence to beverages, enhancing their taste, texture, and appeal to consumers. Additionally, nitrogen (N2) is used in the beverage industry for nitrogenating beer and creating smooth, creamy textures in nitrogen-infused coffee and cocktails. The demand for food-grade industrial gases in the beverage sector is driven by the growing popularity of carbonated beverages and specialty drinks, coupled with increasing consumer preference for refreshing and innovative beverage options. As beverage manufacturers continue to innovate and expand their product portfolios to cater to changing consumer tastes and preferences, the use of industrial gases in beverage production is expected to grow robustly. Technological advancements in gas delivery systems and sustainability initiatives further support the growth of the Beverages segment in the Food Grade Industrial Gas market, ensuring reliable supply chains and environmentally friendly practices. Thus, Beverages represent a dominant and expanding segment within the market, driven by their essential role in enhancing the quality and appeal of a wide range of beverages consumed globally.
Food Grade Industrial Gas Market Share Analysis: Packaging and Carbonation is the fastest growing segment over the forecast period to 2032
The Packaging and Carbonation segment is anticipated to be the fastest-growing application segment in the Food Grade Industrial Gas market through 2032. This growth is driven by increasing demand for advanced packaging solutions that enhance food safety, extend shelf life, and maintain product quality. Industrial gases like carbon dioxide (CO2) play a crucial role in carbonation processes for beverages, ensuring optimal fizziness and taste consistency. In packaging applications, gases such as nitrogen and CO2 are used in modified atmosphere packaging (MAP) systems to displace oxygen and create a controlled atmosphere that preserves the freshness of perishable foods. The adoption of MAP systems is rising across various food sectors, including meats, seafood, dairy products, fruits, and vegetables, driven by regulatory requirements and consumer preferences for minimally processed and longer-lasting foods. As food supply chains globalize and consumers demand fresher, safer, and more sustainable food options, the Packaging and Carbonation segment is poised for significant expansion. Technological advancements in gas handling and application techniques continue to enhance the efficiency and environmental sustainability of industrial gases, further driving their adoption in food packaging and carbonation processes. Therefore, the Packaging and Carbonation segment presents substantial growth opportunities in the Food Grade Industrial Gas market, supported by its critical role in ensuring food quality and safety throughout the supply chain.
Food Grade Industrial Gas Market Share Analysis: Beverages segment generated the highest revenue share in the industry
Among the products listed, Beverages stand out as the largest segment in the Food Grade Industrial Gas market. Industrial gases such as carbon dioxide (CO2) play a crucial role in the beverage industry, particularly in carbonation processes for soft drinks, beer, and sparkling water. CO2 is essential for creating the desired effervescence and refreshing taste in carbonated beverages, enhancing their appeal to consumers. Additionally, nitrogen (N2) is used in the beverage sector for nitrogenating beer and creating creamy textures in nitrogen-infused coffee and cocktails. The demand for food-grade industrial gases in the beverage industry continues to grow steadily due to increasing consumption of carbonated beverages and the rising popularity of specialty drinks. As beverage manufacturers innovate to meet evolving consumer preferences for healthier and more diverse beverage options, the use of industrial gases in beverage production is expected to expand further. This growth is supported by advancements in gas handling technology and sustainability initiatives aimed at reducing carbon footprints in beverage manufacturing processes. Therefore, Beverages represent a dominant and expanding segment within the Food Grade Industrial Gas market, driven by their essential role in enhancing the quality and sensory experience of a wide range of beverages consumed globally.
Food Grade Industrial Gas Market Segmentation
By Type
Carbon Dioxide
Nitrogen
Oxygen
By Application
Freezing and Chilling
Packaging and Carbonation
By Product
Meat
Fish & Seafood
Dairy & Frozen Products
Beverages
Fruits & Vegetables
Convenience Foods
Bakery & Confectionery
Countries Analyzed
North America (US, Canada, Mexico)
Europe (Germany, UK, France, Spain, Italy, Russia, Rest of Europe)
Asia Pacific (China, India, Japan, South Korea, Australia, South East Asia, Rest of Asia)
South America (Brazil, Argentina, Rest of South America)
Middle East and Africa (Saudi Arabia, UAE, Rest of Middle East, South Africa, Egypt, Rest of Africa)
Food Grade Industrial Gas Companies Profiled in the Study
AHG (American Home Gases)
Air Liquide S.A.
Air Products and Chemicals, Inc.
Airgas, Inc.
Emirates Industrial Gases Co. LLC
Gulf Cryo Holding CSC
Linde plc
Matheson Tri-Gas, Inc.
Messer Group GmbH
SOL S.p.A.
Taiyo Nippon Sanso Corporation
*- List Not Exhaustive
Chapter 1. TABLE OF CONTENTS
Chapter 2. Introduction to Food Grade Industrial Gas Market
2.1. Market Overview
2.2. Key Statistics and Report Highlights
2.3. Scope of the Comprehensive Study
2.3.1. Market Definition
2.3.2 Countries and Regions Covered
2.3.3 Research Objective
2.3.4 Units, Currency, and Conversions
2.3.5 Industry Value Chain
2.4. Key Market Segments
2.5. Key Companies
2.6. Study Period
Chapter 3. Strategic Analysis Review
3.1. Food Grade Industrial Gas Pricing Analysis and Forecast
3.2. Porter’s Five Forces
3.3. Market Ecosystem
3.4. SWOT Analysis
3.5. Regulatory Scenario
3.3. Effects of Inflation, Russia-Ukraine War, moderating economic growth, and other macroeconomic factors
Chapter 4. Competitive Landscape
4.1. Market Share Analysis
4.1.1. Global Food Grade Industrial Gas Market Share by Company, 2023
4.1.2. Product Offerings of Leading Food Grade Industrial Gas Companies
4.2. Market Entropy
4.2.1. New Product Launches in the Industry
4.2.2. Mergers, Acquisitions, Joint ventures, and Partnerships
4.3. Key Strategies and Best Practices
Chapter 5. Global Market Projections: Best, Reference, and Low Case Scenarios
5.1. Growth Analysis- Case Scenario Definitions
5.2. Low Growth Case Scenario Forecasts
5.3. Reference Growth Case Scenario Forecasts
5.4. High Growth Case Scenario Forecasts
Chapter 6. Market Dynamics
6.1. Food Grade Industrial Gas Market Drivers
6.2. Food Grade Industrial Gas Market Challenges
6.6. Food Grade Industrial Gas Market Opportunities
6.4. Food Grade Industrial Gas Market Trends
Chapter 7. Global Food Grade Industrial Gas Market Outlook Trends
7.1. Global Food Grade Industrial Gas Revenue (USD Million) and CAGR (%) by Type (2021-2032)
7.2. Global Food Grade Industrial Gas Revenue (USD Million) and CAGR (%) by Application (2021-2032)
7.3. Global Food Grade Industrial Gas Revenue (USD Million) and CAGR (%) by Product (2021-2032)
By Type
Carbon Dioxide
Nitrogen
Oxygen
By Application
Freezing and Chilling
Packaging and Carbonation
By Product
Meat
Fish & Seafood
Dairy & Frozen Products
Beverages
Fruits & Vegetables
Convenience Foods
Bakery & Confectionery
Chapter 8. Global Food Grade Industrial Gas Regional Analysis and Outlook
8.1. Global Food Grade Industrial Gas Revenue (USD Million) By Regions (2021- 2032)
8.2. North America Food Grade Industrial Gas Revenue (USD Million) by Country (2021-2032)
8.2.1. United States Food Grade Industrial Gas Regional Analysis and Outlook
8.2.2. Canada Food Grade Industrial Gas Regional Analysis and Outlook
8.2.3. Mexico Food Grade Industrial Gas Regional Analysis and Outlook
8.3. Europe Food Grade Industrial Gas Revenue (USD Million), by Country (2021-2032)
8.3.1. Germany Food Grade Industrial Gas Regional Analysis and Outlook
8.3.2. France Food Grade Industrial Gas Regional Analysis and Outlook
8.3.3. United Kingdom Food Grade Industrial Gas Regional Analysis and Outlook
8.3.4. Spain Food Grade Industrial Gas Regional Analysis and Outlook
8.3.5. Italy Food Grade Industrial Gas Regional Analysis and Outlook
8.3.6. Russia Food Grade Industrial Gas Regional Analysis and Outlook
8.3.7. Rest of Europe Food Grade Industrial Gas Regional Analysis and Outlook
8.4. Asia Pacific Food Grade Industrial Gas Revenue (USD Million) by Country (2021-2032)
8.4.1. China Food Grade Industrial Gas Regional Analysis and Outlook
8.4.2. Japan Food Grade Industrial Gas Regional Analysis and Outlook
8.4.3. India Food Grade Industrial Gas Regional Analysis and Outlook
8.4.4. South Korea Food Grade Industrial Gas Regional Analysis and Outlook
8.4.5. Australia Food Grade Industrial Gas Regional Analysis and Outlook
8.4.6. South East Asia Food Grade Industrial Gas Regional Analysis and Outlook
8.4.7. Rest of Asia Pacific Food Grade Industrial Gas Regional Analysis and Outlook
8.5. South America Food Grade Industrial Gas Revenue (USD Million), by Country (2021-2032)
8.5.1. Brazil Food Grade Industrial Gas Regional Analysis and Outlook
8.5.2. Argentina Food Grade Industrial Gas Regional Analysis and Outlook
8.5.3. Rest of South America Food Grade Industrial Gas Regional Analysis and Outlook
8.6. Middle East and Africa Food Grade Industrial Gas Revenue (USD Million) by Country (2021-2032)
8.6.1. Middle East Food Grade Industrial Gas Regional Analysis and Outlook
8.6.2. Africa Food Grade Industrial Gas Regional Analysis and Outlook
Chapter 9. North America Food Grade Industrial Gas Analysis and Outlook
9.1. North America Food Grade Industrial Gas Revenue (USD Million) by Segments (2021-2032)
9.1.1. North America Food Grade Industrial Gas Revenue (USD Million) by Type (2021-2032)
9.1.2. North America Food Grade Industrial Gas Revenue (USD Million) by Application (2021-2032)
9.1.3. North America Food Grade Industrial Gas Revenue (USD Million) by Product (2021-2032)
By Type
Carbon Dioxide
Nitrogen
Oxygen
By Application
Freezing and Chilling
Packaging and Carbonation
By Product
Meat
Fish & Seafood
Dairy & Frozen Products
Beverages
Fruits & Vegetables
Convenience Foods
Bakery & Confectionery
Chapter 10. Europe Food Grade Industrial Gas Analysis and Outlook
10.1. Europe Food Grade Industrial Gas Revenue (USD Million), by Segments (USD Million) (2021-2032)
10.1.1. Europe Food Grade Industrial Gas Revenue (USD Million) by Type (2021-2032)
10.1.2. Europe Food Grade Industrial Gas Revenue (USD Million) by Application (2021-2032)
10.1.3. Europe Food Grade Industrial Gas Revenue (USD Million) by Product (2021-2032)
By Type
Carbon Dioxide
Nitrogen
Oxygen
By Application
Freezing and Chilling
Packaging and Carbonation
By Product
Meat
Fish & Seafood
Dairy & Frozen Products
Beverages
Fruits & Vegetables
Convenience Foods
Bakery & Confectionery
Chapter 11. Asia Pacific Food Grade Industrial Gas Analysis and Outlook
11.1. Asia Pacific Food Grade Industrial Gas Revenue (USD Million), and Revenue (USD Million) by Segments (2021-2032)
11.1.1. Asia Pacific Food Grade Industrial Gas Revenue (USD Million) by Type (2021-2032)
11.1.2. Asia Pacific Food Grade Industrial Gas Revenue (USD Million) by Application (2021-2032)
11.1.3. Asia Pacific Food Grade Industrial Gas Revenue (USD Million) by Product (2021-2032)
By Type
Carbon Dioxide
Nitrogen
Oxygen
By Application
Freezing and Chilling
Packaging and Carbonation
By Product
Meat
Fish & Seafood
Dairy & Frozen Products
Beverages
Fruits & Vegetables
Convenience Foods
Bakery & Confectionery
Chapter 12. South America Food Grade Industrial Gas Analysis and Outlook
12.1. South America Food Grade Industrial Gas Revenue (USD Million), by Segments (2021-2032)
12.1.1. South America Food Grade Industrial Gas Revenue (USD Million) by Type (2021-2032)
12.1.2. South America Food Grade Industrial Gas Revenue (USD Million) by Application (2021-2032)
12.1.3. South America Food Grade Industrial Gas Revenue (USD Million) by Product (2021-2032)
By Type
Carbon Dioxide
Nitrogen
Oxygen
By Application
Freezing and Chilling
Packaging and Carbonation
By Product
Meat
Fish & Seafood
Dairy & Frozen Products
Beverages
Fruits & Vegetables
Convenience Foods
Bakery & Confectionery
Chapter 13. Middle East and Africa Food Grade Industrial Gas Analysis and Outlook
13.1. Middle East and Africa Food Grade Industrial Gas Revenue (USD Million), by Segments (2021-2032)
13.1.1. Middle East and Africa Food Grade Industrial Gas Revenue (USD Million) by Type (2021-2032)
13.1.2. Middle East and Africa Food Grade Industrial Gas Revenue (USD Million) by Application (2021-2032)
13.1.3. Middle East and Africa Food Grade Industrial Gas Revenue (USD Million) by Product (2021-2032)
By Type
Carbon Dioxide
Nitrogen
Oxygen
By Application
Freezing and Chilling
Packaging and Carbonation
By Product
Meat
Fish & Seafood
Dairy & Frozen Products
Beverages
Fruits & Vegetables
Convenience Foods
Bakery & Confectionery
Chapter 14. Food Grade Industrial Gas Company Profiles
14.1 Business Overview
14.2 Product Profiles
14.3 SWOT Profiles
14.5 Recent Developments
14.6 Financial Profile
List of Companies
AHG (American Home Gases)
Air Liquide S.A.
Air Products and Chemicals, Inc.
Airgas, Inc.
Emirates Industrial Gases Co. LLC
Gulf Cryo Holding CSC
Linde plc
Matheson Tri-Gas, Inc.
Messer Group GmbH
SOL S.p.A.
Taiyo Nippon Sanso Corporation
15. Methodology and Data Sources
15.1 Customization Offerings
15.2 Subscription Services
15.3 Related Reports
15.4 Publisher Expertise
LIST OF TABLES
Table 1 Market Segmentation Analysis
Table 2 Global Food Grade Industrial Gas Market Share of Leading Companies, 2023
Table 3 Product Offerings of Leading Companies
Table 4 Low Growth Scenario Forecasts
Table 5 Reference Case Growth Scenario
Table 6 High Growth Case Scenario
Table 7 Global Food Grade Industrial Gas Revenue (USD Million) And CAGR (%) By Type (2021-2032)
Table 8 Global Food Grade Industrial Gas Revenue (USD Million) And CAGR (%) By Application (2021-2032)
Table 9 Global Food Grade Industrial Gas Revenue (USD Million) And CAGR (%) By Product (2021-2032)
Table 10 Global Food Grade Industrial Gas Market Revenue (USD Million) By Regions (2021-2032)
Table 11 Global Food Grade Industrial Gas Market Share (%) By Regions (2021-2032)
Table 12 North America Food Grade Industrial Gas Revenue (USD Million) By Country (2021-2032)
Table 13 Europe Food Grade Industrial Gas Revenue (USD Million) By Country (2021-2032)
Table 14 Asia Pacific Food Grade Industrial Gas Revenue (USD Million) By Country (2021-2032)
Table 15 South America Food Grade Industrial Gas Revenue (USD Million) By Country (2021-2032)
Table 16 Middle East and Africa Food Grade Industrial Gas Revenue (USD Million) By Region (2021-2032)
Table 17 North America Food Grade Industrial Gas Revenue (USD Million) By Type (2021-2032)
Table 18 North America Food Grade Industrial Gas Revenue (USD Million) By Application (2021-2032)
Table 19 North America Food Grade Industrial Gas Revenue (USD Million) By Product (2021-2032)
Table 20 Europe Food Grade Industrial Gas Revenue (USD Million) By Type (2021-2032)
Table 21 Europe Food Grade Industrial Gas Revenue (USD Million) By Application (2021-2032)
Table 22 Europe Food Grade Industrial Gas Revenue (USD Million) By Product (2021-2032)
Table 23 Asia Pacific Food Grade Industrial Gas Revenue (USD Million) By Type (2021-2032)
Table 24 Asia Pacific Food Grade Industrial Gas Revenue (USD Million) By Application (2021-2032)
Table 25 Asia Pacific Food Grade Industrial Gas Revenue (USD Million) By Product (2021-2032)
Table 26 South America Food Grade Industrial Gas Revenue (USD Million) By Type (2021-2032)
Table 27 South America Food Grade Industrial Gas Revenue (USD Million) By Application (2021-2032)
Table 28 South America Food Grade Industrial Gas Revenue (USD Million) By Product (2021-2032)
Table 29 Middle East and Africa Food Grade Industrial Gas Revenue (USD Million) By Type (2021-2032)
Table 30 Middle East and Africa Food Grade Industrial Gas Revenue (USD Million) By Application (2021-2032)
Table 31 Middle East and Africa Food Grade Industrial Gas Revenue (USD Million) By Product (2021-2032)
LIST OF FIGURES
Figure 1. Market Scope
Figure 2. Pricing Forecasts Per Unit, 2023- 2032
Figure 3. Porter’s Five Forces
Figure 4. Global Food Grade Industrial Gas Market Revenue (USD Million) By Regions (2021-2032)
Figure 5. Global Food Grade Industrial Gas Market Share (%) By Regions (2023)
Figure 6. North America Food Grade Industrial Gas Revenue (USD Million) By Country (2021-2032)
Figure 7. United States Food Grade Industrial Gas Revenue (USD Million) By Country (2021-2032)
Figure 8. Canada Food Grade Industrial Gas Revenue (USD Million) By Country (2021-2032)
Figure 9. Mexico Food Grade Industrial Gas Revenue (USD Million) By Country (2021-2032)
Figure 10. Europe Food Grade Industrial Gas Revenue (USD Million) By Country (2021-2032)
Figure 11. Germany Food Grade Industrial Gas Revenue (USD Million) By Country (2021-2032)
Figure 12. France Food Grade Industrial Gas Revenue (USD Million) By Country (2021-2032)
Figure 13. United Kingdom Food Grade Industrial Gas Revenue (USD Million) By Country (2021-2032)
Figure 14. Spain Food Grade Industrial Gas Revenue (USD Million) By Country (2021-2032)
Figure 15. Italy Food Grade Industrial Gas Revenue (USD Million) By Country (2021-2032)
Figure 16. Russia Food Grade Industrial Gas Revenue (USD Million) By Country (2021-2032)
Figure 17. Rest of Europe Food Grade Industrial Gas Revenue (USD Million) By Country (2021-2032)
Figure 11. Asia Pacific Food Grade Industrial Gas Revenue (USD Million) By Country (2021-2032)
Figure 12. China Food Grade Industrial Gas Revenue (USD Million) By Country (2021-2032)
Figure 13. Japan Food Grade Industrial Gas Revenue (USD Million) By Country (2021-2032)
Figure 14. India Food Grade Industrial Gas Revenue (USD Million) By Country (2021-2032)
Figure 15. South Korea Food Grade Industrial Gas Revenue (USD Million) By Country (2021-2032)
Figure 16. Australia Food Grade Industrial Gas Revenue (USD Million) By Country (2021-2032)
Figure 17. South East Asia Food Grade Industrial Gas Revenue (USD Million) By Country (2021-2032)
Figure 18. South America Food Grade Industrial Gas Revenue (USD Million) By Country (2021-2032)
Figure 19. Brazil Food Grade Industrial Gas Revenue (USD Million) By Country (2021-2032)
Figure 20. Argentina Food Grade Industrial Gas Revenue (USD Million) By Country (2021-2032)
Figure 21. Rest of Asia Pacific Food Grade Industrial Gas Revenue (USD Million) By Country (2021-2032)
Figure 22. Middle East and Africa Food Grade Industrial Gas Revenue (USD Million) By Region (2021-2032)
Figure 23. Saudi Arabia Food Grade Industrial Gas Revenue (USD Million) By Region (2021-2032)
Figure 24. The UAE Food Grade Industrial Gas Revenue (USD Million) By Region (2021-2032)
Figure 25. Rest of Middle East Food Grade Industrial Gas Revenue (USD Million) By Region (2021-2032)
Figure 26. South Africa Food Grade Industrial Gas Revenue (USD Million) By Region (2021-2032)
Figure 27. Africa Food Grade Industrial Gas Revenue (USD Million) By Region (2021-2032)
Figure 28. North America Food Grade Industrial Gas Revenue (USD Million) By Type (2021-2032)
Figure 29. North America Food Grade Industrial Gas Revenue (USD Million) By Application (2021-2032)
Figure 30. North America Food Grade Industrial Gas Revenue (USD Million) By Product (2021-2032)
Figure 31. Europe Food Grade Industrial Gas Revenue (USD Million) By Type (2021-2032)
Figure 32. Europe Food Grade Industrial Gas Revenue (USD Million) By Application (2021-2032)
Figure 33. Europe Food Grade Industrial Gas Revenue (USD Million) By Product (2021-2032)
Figure 34. Asia Pacific Food Grade Industrial Gas Revenue (USD Million) By Type (2021-2032)
Figure 35. Asia Pacific Food Grade Industrial Gas Revenue (USD Million) By Application (2021-2032)
Figure 36. Asia Pacific Food Grade Industrial Gas Revenue (USD Million) By Product (2021-2032)
Figure 37. South America Food Grade Industrial Gas Revenue (USD Million) By Type (2021-2032)
Figure 38. South America Food Grade Industrial Gas Revenue (USD Million) By Application (2021-2032)
Figure 39. South America Food Grade Industrial Gas Revenue (USD Million) By Product (2021-2032)
Figure 40. Middle East and Africa Food Grade Industrial Gas Revenue (USD Million) By Type (2021-2032)
Figure 41. Middle East and Africa Food Grade Industrial Gas Revenue (USD Million) By Application (2021-2032)
Figure 42. Middle East and Africa Food Grade Industrial Gas Revenue (USD Million) By Product (2021-2032)
By Type
Carbon Dioxide
Nitrogen
Oxygen
By Application
Freezing and Chilling
Packaging and Carbonation
By Product
Meat
Fish & Seafood
Dairy & Frozen Products
Beverages
Fruits & Vegetables
Convenience Foods
Bakery & Confectionery
Countries Analyzed
North America (US, Canada, Mexico)
Europe (Germany, UK, France, Spain, Italy, Russia, Rest of Europe)
Asia Pacific (China, India, Japan, South Korea, Australia, South East Asia, Rest of Asia)
South America (Brazil, Argentina, Rest of South America)
Middle East and Africa (Saudi Arabia, UAE, Rest of Middle East, South Africa, Egypt, Rest of Africa)
